Review
. 2022 Mar 8:9:841373.
doi: 10.3389/fmolb.2022.841373. eCollection 2022.

Networks and Graphs Discovery in Metabolomics Data Analysis and Interpretation

Affiliations
Review

Networks and Graphs Discovery in Metabolomics Data Analysis and Interpretation

Adam Amara et al. Front Mol Biosci. .

Abstract

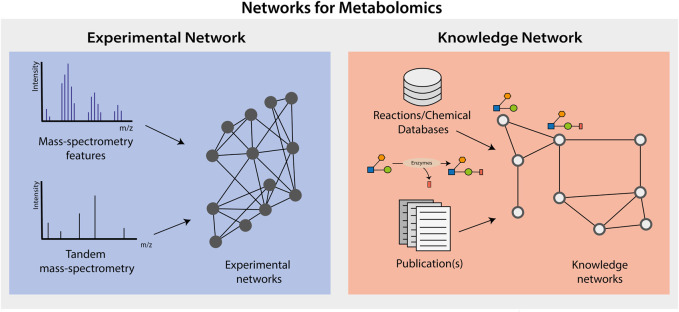
Both targeted and untargeted mass spectrometry-based metabolomics approaches are used to understand the metabolic processes taking place in various organisms, from prokaryotes, plants, fungi to animals and humans. Untargeted approaches allow to detect as many metabolites as possible at once, identify unexpected metabolic changes, and characterize novel metabolites in biological samples. However, the identification of metabolites and the biological interpretation of such large and complex datasets remain challenging. One approach to address these challenges is considering that metabolites are connected through informative relationships. Such relationships can be formalized as networks, where the nodes correspond to the metabolites or features (when there is no or only partial identification), and edges connect nodes if the corresponding metabolites are related. Several networks can be built from a single dataset (or a list of metabolites), where each network represents different relationships, such as statistical (correlated metabolites), biochemical (known or putative substrates and products of reactions), or chemical (structural similarities, ontological relations). Once these networks are built, they can subsequently be mined using algorithms from network (or graph) theory to gain insights into metabolism. For instance, we can connect metabolites based on prior knowledge on enzymatic reactions, then provide suggestions for potential metabolite identifications, or detect clusters of co-regulated metabolites. In this review, we first aim at settling a nomenclature and formalism to avoid confusion when referring to different networks used in the field of metabolomics. Then, we present the state of the art of network-based methods for mass spectrometry-based metabolomics data analysis, as well as future developments expected in this area. We cover the use of networks applications using biochemical reactions, mass spectrometry features, chemical structural similarities, and correlations between metabolites. We also describe the application of knowledge networks such as metabolic reaction networks. Finally, we discuss the possibility of combining different networks to analyze and interpret them simultaneously.

Keywords: experimental network; graph-based analysis; knowledge network; metabolic network; metabolism; systems biology; untargeted metabolomics.


Conflict of interest statement

Author RS is employed by Bruker BioSpin GmbH. The remaining authors declare that the research was conducted in the absence of any commercial or financial relationships that could be construed as a potential conflict of interest.

Figures

FIGURE 1
FIGURE 1
Graphical Abstract. In this review we will be presenting two major types of networks and graphs used to analyze and interpret metabolomics data, knowledge networks and experimental networks.
FIGURE 2
FIGURE 2
Metabolomics-based experimental networks. (A) Mass difference networks: the biochemical transformations entail gains and/or losses of atoms that lead to changes in the metabolites’ molecular formula and, therefore, changes in the exact mass of molecules connected via a reaction. Here, the biochemical transformation by a phosphatase causes the loss of a phosphate group (HPO3), leading to a mass difference of 79.966 between the substrate metabolite (Molecule (B) and the product metabolite (Molecule A). (B) Adduct and feature networks: metabolites have multiple possible adducts and features associated with them. Each detected adduct, isotopologue, and ion-source fragments can be represented as nodes. Adducts (e.g., M + H) are connected to corresponding or potential metabolites. Similarly, the isotopologues of an adduct are linked to the associated adduct nodes (e.g., 13C isotopologue of M + H). Finally, ion-source fragments (here in-source fragment 1) with their associated adducts and isotopologues can be linked to the corresponding node metabolite. (C) Structure similarity networks: the structural similarity between metabolites detected by MS methods can be observed and calculated based on their MS/MS spectra. The fragmentation patterns will be similar for two metabolites with a shared core structure (represented as circles, squares, and polygons), but a difference due to a chemical reaction (i.e., the residue represented by the red rectangle). The calculated similarity (i.e., 0.85) between two MS2 spectra is the weight of the edge linking the corresponding metabolite pair. (D) Correlation networks: the correlation between the abundances of two metabolites can be calculated and used as a weight for the edge (i.e., 0.88 or −0.69) between two metabolites’ node (i.e., between molecules A and B, or between molecules B and C). The correlation levels considered as non-significant (i.e., 0.18) can be ignored and excluded from the correlation network (i.e., the edge between molecules A and C).
FIGURE 3
FIGURE 3
Representation of knowledge as networks. (A) Genome-scale metabolic networks: reconstructed from different sources of knowledge, such as from the enzymes identified in the annotated genome of the organism under study, the metabolic reactions databases, and/or biochemical knowledge and literature. The known metabolic reactions in an organism are the basis to generate a genome-scale metabolic network, where the metabolites are represented as nodes that are linked by (directed or undirected) edges, which represent the reactions converting the metabolites. (B) Chemical ontology networks: structure of relationships represented as a semantic network, where the nodes represent chemicals or chemical classes as “concepts”, bearing all their properties and definition, and that are connected by class membership.
FIGURE 4
FIGURE 4
Multi-layer networks principle. Every network (either knowledge-based or experimental) is an independent layer. Common nodes (i.e., identified metabolites) are connected to themselves across the different layers by inter-layer edges. The set of nodes is common in the experimental layers, but we omitted some nodes for the sake of simplicity. The edges of the individual layers and between them can be used, for example, to identify potential metabolite annotations (Example I) and metabolic reactions (Example II). Multi-layer networks allow preserving the topology and organization of each individual network. In Example I, features 3 and 4 were identified as metabolites C and D, respectively. In both experimental layers, these two features are connected with each other and with feature 5. Similarly, in the knowledge-based layer, metabolites C and D are connected with each other and with metabolite E. Therefore, it is likely that feature 5 corresponds to metabolite E. In the same way, features 1 and 2, identified as metabolites A and B, respectively, are connected to each other in the experimental layers but not in the knowledge-based one. In Example II, the metabolite A and B are separated by a mass difference corresponding to known biotransformation (e.g., a phosphatase as in Figure 2A) in the layer 1 and are connected by a high structural similarity in layer 2. This represents a potential novel metabolic reaction occurring between metabolites A and B in layer 3.

Similar articles

Cited by

References

    1. Aguilar-Mogas A., Sales-Pardo M., Navarro M., Guimerà R., Yanes O. (2017). IMet: A Network-Based Computational Tool to Assist in the Annotation of Metabolites from Tandem Mass Spectra. Anal. Chem. 89 (6), 3474–3482. 10.1021/acs.analchem.6b04512 - DOI - PubMed
    1. Altman T., Travers M., Kothari A., Caspi R., Karp P. D. (2013). A Systematic Comparison of the MetaCyc and KEGG Pathway Databases. BMC Bioinformatics 14 (March), 112. 10.1186/1471-2105-14-112 - DOI - PMC - PubMed
    1. Ashburner M., Ball C. A., Blake J. A., Botstein D., Butler H., Cherry J. M., et al. (2000). Gene Ontology: Tool for the Unification of Biology. Nat. Genet. 25 (1), 25–29. 10.1038/75556 - DOI - PMC - PubMed
    1. Bajusz D., Rácz A., Héberger K. (2015). Why Is Tanimoto Index an Appropriate Choice for Fingerprint-Based Similarity Calculations? J. Cheminform 7, 1–13. 10.1186/S13321-015-0069-3 - DOI - PMC - PubMed
    1. Bánky D., Iván G., Grolmusz V. (2013). Equal Opportunity for Low-Degree Network Nodes: A PageRank-Based Method for Protein Target Identification in Metabolic Graphs. PLoS ONE 8 (1), e54204. 10.1371/journal.pone.0054204 - DOI - PMC - PubMed

LinkOut - more resources