

Transcriptional atlas analysis from multiple tissues reveals the expression specificity patterns in beef cattle
- PMID: 35351103
- PMCID: PMC8966188
- DOI: 10.1186/s12915-022-01269-4
Transcriptional atlas analysis from multiple tissues reveals the expression specificity patterns in beef cattle
Abstract
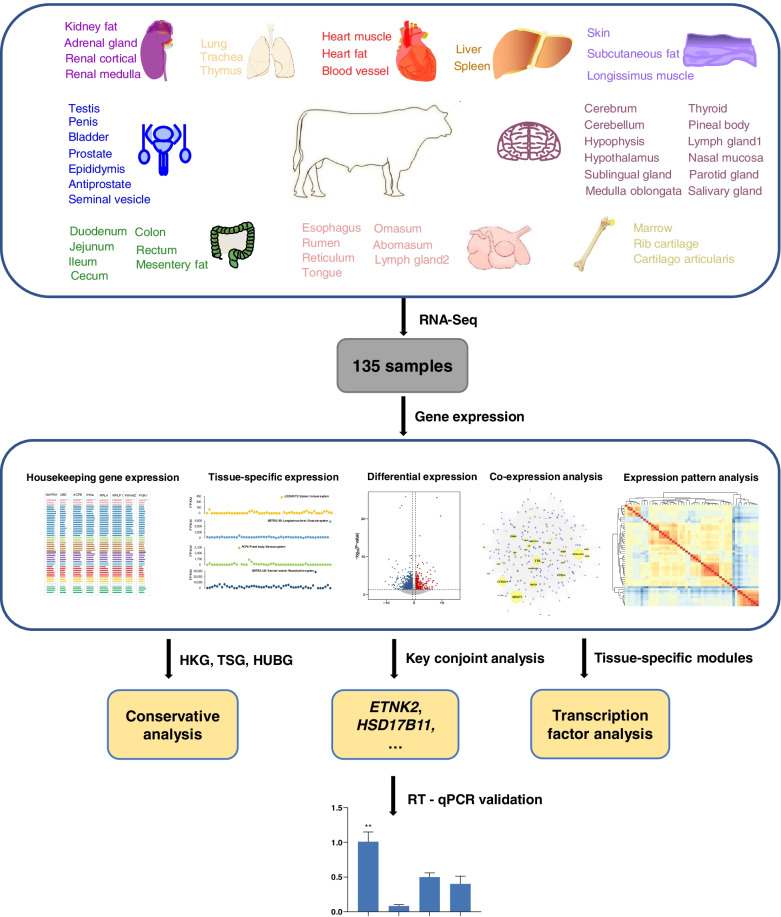
Background: A comprehensive analysis of gene expression profiling across tissues can provide necessary information for an in-depth understanding of their biological functions. We performed a large-scale gene expression analysis and generated a high-resolution atlas of the transcriptome in beef cattle.
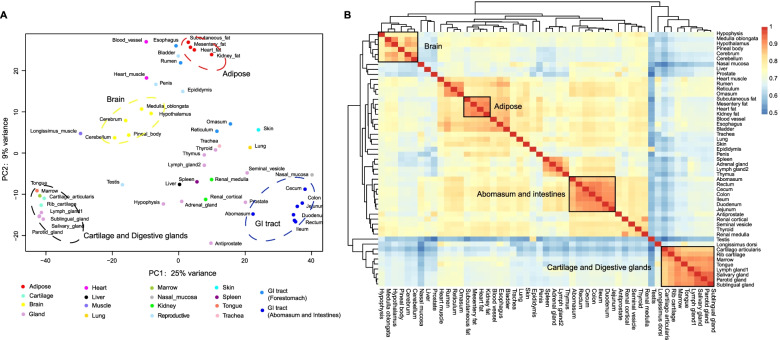
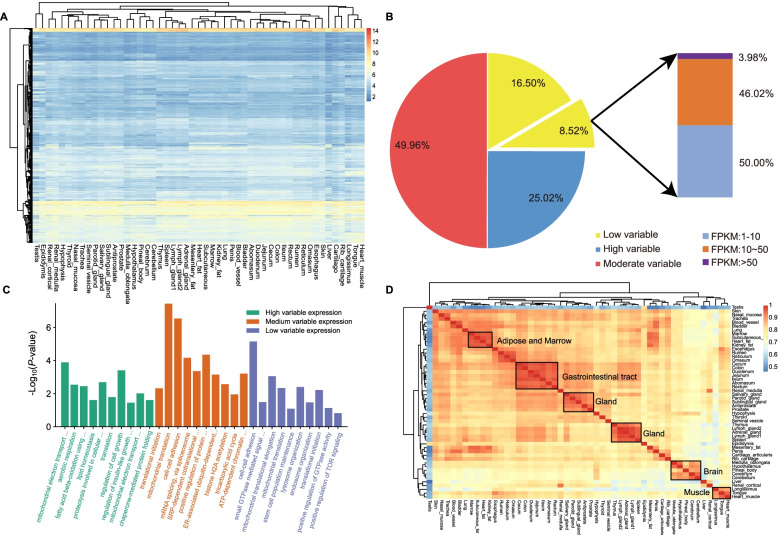
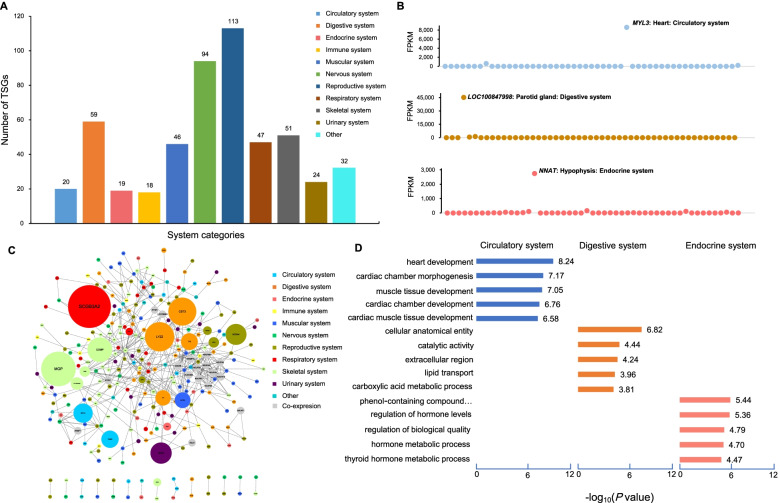
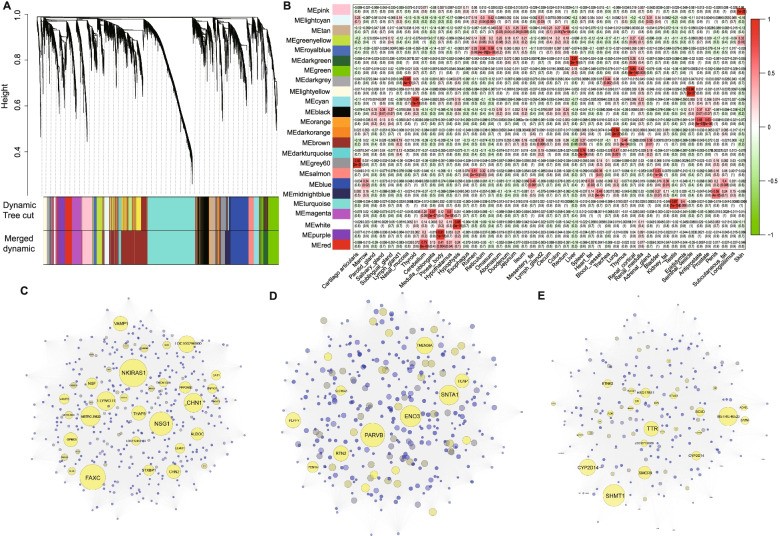
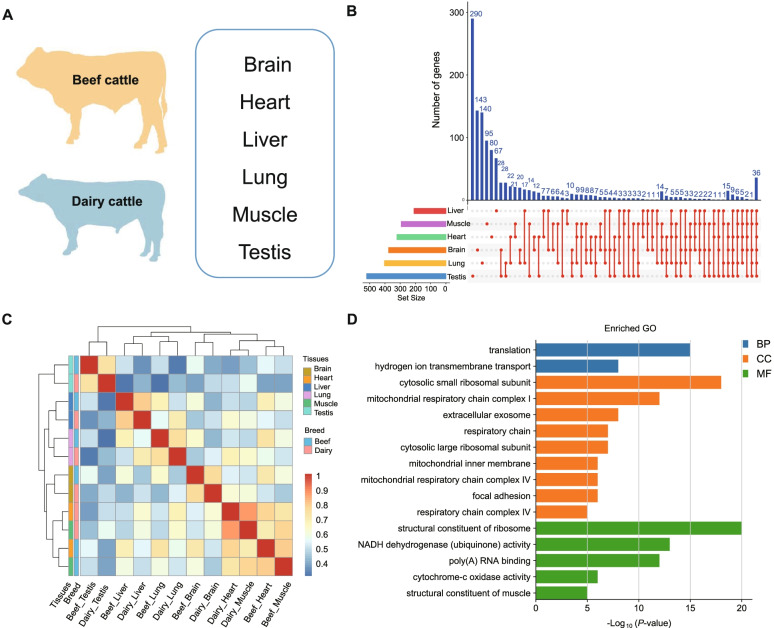
Results: Our transcriptome atlas was generated from 135 bovine tissues in adult beef cattle, covering 51 tissue types of major organ systems (e.g., muscular system, digestive system, immune system, reproductive system). Approximately 94.76% of sequencing reads were successfully mapped to the reference genome assembly ARS-UCD1.2. We detected a total of 60,488 transcripts, and 32% of them were not reported before. We identified 2654 housekeeping genes (HKGs) and 477 tissue-specific genes (TSGs) across tissues. Using weighted gene co-expression network analysis, we obtained 24 modules with 237 hub genes (HUBGs). Functional enrichment analysis showed that HKGs mainly maintain the basic biological activities of cells, while TSGs were involved in tissue differentiation and specific physiological processes. HKGs in bovine tissues were more conserved in terms of expression pattern as compared to TSGs and HUBGs among multiple species. Finally, we obtained a subset of tissue-specific differentially expressed genes (DEGs) between beef and dairy cattle and several functional pathways, which may be involved in production and health traits.
Conclusions: We generated a large-scale gene expression atlas across the major tissues in beef cattle, providing valuable information for enhancing genome assembly and annotation. HKGs, TSGs, and HUBGs further contribute to better understanding the biology and evolution of multiple tissues in cattle. DEGs between beef and dairy cattle also fill in the knowledge gaps about differential transcriptome regulation of bovine tissues underlying economically important traits.
Keywords: Beef cattle; Co-expression network; Differentially expressed genes; Gene expression; Housekeeping genes; Tissue-specific genes.
© 2022. The Author(s).
Conflict of interest statement
The authors declare that they have no competing interests.
Figures
Similar articles
-
Expression patterns of housekeeping genes and tissue-specific genes in black goats across multiple tissues.Sci Rep. 2024 Sep 19;14(1):21896. doi: 10.1038/s41598-024-72844-8. Sci Rep. 2024. PMID: 39300207 Free PMC article.
-
Expression Profile of Housekeeping Genes and Tissue-Specific Genes in Multiple Tissues of Pigs.Animals (Basel). 2022 Dec 15;12(24):3539. doi: 10.3390/ani12243539. Animals (Basel). 2022. PMID: 36552460 Free PMC article.
-
Machine Learning-Based Analysis of Differentially Expressed Genes in the Muscle Transcriptome Between Beef Cattle and Dairy Cattle.Int J Mol Sci. 2025 May 23;26(11):5046. doi: 10.3390/ijms26115046. Int J Mol Sci. 2025. PMID: 40507856 Free PMC article.
-
Symposium review: Advances in sequencing technology herald a new frontier in cattle genomics and genome-enabled selection.J Dairy Sci. 2020 Jun;103(6):5278-5290. doi: 10.3168/jds.2019-17693. Epub 2020 Apr 22. J Dairy Sci. 2020. PMID: 32331872 Review.
-
Beef Cattle Genome Project: Advances in Genome Sequencing, Assembly, and Functional Genes Discovery.Int J Mol Sci. 2024 Jun 28;25(13):7147. doi: 10.3390/ijms25137147. Int J Mol Sci. 2024. PMID: 39000250 Free PMC article. Review.
Cited by
-
Expression patterns of housekeeping genes and tissue-specific genes in black goats across multiple tissues.Sci Rep. 2024 Sep 19;14(1):21896. doi: 10.1038/s41598-024-72844-8. Sci Rep. 2024. PMID: 39300207 Free PMC article.
-
Flavor, Lipid, and Transcriptomic Profiles of Chinese Wagyu Beef Cuts: Insights into Meat Quality Differences.Foods. 2025 Feb 20;14(5):716. doi: 10.3390/foods14050716. Foods. 2025. PMID: 40077419 Free PMC article.
-
Large-scale genomic and transcriptomic analyses elucidate the genetic basis of high meat yield in chickens.J Adv Res. 2024 Jan;55:1-16. doi: 10.1016/j.jare.2023.02.016. Epub 2023 Mar 5. J Adv Res. 2024. PMID: 36871617 Free PMC article.
-
Expression Profile of Housekeeping Genes and Tissue-Specific Genes in Multiple Tissues of Pigs.Animals (Basel). 2022 Dec 15;12(24):3539. doi: 10.3390/ani12243539. Animals (Basel). 2022. PMID: 36552460 Free PMC article.
-
Expression Profiles of Housekeeping Genes and Tissue-Specific Genes in Different Tissues of Chinese Sturgeon (Acipenser sinensis).Animals (Basel). 2024 Nov 21;14(23):3357. doi: 10.3390/ani14233357. Animals (Basel). 2024. PMID: 39682323 Free PMC article.
References
-
- Wiggans GR, Cole JB, Hubbard SM, Sonstegard TS. Genomic selection in dairy cattle: the USDA experience. Annu Rev Anim Biosci. 2017;5:309–327. - PubMed
-
- Giuffra E, Tuggle CK. Functional annotation of animal genomes (FAANG): current achievements and roadmap. Annu Rev Anim Biosci. 2019;7:65–88. - PubMed
-
- Georges M, Charlier C, Hayes B. Harnessing genomic information for livestock improvement. Nat Rev Genet. 2019;20(3):135–156. - PubMed
Publication types
MeSH terms
LinkOut - more resources
Full Text Sources
