. 2022 Aug;20(4):670-687.
doi: 10.1016/j.gpb.2021.08.016. Epub 2022 Mar 26.

New Metabolic Alterations and A Predictive Marker Pipecolic Acid in Sera for Esophageal Squamous Cell Carcinoma

Affiliations

New Metabolic Alterations and A Predictive Marker Pipecolic Acid in Sera for Esophageal Squamous Cell Carcinoma

Lei Liu et al. Genomics Proteomics Bioinformatics. 2022 Aug.

Abstract

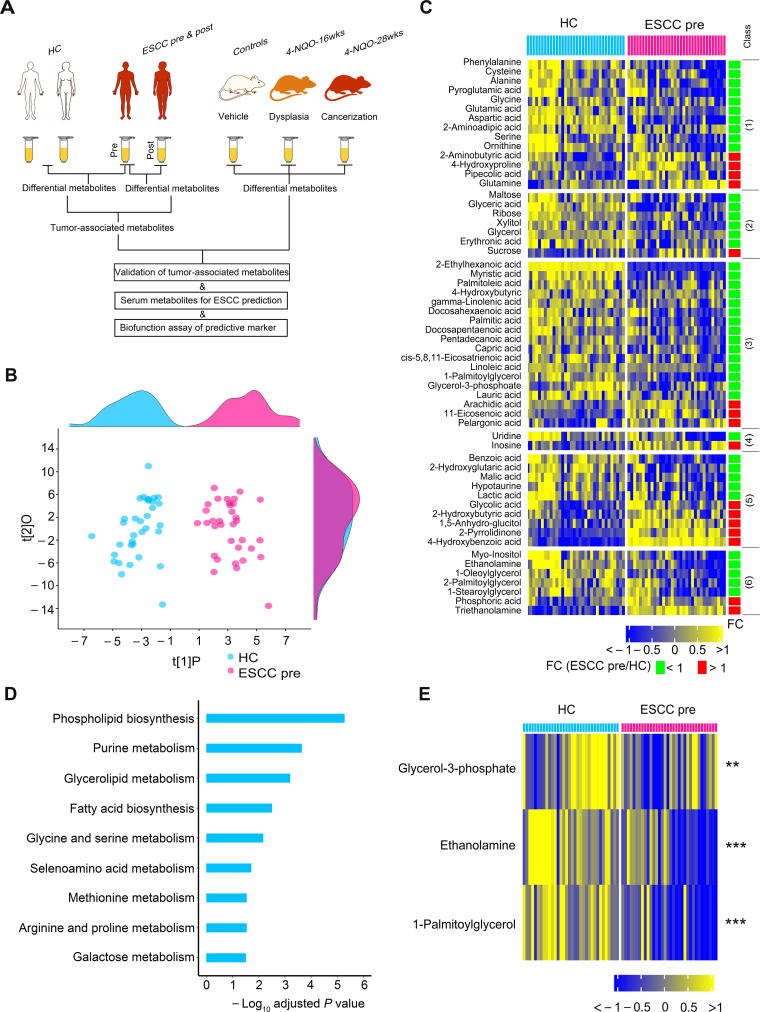
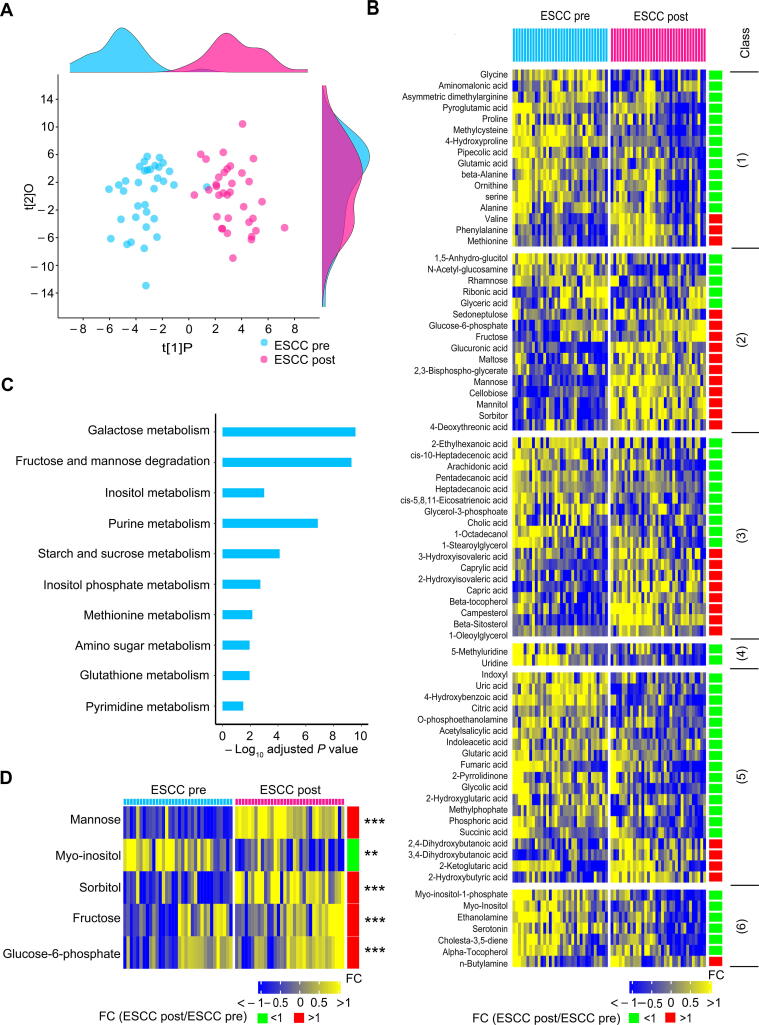
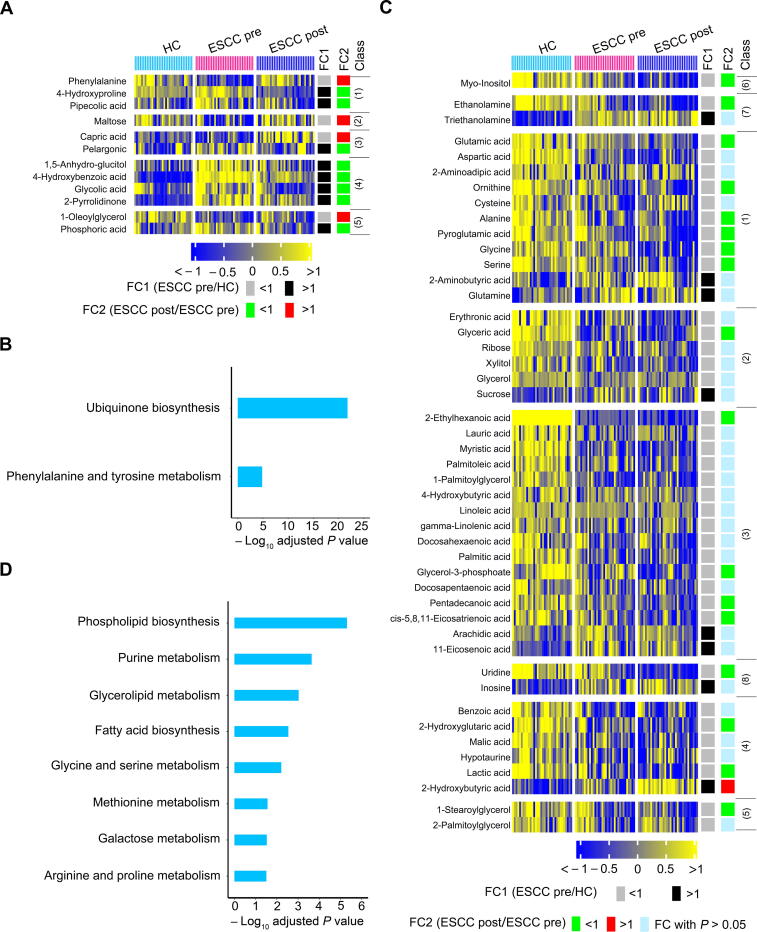
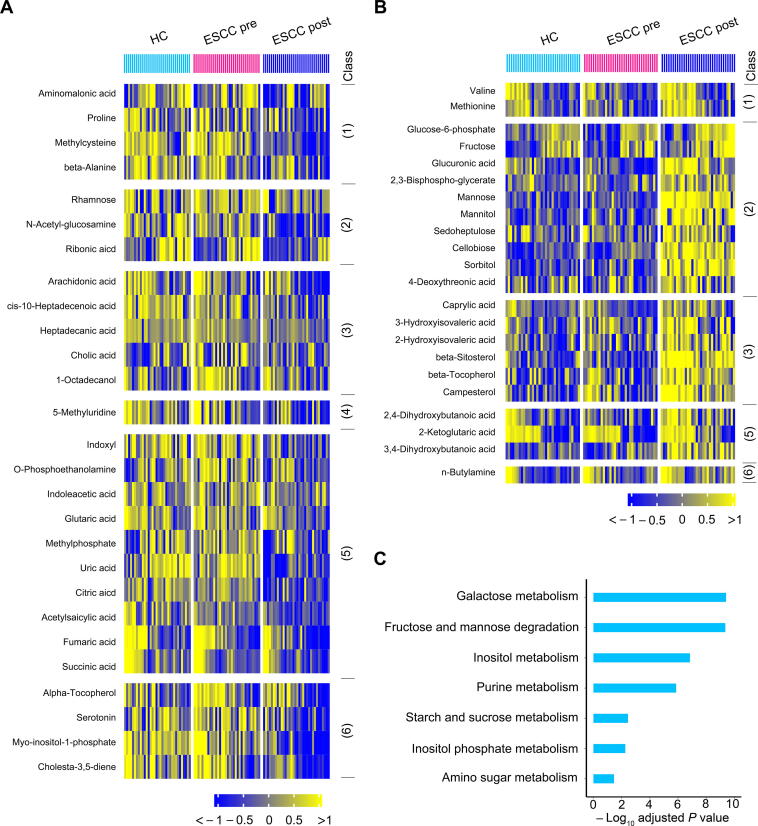
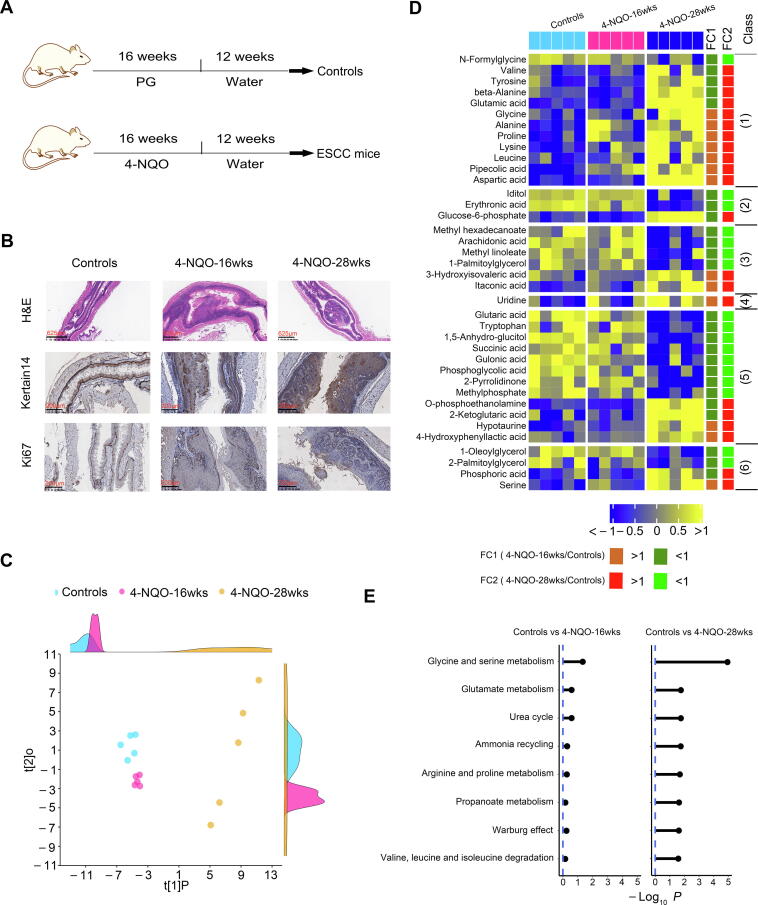
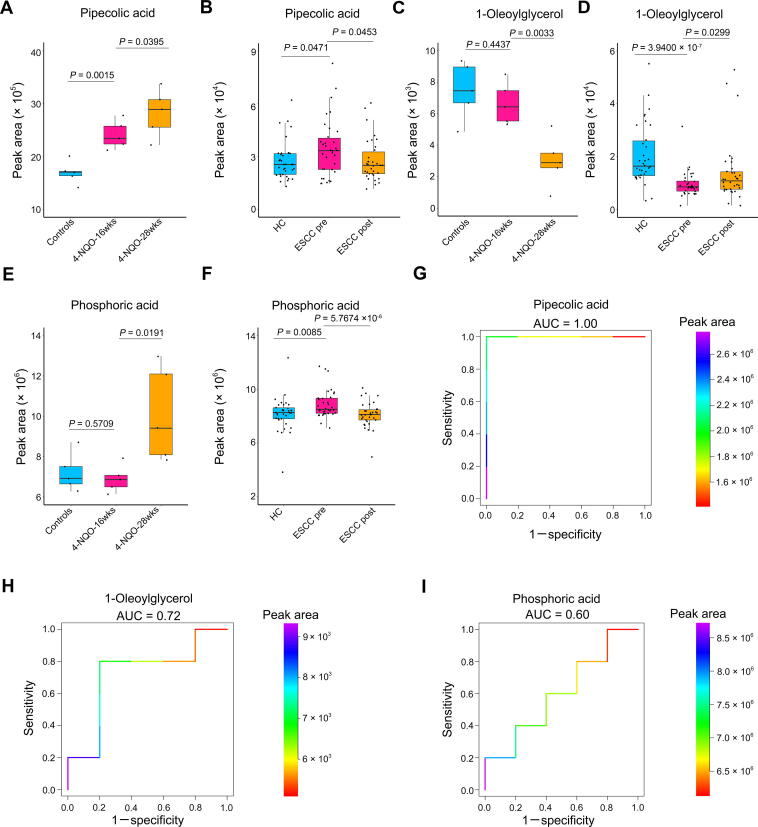
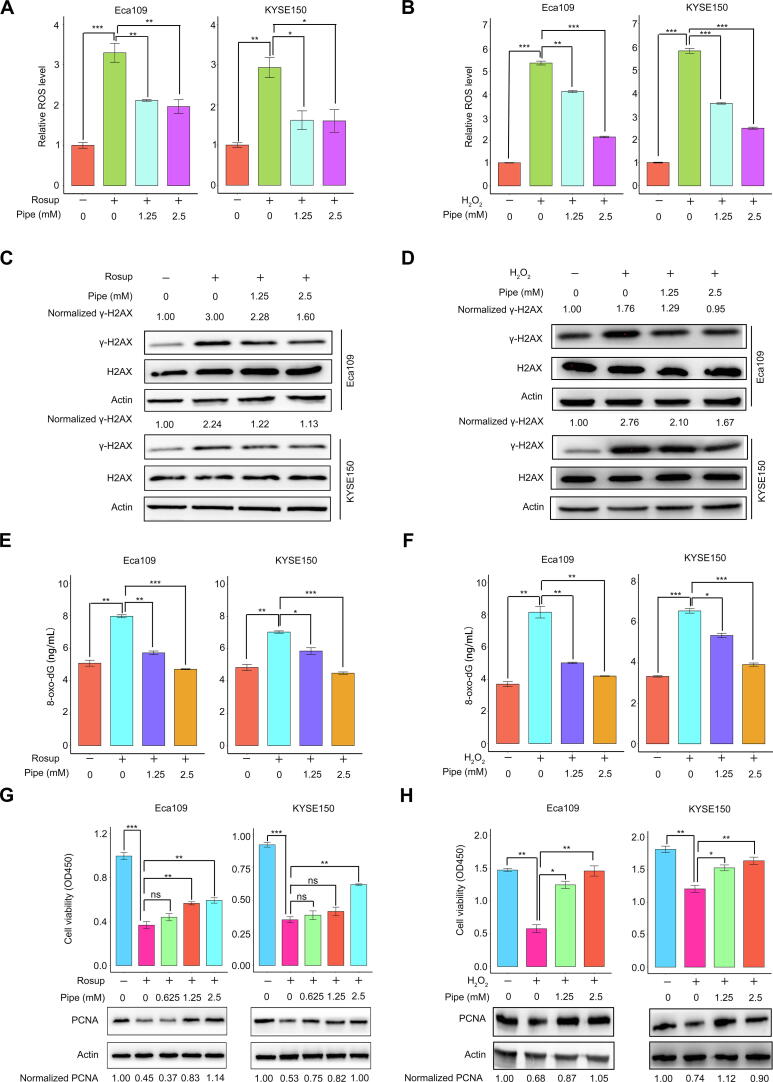
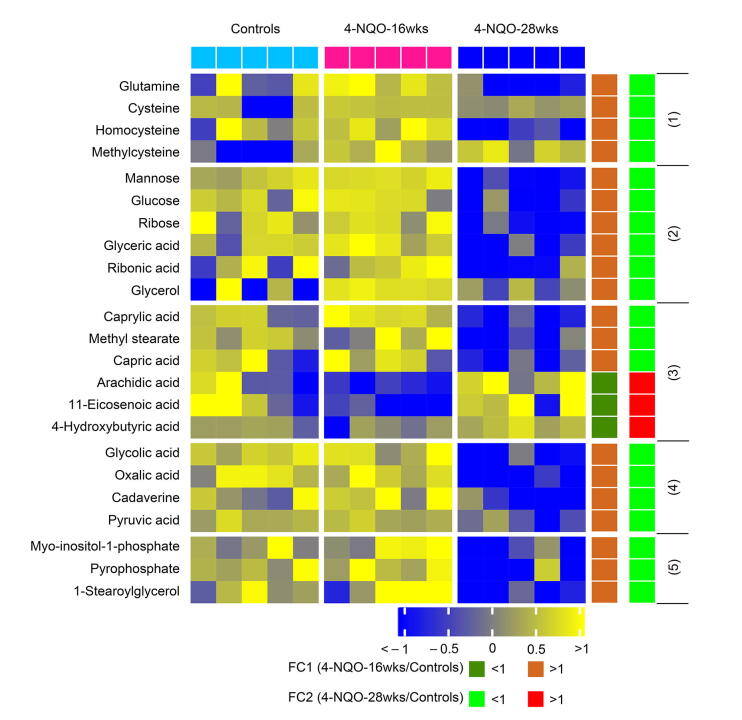
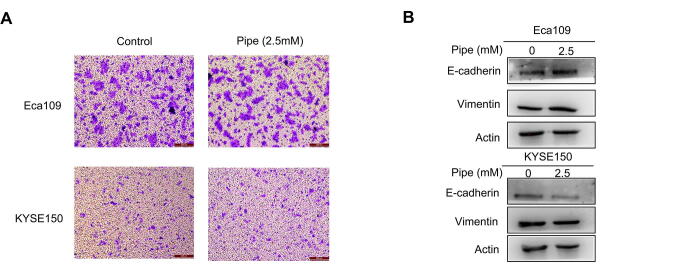
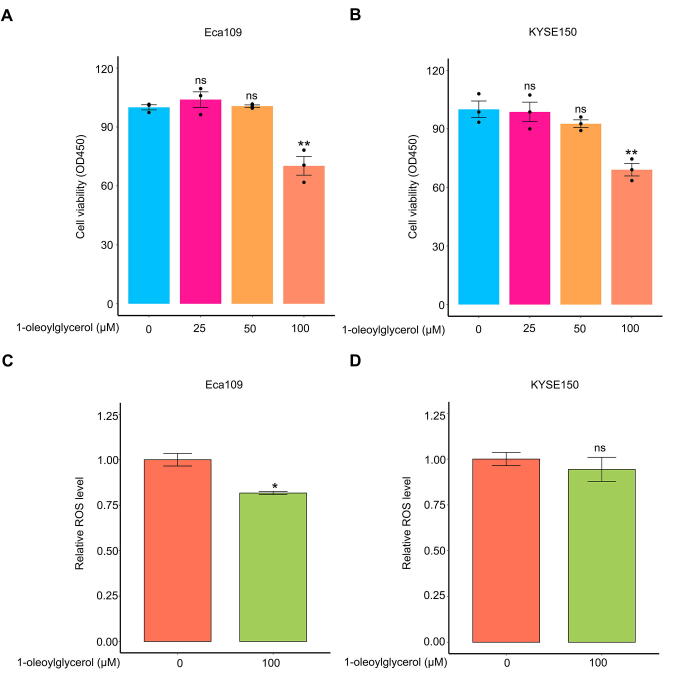
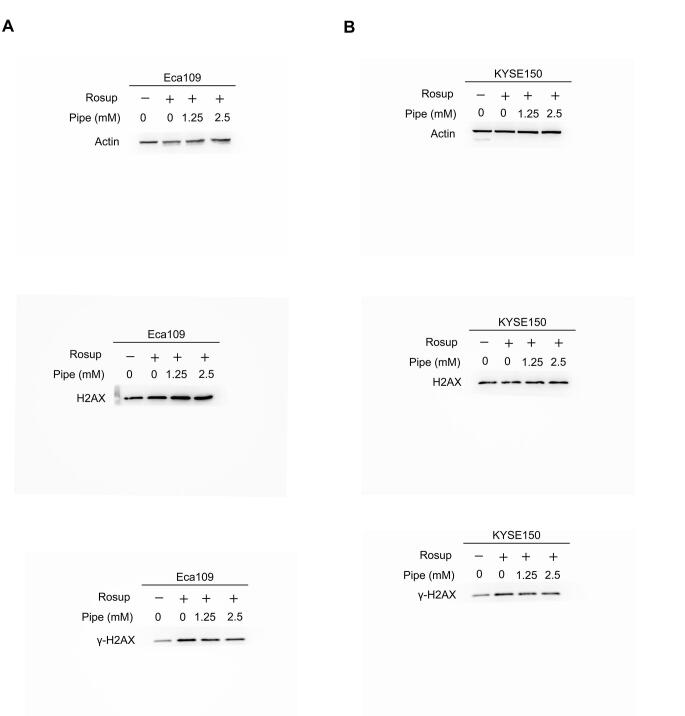
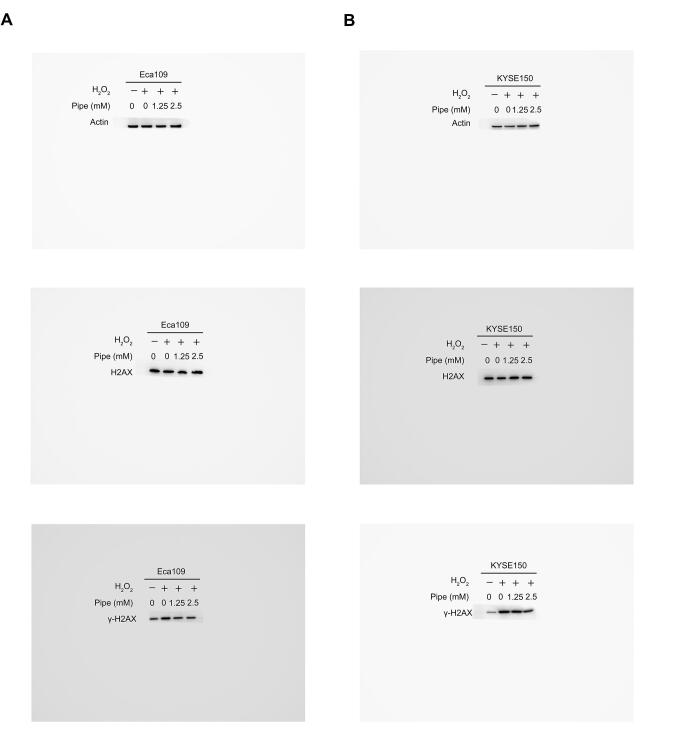
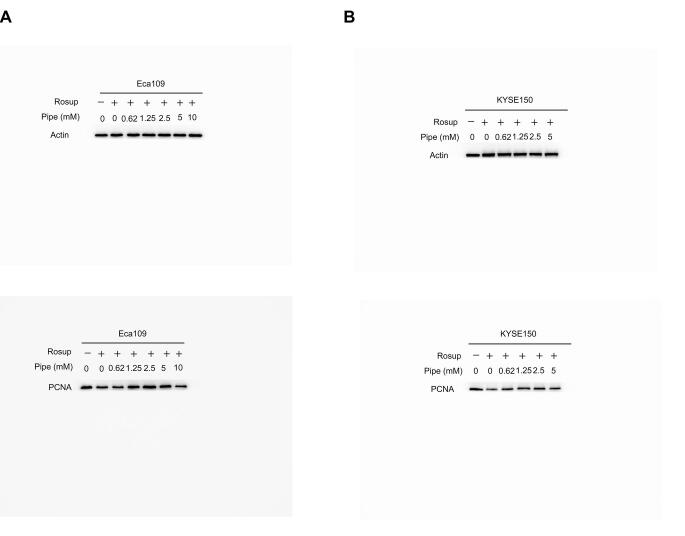
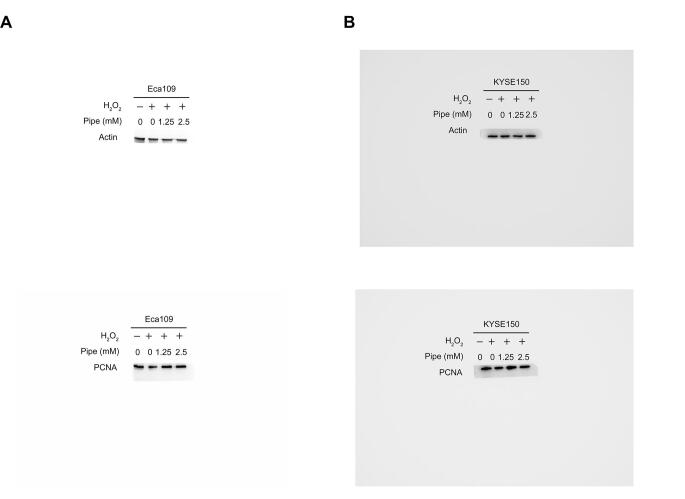
Esophageal squamous cell carcinoma (ESCC) is a major histological subtype of esophageal cancer with a poor prognosis. Although several serum metabolomic investigations have been reported, ESCC tumor-associated metabolic alterations and predictive biomarkers in sera have not been defined. Here, we enrolled 34 treatment-naive patients with ESCC and collected their pre- and post-esophagectomy sera together with the sera from 34 healthy volunteers for a metabolomic survey. Our comprehensive analysis identified ESCC tumor-associated metabolic alterations as represented by a panel of 12 serum metabolites. Notably, postoperative abrosia and parenteral nutrition substantially perturbed the serum metabolome. Furthermore, we performed an examination using sera from carcinogen-induced mice at the dysplasia and ESCC stages and identified three ESCC tumor-associated metabolites conserved between mice and humans. Notably, among these metabolites, the level of pipecolic acid was observed to be progressively increased in mouse sera from dysplasia to cancerization, and it could be used to accurately discriminate between mice at the dysplasia stage and healthy control mice. Furthermore, this metabolite is essential for ESCC cells to restrain oxidative stress-induced DNA damage and cell proliferation arrest. Together, this study revealed a panel of 12 ESCC tumor-associated serum metabolites with potential for monitoring therapeutic efficacy and disease relapse, presented evidence for refining parenteral nutrition composition, and highlighted serum pipecolic acid as an attractive biomarker for predicting ESCC tumorigenesis.

Keywords: Esophageal squamous cell carcinoma; Esophagectomy; Pipecolic acid; Predictive potential; Serum metabolome.


Figures

Figure 1
Figure 1
Serum metabolic signature was altered in preoperative patients withESCCas relative to HCs A. Study design. Serum samples from patients with ESCC (pre-esophagectomy versus post-esophagectomy) and HCs were harvested for the identification of ESCC tumor-associated serum metabolites. Meanwhile, serum samples from control mice and 4-NQO-treated mice at the dysplasia and ESCC stages were collected for the discovery of ESCC tumor-associated metabolites conserved between mice and humans as well as serum metabolite markers for ESCC prediction. Finally, functional assays of the predictive metabolite marker were conducted. B. OPLS-DA score plot showing a global metabolic difference in sera between preoperative ESCC patients and HCs. The density plots of principal component 1 and principal component 2 are shown on the top and right-hand side of the OPLS-DA score plots, respectively. C. Heatmap showing 58 differentially expressed serum metabolites in preoperative ESCC patients compared to HCs. The metabolites were subclassified as follows: 1) amino acids, 2) carbohydrates, 3) lipids including fatty acids, 4) nucleotides, 5) organic acids, and 6) unclassified. D. Metabolic pathway enrichment analysis using differential metabolites between preoperative ESCC patients and HCs. E. Heatmap showing the differential serum metabolites involved in the most disturbed metabolic pathway phospholipid biosynthesis between preoperative patients with ESCC and HCs. ESCC, esophageal squamous cell carcinoma; HC, healthy control; 4-NQO, 4-nitroquinoline 1-oxide; OPLS-DA, orthogonal partial least squares-discriminant analysis; ESCC pre, ESCC pre-esophagectomy; ESCC post, ESCC post-esophagectomy; FC, fold change.
Figure 2
Figure 2
Serum metabolic feature was disturbed in patients with ESCC at the postoperative stage relative to the preoperative stage A. OPLS-DA score plot showing modified global metabolism in postoperative ESCC patients compared to preoperative patients. The density plots of principal component 1 and principal component 2 are displayed on the top and right-hand side of the OPLS-DA score plots, respectively. B. Heatmap exhibiting 78 differential metabolites in postoperative ESCC patients relative to preoperative ESCC patients. The metabolites were subclassified as follows: 1) amino acids, 2) carbohydrates, 3) lipids including fatty acids, 4) nucleotides, 5) organic acids, and 6) unclassified. C. Metabolic pathway enrichment analysis using differential metabolites between preoperative and postoperative patients with ESCC. D. Heatmap showing the differential serum metabolites involved in the most disturbed metabolic pathway galactose metabolism between preoperative and postoperative patients with ESCC. **, P < 0.01; ***, P < 0.001.
Figure 3
Figure 3
A few of 58 differential serum metabolites between preoperative patients and HCs were recovered in postoperative patientsinthe HC direction Twelve metabolites were significantly restored in postoperative ESCC sera in the HC direction (A), and metabolic pathway enrichment analysis of these metabolites (B). The remaining 46 metabolites changed in postoperative ESCC sera in an opposite HC direction or not significantly altered in postoperative ESCC sera relative to preoperative ESCC sera (C), and metabolic pathway enrichment analysis of these metabolites (D). The metabolites in the heatmaps were subclassified as follows: 1) amino acids, 2) carbohydrates, 3) lipids including fatty acids, 4) organic acids, 5) unclassified, 6) alcohols, 7) amines, and 8) nucleotides.
Figure 4
Figure 4
Metabolic fluctuation induced by postoperative abrosia and parenteral nutrition For the 108 serum metabolites not altered between preoperative patients with ESCC and HCs, the levels of 27 of them (25.00%) were significantly down-regulated in postoperative ESCC patients as compared to preoperative patients with ESCC or HCs (A), while the levels of 22 of them (20.37%) were remarkably increased in postoperative ESCC patients relative to preoperative ESCC patients or HCs (B). These 49 changed metabolites were subclassified as follows: 1) amino acids, 2) carbohydrates, 3) lipids including fatty acids, 4) nucleotides, 5) organic acids, and 6) unclassified. C. Metabolic pathway enrichment analysis of the above 49 altered metabolites.
Figure 5
Figure 5
Progressively modified serum metabolome of carcinogen-induced mice from dysplasia to ESCC A. A scheme depicting 4-NQO induced ESCC mouse model from dysplasia to ESCC. B. Representative images of H&E and IHC staining of esophageal tissues of control mice and 4-NQO-treated mice. C. PLS score plot of serum metabolic profiles of control mice, 4-NQO-induced mice at dysplasia stage (4NQO-16wks), and 4-NQO-induced mice at cancerization stage (4NQO-28wks). The density plots of principal component 1 and principal component 2 are displayed on the top and right-hand sides of the PLS score plots, respectively. Heatmap displaying progressive changes of serum metabolites of mice from normal control to cancerization stage (D) and metabolic pathway enrichment analysis of these metabolites (E). Progressively changed metabolites in the heatmap were subclassified as follows: 1) amino acids, 2) carbohydrates, 3) lipids including fatty acids, 4) nucleotides, 5) organic acids, and 6) unclassified. PG, propylene glycol; 4-NQO, 4-nitroquinoline 1-oxide; PLS, partial least-squares regression.
Figure 6
Figure 6
ESCC tumor-associated serum metabolites conserved between mice and humans with predictive potential for carcinogenesis A. Abundance of serum pipecolic acid among control mice (n = 5), 4-NQO-induced mice at the dysplasia stage (4NQO-16wks) (n = 5), and 4-NQO-induced mice at the cancerization stage (4NQO-28wks) (n = 5). B. Abundance of serum pipecolic acid among HCs (n = 34), preoperative ESCC patients (n = 34), and postoperative ESCC patients (n = 34). C. Abundance of serum 1-oleoylglycerol among control mice (n = 5), 4-NQO-induced mice at the dysplasia stage (4-NQO-16wks) (n = 5) and 4-NQO-induced mice at the cancerization stage (4-NQO-28-wks) (n = 5). D. Abundance of serum 1-oleoylglycerol among HCs (n = 34), preoperative ESCC patients (n = 34), and postoperative ESCC patients (n = 34). E. Abundance of serum phosphoric acid among control mice (n = 5), 4-NQO-induced mice at the dysplasia stage (4-NQO-16-wks) (n = 5), and 4-NQO-induced mice at the cancerization stage (4-NQO-28wks) (n = 5). F. Abundance of serum phosphoric acid among HCs (n = 34), preoperative ESCC patients (n = 34) and postoperative ESCC patients (n = 34). ROC curves exhibiting the diagnostic capabilities of serum pipecolic acid (G), 1-oleoylglycerol (H), and phosphoric acid (I) to discriminate between healthy controls (n = 5) and precancerous mice (n = 5). Color key indicating metabolite abundance. AUC, area under the curve.
Figure 7
Figure 7
The antioxidant activity of the predictive biomarker pipecolic acid Impact of pipecolic acid on ROS production induced by Rosup (A) or H2O2 (B) in Eca109 and KYSE150 cells. The influence of pipecolic acid on the expression of the DNA damage marker γ-H2AX induced by Rosup (C) or H2O2 (D) in Eca109 and KYSE150 cells, respectively. The influence of pipecolic acid on the production of the DNA oxidative damage marker 8-oxo-dG induced by Rosup (E) or H2O2 (F) in Eca109 and KYSE150 cells, respectively. The impact of pipecolic acid on the proliferation and PCNA expression of Eca109 and KYSE150 cells treated with Rosup (G) or H2O2 (H). Error bars represent mean ± SEM. *, P < 0.05; **, P < 0.01; ***, P < 0.001; ns, no significance (two-tailed Student’s t-test). Pipe, pipecolic acid; ROS, reactive oxygen species; 8-oxo-dG, 8-oxo-7,8-dihydro-20-deoxyguanosine; PCNA, proliferating cell nuclear antigen.
Supplementary figure S1
Heatmap displaying differential serum metabolites among control mice, carcinogen-induced mice at dysplasia stage (4-NQO-16wks), and carcinogen-induced mice at ESCC stage (4-NQO-28wks) with no progressive changes.
Supplementary figure S2
The impact of pipecolic acid on ESCC cell migration and expression of EMT protein markers. A. Transwell assay revealing the influence of pipecolic acid on ESCC cell migration. B. Western blot showing the impact of pipecolic acid on the expression of EMT protein markers in ESCC cells. Pipe, pipecolic acid.
Supplementary figure S3
The impact of 1-oleoylglycerol on ESCC cell growth and ROS generation. A. and B. The inhibitory effect of 1-oleoylglycerol on ESCC cell growth. C. and D. The influence of 1-oleoylglycerol on ROS production of ESCC cells. Error bars represent mean ± SEM. *, P < 0.05; **, P < 0.01; ***, P < 0.001, by comparison with the group treated with 0 μM 1-oleoylglycerol, two-tailed Student’s t-test. Ns, no significance; ROS, reactive oxygen species.
Supplementary figure S4
The original gels for western blot assays of Figure 7C.
Supplementary figure S5
The original gels for western blot assays of Figure 7D.
Supplementary figure S6
The original gels for western blot assays of Figure 7G.
Supplementary figure S7
The original gels for western blot assays of Figure 7H.
Supplementary figure S8
The original gels for western blot assays of Figure S2B.

Similar articles

Cited by

References

    1. Bray F., Ferlay J., Soerjomataram I., Siegel R.L., Torre L.A., Jemal A. Global cancer statistics 2018: GLOBOCAN estimates of incidence and mortality worldwide for 36 cancers in 185 countries. CA Cancer J Clin. 2018;68:394–424. - PubMed
    1. Lagergren J., Smyth E., Cunningham D., Lagergren P. Oesophageal cancer. Lancet. 2017;390:2383–2396. - PubMed
    1. Arnold M., Soerjomataram I., Ferlay J., Forman D. Global incidence of oesophageal cancer by histological subtype in 2012. Gut. 2015;64:381–387. - PubMed
    1. Wang A.H., Liu Y., Wang B., He Y.X., Fang Y.X., Yan Y.P. Epidemiological studies of esophageal cancer in the era of genome-wide association studies. World J Gastrointest Pathophysiol. 2014;5:335–343. - PMC - PubMed
    1. Raghu Subramanian C., Triadafilopoulos G. Diagnosis and therapy of esophageal squamous cell dysplasia and early esophageal squamous cell cancer. Gastroenterol Rep. 2017;5:247–257.

MeSH terms