. 2022 Jul 6;30(7):2568-2583.
doi: 10.1016/j.ymthe.2021.10.028. Epub 2022 Mar 26.

FOSL1 promotes proneural-to-mesenchymal transition of glioblastoma stem cells via UBC9/CYLD/NF-κB axis

Affiliations

FOSL1 promotes proneural-to-mesenchymal transition of glioblastoma stem cells via UBC9/CYLD/NF-κB axis

Zhengxin Chen et al. Mol Ther. .

Abstract

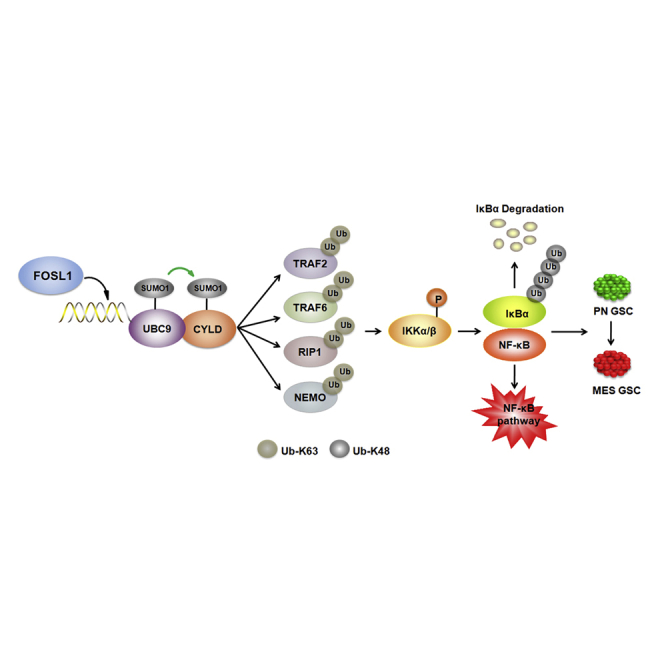
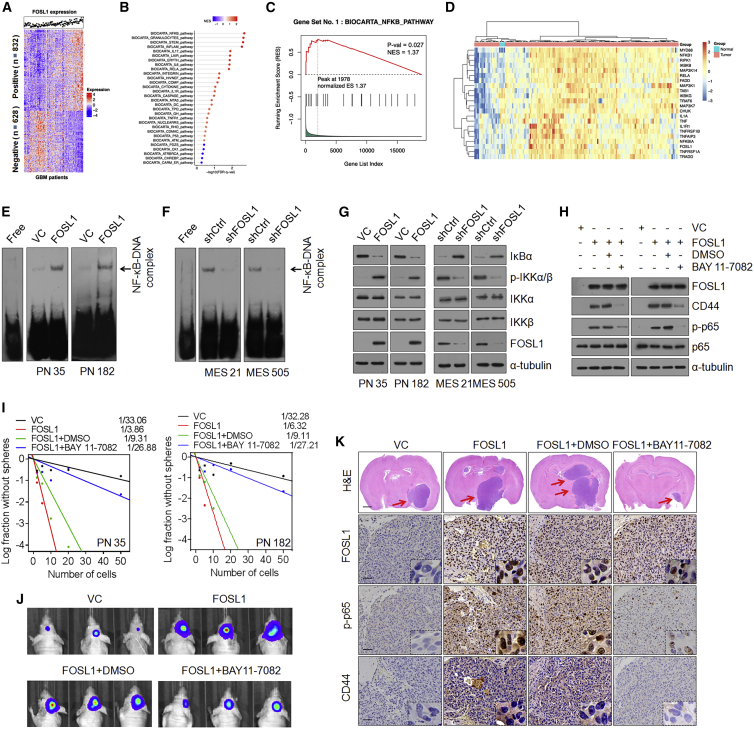
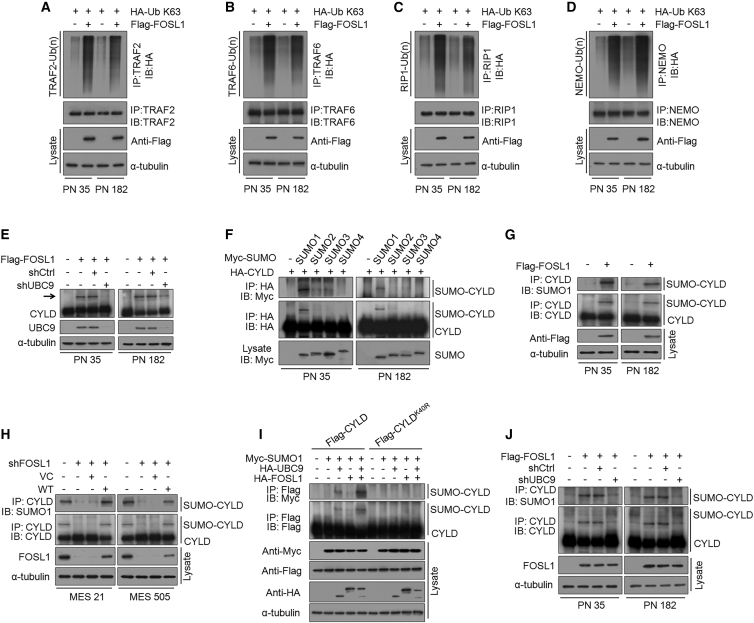
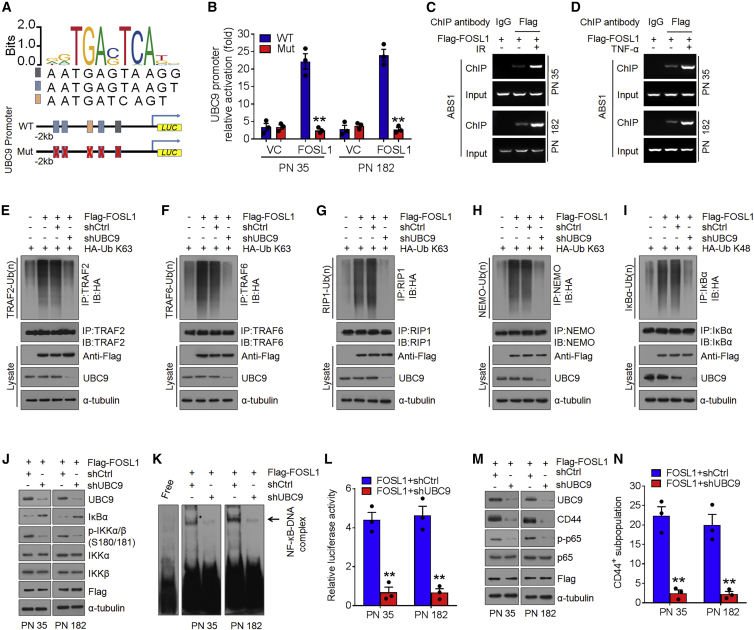
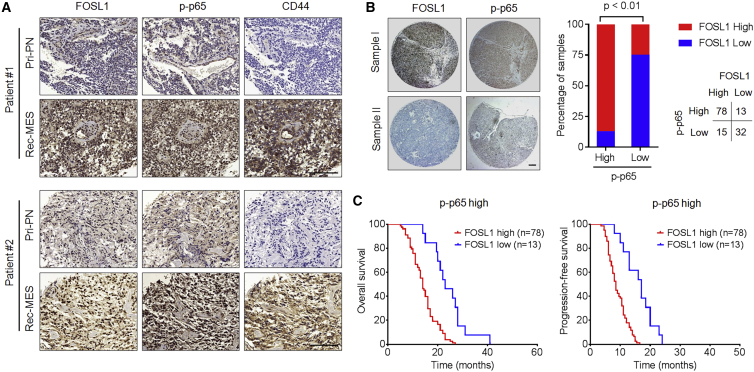
Proneural (PN) to mesenchymal (MES) transition (PMT) is a crucial phenotypic shift in glioblastoma stem cells (GSCs). However, the mechanisms driving this process remain poorly understood. Here, we report that Fos-like antigen 1 (FOSL1), a component of AP1 transcription factor complexes, is a key player in regulating PMT. FOSL1 is predominantly expressed in the MES subtype, but not PN subtype, of GSCs. Knocking down FOSL1 expression in MES GSCs leads to the loss of MES features and tumor-initiating ability, whereas ectopic expression of FOSL1 in PN GSCs is able to induce PMT and maintain MES features. Moreover, FOSL1 facilitates ionizing radiation (IR)-induced PMT and radioresistance of PN GSCs. Inhibition of FOSL1 enhances the anti-tumor effects of IR by preventing IR-induced PMT. Mechanistically, we find that FOSL1 promotes UBC9-dependent CYLD SUMOylation, thereby inducing K63-linked polyubiquitination of major nuclear factor κB (NF-κB) intermediaries and subsequent NF-κB activation, which results in PMT induction in GSCs. Our study underscores the importance of FOSL1 in the regulation of PMT and suggests that therapeutic targeting of FOSL1 holds promise to attenuate molecular subtype switching in patients with glioblastomas.

Keywords: FOSL1; UBC9/CYLD/NF-κB axis; glioblastoma stem cells; proneural-to-mesenchymal transition.


Conflict of interest statement

Declaration of interests The authors declare no competing interests.

Figures

None
Graphical abstract
Figure 1
Figure 1
FOSL1 maintains the MES phenotype in GSCs (A) Immunoblot (IB) analysis of FOSL1, CD44, ALDH1A3, SOX2, OLIG2, and UBC9 in NHAs, two MES GSCs, and two PN GSCs. α-Tubulin was used as internal control. (B) qRT-PCR analysis of FOSL1 mRNA expression in ALDH1-positive and ALDH1-negative subpopulations of MES 21 glioma spheres. (C) IB analysis of FOSL1 protein expression in ALDH1-positive and ALDH1-negative subpopulations of MES 21 glioma spheres. α-Tubulin was used as internal control. (D) Representative immunofluorescence (IF) images of FOSL1 and CD44 expression in MES 21 GSCs. FOSL1 is in red and CD44 in green. Nuclei were counterstained with DAPI (blue). Scale bar, 25 μm. (E) Representative IF images of FOSL1 and OLIG2 expression in PN 35 GSCs. FOSL1 is in red and OLIG2 in green. Nuclei were counterstained with DAPI (blue). Scale bar, 25 μm. (F) IB analysis of FOSL1 in MES 21 and MES 505 GSCs after transduction with two independent lentiviral shRNA constructs targeting FOSL1 (FOSL1 shRNA1 and shRNA2; one targeting the open reading frame and one targeting the 3′ UTR). α-Tubulin was used as internal control. (G) Representative images of primary or secondary neurosphere formation of MES 21 GSCs with indicated modifications. Scale bar, 25 μm. (H) Limiting dilution neurosphere-forming assay in MES 21 and MES 505 GSCs transduced with shCtrl or shFOSL1 (targeting the 3′ UTR), reconstituted with vector control or wild-type (WT) FOSL1. Stem cell frequencies were estimated as the ratio 1/x with the upper and lower 95% confidence intervals, where 1 = stem cell and x = all cells. (I) IB analysis of FOSL1, CD44, C/EBPβ, TAZ, p-STAT3 (Tyr705), and STAT3 in MES 21 and 505 GSCs transduced with shCtrl or shFOSL1 (targeting the 3′ UTR), with or without re-expression of an shRNA-resistant FOSL1. (J) Representative bioluminescent (BLI) images of intracranial GBM xenografts derived from luciferase-expressing MES 21 and MES 505 GSCs with indicated modifications. Colored scale bars represent photons/s/cm2/steradian. (K) Representative H&E-stained brain sections from mice intracranially implanted with MES 21 and MES 505 GSCs with indicated modifications. Red arrows indicate tumors. Scale bar, 1 mm. (L) Kaplan-Meier survival curves of mice intracranially injected with MES 21 and MES 505 GSCs with indicated modifications (n = 8). Data are presented as means ± SD of three independent experiments. ∗∗∗p < 0.001, two-tailed Student’s t test.
Figure 2
Figure 2
FOSL1 promotes transformation of PN GSCs into an MES state (A) Representative FACS plots of CD44+ subpopulation in PN 35 and PN 182 GSCs transduced with vector control or FOSL1. Median fluorescence intensity of CD44 is shown on the right. (B) IB analysis of FOSL1, CD44, C/EBPβ, TAZ, p-STAT3 (Tyr705), and STAT3 in PN 35 and PN 182 GSCs ectopically expressing FOSL1 or vector control. α-Tubulin was used as internal control. (C) Limiting dilution neurosphere-forming assay in PN 35 and PN 182 GSCs transduced with FOSL1 or vector control. (D) Representative BLI images of mice bearing xenografts derived from luciferase-expressing PN 35 and PN 182 GSCs transduced with FOSL1 or vector control. Colored scale bars represent photons/s/cm2/steradian. (E) Representative H&E-stained brain sections and IHC-staining images of FOSL1, CD44, and YKL40 in mice bearing xenografts derived from PN 35 and PN 182 GSCs with indicated modifications. Red arrows indicate tumors. Scale bars, 1 mm (H&E staining) and 25 μm (IHC staining). (F) Kaplan-Meier survival curves of mice intracranially implanted with PN 35 and PN 182 GSCs with indicated modifications (n = 8).
Figure 3
Figure 3
FOSL1 facilitates IR-induced PMT and radioresistance of PN GSCs (A) IB analysis of FOSL1, CD44, C/EBPβ, TAZ, p-STAT3, and STAT3 in PN 35 and PN 182 GSCs at the indicated time points following treatment with 5 Gy IR. α-Tubulin was used as internal control. (B) IB analysis of indicated antibodies in PN 35 and PN 182 GSCs transduced with Dox-inducible lentiviral vectors expressing FOSL1 shRNA or Ctrl shRNA in the presence or absence of 5 Gy IR. (C) Cell-cycle analysis of PN 35 and PN 182 GSCs transduced with Dox-inducible FOSL1 shRNA or Ctrl shRNA. Left: cell-cycle plots. The percentage of cells in G2/M phase is indicated within each plot. Right: quantification of percentage of cells in G2/M phase in FOSL1 shRNA or Ctrl shRNA-transduced PN 35 and PN 182 GSCs. (D) Quantitation of cells containing >10 γ-H2AX foci at the indicated time points after IR (5 Gy) treatment. Percentage of cells containing >10 γ-H2AX foci in ten random microscopic fields was calculated. (E) The average of mean number of γ-H2AX foci per nucleus in FOSL1- and LacZ-transduced PN 35 and PN 182 GSCs at the indicated time points after IR treatment. (F) Representative H&E-stained brain sections and IHC-staining images of FOSL1 and CD44 in mice bearing xenografts derived from PN 35 and PN 182 GSCs with indicated modifications. Red arrows indicate tumors. Scale bars, 1 mm (H&E staining) and 25 μm (IHC staining). Data are presented as means ± SD of three independent experiments. ∗∗p < 0.01, two-tailed Student’s t test.
Figure 4
Figure 4
FOSL1 induces activation of NF-κB signaling (A) Cluster heatmap showing 832 FOSL1 positively correlated and 628 FOSL1 negatively correlated genes in TCGA database. (B) Gene set enrichment analysis (GSEA) showing signaling pathways related to FOSL1 in human primary GBM. The color gradation and location of the dot respectively indicate the GSEA score and p value. (C) Correlation between the enrichment of FOSL1 and NF-κB pathway gene expression in GBM by GSEA analysis. (D) Heatmap depicting genes differentially expressed between FOSL1 and NF-κB pathways/targets in normal brain tissues (n = 5) and GBM (n = 168). Genes are labeled and clustered using hierarchical clustering. (E and F) EMSA analysis of NF-κB DNA-binding activity in PN 35 and PN 182 (E), and MES 21 and MES 505 (F) GSCs with indicated modifications. (G) IB analysis of IκBα, p-IKKα/β (Ser180/181), IKKα, IKKβ, and FOSL1 in PN 35, PN 182, MES 21, and MES 505 GSCs with indicated modifications. α-Tubulin was used as internal control. (H) IB analysis of FOSL1, CD44, C/EBPβ, TAZ, p-STAT3 (Tyr705), STAT3, p-p65 (Ser536), and p65 in PN 35 and PN 182 GSCs transduced with vector control or FOSL1 in the presence or absence of BAY 11-7082. α-Tubulin was used as internal control. (I) Limiting dilution neurosphere-forming assay in PN 35 and PN 182 GSCs expressing FOSL1 or vector control, treated with dimethyl sulfoxide (DMSO) or BAY 11-7082. (J) Representative BLI images of mice bearing xenografts derived from luciferase-expressing PN 35 and PN 182 GSCs transduced with FOSL1 or vector control, with or without BAY 11-7082 treatment. (K) Representative H&E-stained brain sections and IHC-staining images of FOSL1, p-p65, and CD44 in indicated PN GSC-derived xenografts treated with DMSO or BAY 11-7082. Red arrows indicate tumors. Scale bars, 1 mm (H&E staining) and 25 μm (IHC staining).
Figure 5
Figure 5
FOSL1 promotes CYLD SUMOylation to impair deubiquitination of NF-κB signaling intermediaries (A–D) K63-linked polyubiquitin chains of TRAF2 (A), TRAF6 (B), RIP1 (C), and NEMO (D) were analyzed in PN 35 and PN 182 GSCs with indicated modifications. (E) IB analysis of CYLD protein expression in PN 35 and PN 182 GSCs expressing exogenous FOSL1 or vector control, with or without FOSL1 depletion. Arrow indicates additional slow-migrating band in FOSL1-transduced PN GSCs. α-Tubulin was used as internal control. (F) PN 35 and PN 182 GSCs were co-transfected with HA-CYLD and one of the Myc-tagged SUMO isoforms (SUMO1–4). Immunoprecipitated HA-CYLD was either incubated with anti-HA antibody (middle panel) or was probed for SUMOylation using anti-Myc antibody (top panel). The expression level of SUMO1–4 in the cell lysates is also shown (bottom panel). (G) PN 35 and PN 182 GSCs were transduced with FLAG-tagged FOSL1 or vector control. CYLD was immunoprecipitated and then incubated with anti-SUMO1 antibody or anti-CYLD antibody, respectively. (H) MES 21 and MES 505 GSCs were transduced with shCtrl or shFOSL1 (targeting the 3′ UTR), reconstituted with WT FOSL1 or vector control. CYLD was immunoprecipitated and then incubated with anti-SUMO1 antibody or anti-CYLD antibody, respectively. (I) HEK293T cells were transduced with FLAG-tagged WT CYLD or K40R CYLD (an unSUMOylatable mutant), together with HA-tagged FOSL1, Myc-tagged SUMO1, and HA-tagged UBC9. FLAG-tagged CYLD was immunoprecipitated and then incubated with anti-Myc antibody or anti-FLAG antibody, respectively. (J) PN 35 and PN 182 GSCs were transduced with FLAG-tagged FOSL1 or vector control, with or without UBC9 knockdown. CYLD was immunoprecipitated and then incubated with anti-SUMO1 antibody or anti-CYLD antibody, respectively.
Figure 6
Figure 6
FOSL1 facilitates CYLD SUMOylation, NF-κB activation, and PMT via transcriptionally activating UBC9 (A and B) The five AP1-binding sites of the UBC9 promoter were mutated to generate the mutant UBC9 promoter (A). The relative luciferase activity of WT or mutant UBC9 promoters was determined in PN 35 and PN 182 GSCs transfected with vector control or FOSL1 (B). (C and D) Chromatin immunoprecipitation assays on AP1-binding site 1 of UBC9 promoter were performed in FLAG-FOSL1-transduced PN 35 and PN 182 GSCs treated with DMSO, 5 Gy IR (C), or 10 ng/mL TNF-α (D). (E–H) K63-linked polyubiquitin chains of TRAF2 (E), TRAF6 (F), RIP1 (G), and NEMO (H) were detected in PN 35 GSCs expressing exogenous FOSL1 or vector control, with or without UBC9 knockdown. (I) K48-linked polyubiquitin chains of IκBα were analyzed in PN 35 GSCs with indicated modifications. (J) IB analysis of UBC9, IκBα, p-IKKα/β (Ser180/181), IKKα, IKKβ, and FLAG-FOSL1 in PN 35 and PN 182 GSCs with indicated modifications. α-Tubulin was used as internal control. (K) EMSA analysis of NF-κB DNA-binding activity in PN 35 and PN 182 GSCs with indicated modifications. (L) Relative luciferase reporter activity of NF-κB in PN 35 and PN 182 GSCs with indicated modifications. (M) IB analysis of UBC9, CD44, p-p65 (Ser536), p65, and FLAG-FOSL1 in PN 35 and PN 182 GSCs with indicated modifications. α-Tubulin was used as internal control. (N) FACS analysis of CD44+ subpopulation in PN 35 and PN 182 GSCs with indicated modifications. Data are presented as means ± SD of three independent experiments. ∗∗p < 0.01, ∗∗∗p < 0.001, two-tailed Student’s t test.
Figure 7
Figure 7
Clinical relevance of FOSL1/NF-κB-driven PMT in human GBMs (A) Representative FOSL1, CD44, and p-p65 expression levels are shown in consecutive sections of two matched pairs of primary PN tumors and corresponding relapsed MES tumors. Scale bars, 50 μm. (B) Representative IHC-staining images of FOSL1 and p-p65 in tissue microarray containing 138 primary GBM samples (left). Correlations of IHC data for high or low FOSL1 expression relative to level of p-p65 are shown (right). Scale bar, 1 mm. (C) Kaplan-Meier curves showing overall survival (left) and progression-free survival (right) of GBM patients divided on the basis of FOSL1 expression in p-p65high tumors.

References

    1. Brennan C.W., Verhaak R.G., McKenna A., Campos B., Noushmehr H., Salama S.R., Zheng S., Chakravarty D., Sanborn J.Z., Berman S.H., et al. The somatic genomic landscape of glioblastoma. Cell. 2013;155:462–477. doi: 10.1016/j.cell.2013.09.034. - DOI - PMC - PubMed
    1. Frattini V., Trifonov V., Chan J.M., Castano A., Lia M., Abate F., Keir S.T., Ji A.X., Zoppoli P., Niola F., et al. The integrated landscape of driver genomic alterations in glioblastoma. Nat. Genet. 2013;45:1141–1149. doi: 10.1038/ng.2734. - DOI - PMC - PubMed
    1. Hu B., Wang Q., Wang Y.A., Hua S., Sauve C.G., Ong D., Lan Z.D., Chang Q., Ho Y.W., Monasterio M.M., et al. Epigenetic activation of WNT5A drives glioblastoma stem cell differentiation and invasive growth. Cell. 2016;167:1281–1295.e18. doi: 10.1016/j.cell.2016.10.039. - DOI - PMC - PubMed
    1. Wen P.Y., Kesari S. Malignant gliomas in adults. N. Engl. J. Med. 2008;359:492–507. doi: 10.1056/NEJMra0708126. - DOI - PubMed
    1. Verhaak R.G., Hoadley K.A., Purdom E., Wang V., Qi Y., Wilkerson M.D., Miller C.R., Ding L., Golub T., Mesirov J.P., et al. Integrated genomic analysis identifies clinically relevant subtypes of glioblastoma characterized by abnormalities in PDGFRA, IDH1, EGFR, and NF1. Cancer Cell. 2010;17:98–110. doi: 10.1016/j.ccr.2009.12.020. - DOI - PMC - PubMed

Publication types

MeSH terms