

Temporal sequence of blood lipids and insulin resistance in perimenopausal women: the study of women's health across the nation
- PMID: 35351687
- PMCID: PMC8966521
- DOI: 10.1136/bmjdrc-2021-002653
Temporal sequence of blood lipids and insulin resistance in perimenopausal women: the study of women's health across the nation
Abstract
Introduction: To explore the temporal relationship between blood lipids and insulin resistance in perimenopausal women.
Research design and methods: The longitudinal cohort consisted of 1386 women (mean age 46.4 years at baseline) in the Study of Women's Health Across the Nation. Exploratory factor analysis was used to identify appropriate latent factors of lipids (total cholesterol (TC); triglyceride (TG); high-density lipoprotein cholesterol (HDL-C); low-density lipoprotein cholesterol (LDL-C); lipoprotein A-I (LpA-I); apolipoprotein A-I (ApoA-I); apolipoprotein B (ApoB)). Cross-lagged path analysis was used to explore the temporal sequence of blood lipids and homeostasis model assessment of insulin resistance (HOMA-IR).
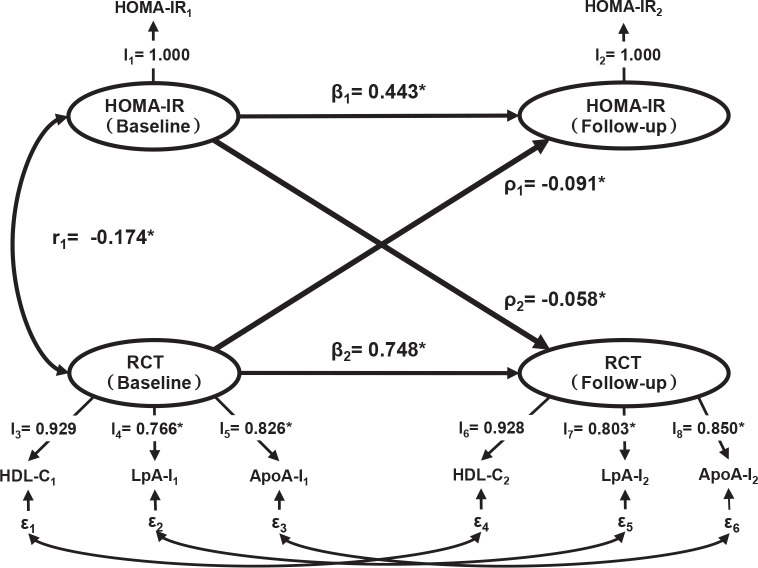
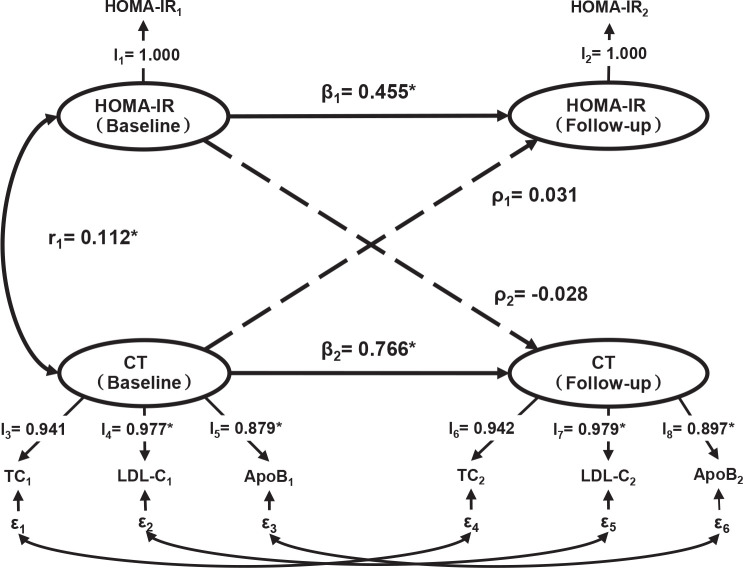
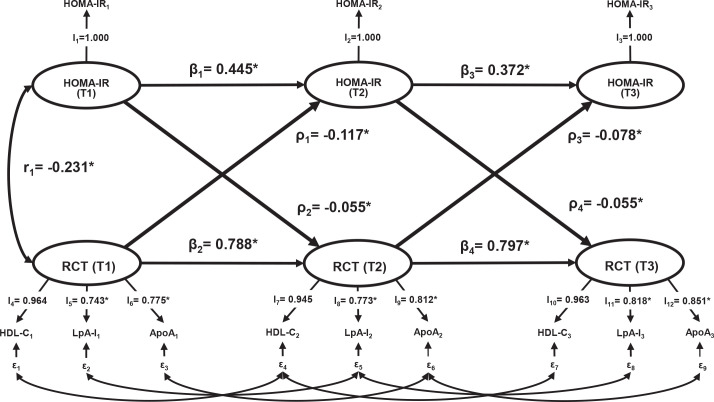
Results: Three latent lipid factors were defined as: the TG factor, the cholesterol transport factor (CT), including TC, LDL-C, and ApoB; the reverse cholesterol transport factor (RCT), including HDL-C, LpA-I, and ApoA-I. The cumulative variance contribution rate of the three factors was 86.3%. The synchronous correlations between baseline TG, RCT, CT, and baseline HOMA-IR were 0.284, -0.174, and 0.112 (p<0.05 for all). After adjusting for age, race, smoking, drinking, body mass index, and follow-up years, the path coefficients of TG→HOMA-IR (0.073, p=0.004), and HOMA-IR→TG (0.057, p=0.006) suggested a bidirectional relationship between TG and HOMA-IR. The path coefficients of RCT→HOMA-IR (-0.091, P < 0.001) and HOMA-IR→RCT (-0.058, p=0.002) were also significant, but the path coefficients of CT→HOMA-IR (0.031, p=0.206) and HOMA-IR→CT (-0.028, p=0.113) were not. The sensitivity analyses showed consistent results.
Conclusions: These findings provide evidence that TG and the reverse cholesterol transport-related lipids are related with insulin resistance bidirectionally, while there is no temporal relationship between the cholesterol transport factor and insulin resistance.
Keywords: epidemiology; insulin resistance; lipids.
© Author(s) (or their employer(s)) 2022. Re-use permitted under CC BY-NC. No commercial re-use. See rights and permissions. Published by BMJ.
Conflict of interest statement
Competing interests: None declared.
Figures
Similar articles
-
Association of the apolipoprotein B/apolipoprotein A-I ratio and low-density lipoprotein cholesterol with insulin resistance in a Chinese population with abdominal obesity.Acta Diabetol. 2012 Dec;49(6):465-72. doi: 10.1007/s00592-012-0419-9. Epub 2012 Sep 11. Acta Diabetol. 2012. PMID: 22965469
-
Changes in triglycerides and high-density lipoprotein cholesterol may precede peripheral insulin resistance, with 2-h insulin partially mediating this unidirectional relationship: a prospective cohort study.Cardiovasc Diabetol. 2016 Nov 4;15(1):154. doi: 10.1186/s12933-016-0469-3. Cardiovasc Diabetol. 2016. PMID: 27814764 Free PMC article.
-
[Postprandial changes of blood lipid after ordinary Chinese diet and the influencing factors thereof].Zhonghua Yi Xue Za Zhi. 2009 Feb 3;89(4):260-2. Zhonghua Yi Xue Za Zhi. 2009. PMID: 19552844 Chinese.
-
The triglyceride to high-density lipoprotein cholesterol (TG/HDL-C) ratio as a predictor of insulin resistance but not of β cell function in a Chinese population with different glucose tolerance status.Lipids Health Dis. 2016 Jun 7;15:104. doi: 10.1186/s12944-016-0270-z. Lipids Health Dis. 2016. PMID: 27267043 Free PMC article.
-
Elevated Levels of Apolipoprotein CIII Increase the Risk of Postprandial Hypertriglyceridemia.Front Endocrinol (Lausanne). 2021 Apr 23;12:646185. doi: 10.3389/fendo.2021.646185. eCollection 2021. Front Endocrinol (Lausanne). 2021. PMID: 33967959 Free PMC article.
Cited by
-
International society of sports nutrition position stand: nutritional concerns of the female athlete.J Int Soc Sports Nutr. 2023 Dec;20(1):2204066. doi: 10.1080/15502783.2023.2204066. J Int Soc Sports Nutr. 2023. PMID: 37221858 Free PMC article. Review.
-
Different temporal relationship between sex hormones and sleep status in midlife women: a longitudinal cohort study.Sex Med. 2025 Mar 2;13(1):qfaf009. doi: 10.1093/sexmed/qfaf009. eCollection 2025 Feb. Sex Med. 2025. PMID: 40041303 Free PMC article.
-
Nonlinear relationship between triglyceride-glucose index and the risk of prediabetes and diabetes: a secondary retrospective cohort study.Front Endocrinol (Lausanne). 2024 Sep 23;15:1416634. doi: 10.3389/fendo.2024.1416634. eCollection 2024. Front Endocrinol (Lausanne). 2024. PMID: 39381440 Free PMC article.
References
-
- GBD 2017 Risk Factor Collaborators . Global, regional, and national comparative risk assessment of 84 behavioural, environmental and occupational, and metabolic risks or clusters of risks for 195 countries and territories, 1990-2017: a systematic analysis for the global burden of disease study 2017. Lancet 2018;392:1923–94. 10.1016/S0140-6736(18)32225-6 - DOI - PMC - PubMed
Publication types
MeSH terms
Substances
LinkOut - more resources
Full Text Sources
Miscellaneous