. 2022 Mar 28;8(1):29.
doi: 10.1038/s41421-021-00367-x.

Global transcriptomic characterization of T cells in individuals with chronic HIV-1 infection

Affiliations

Global transcriptomic characterization of T cells in individuals with chronic HIV-1 infection

Xiang-Ming Wang et al. Cell Discov. .

Abstract

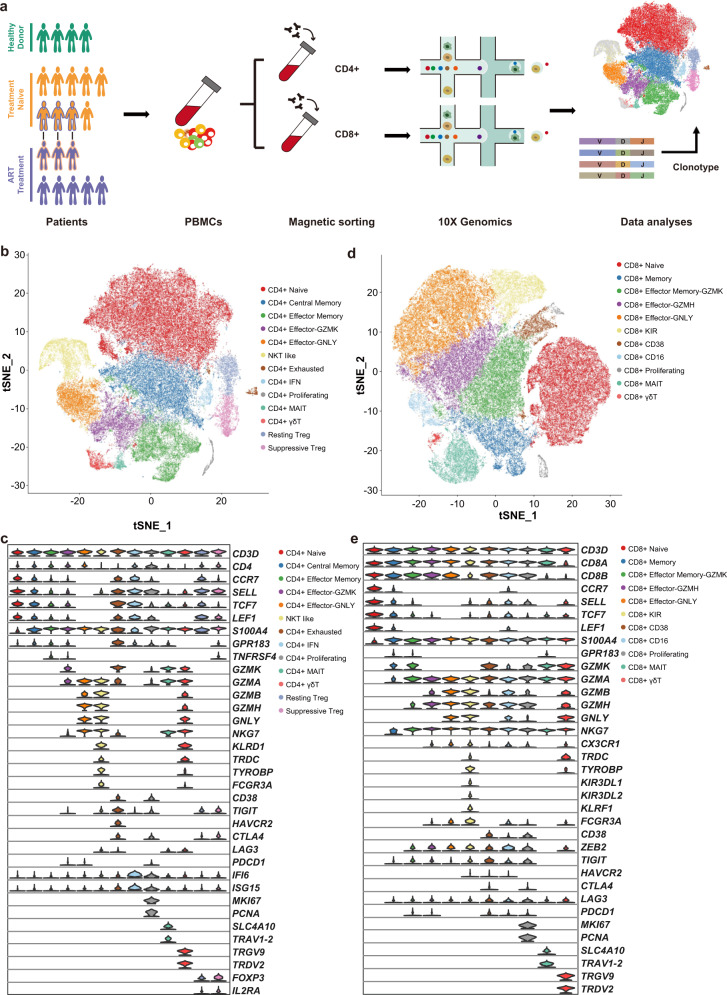
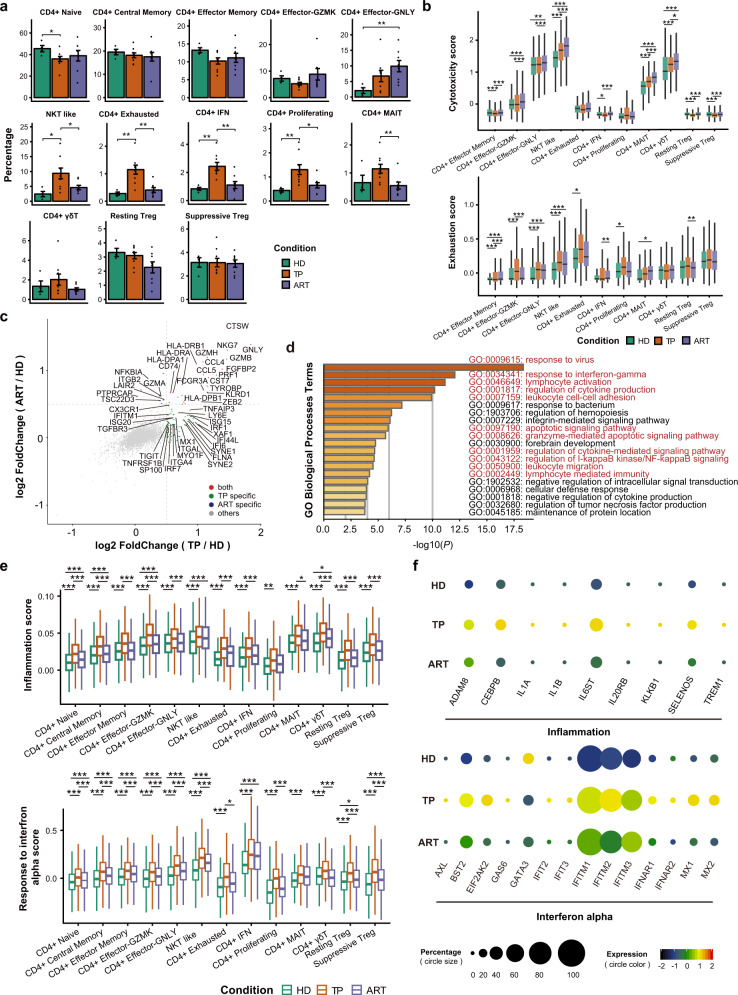
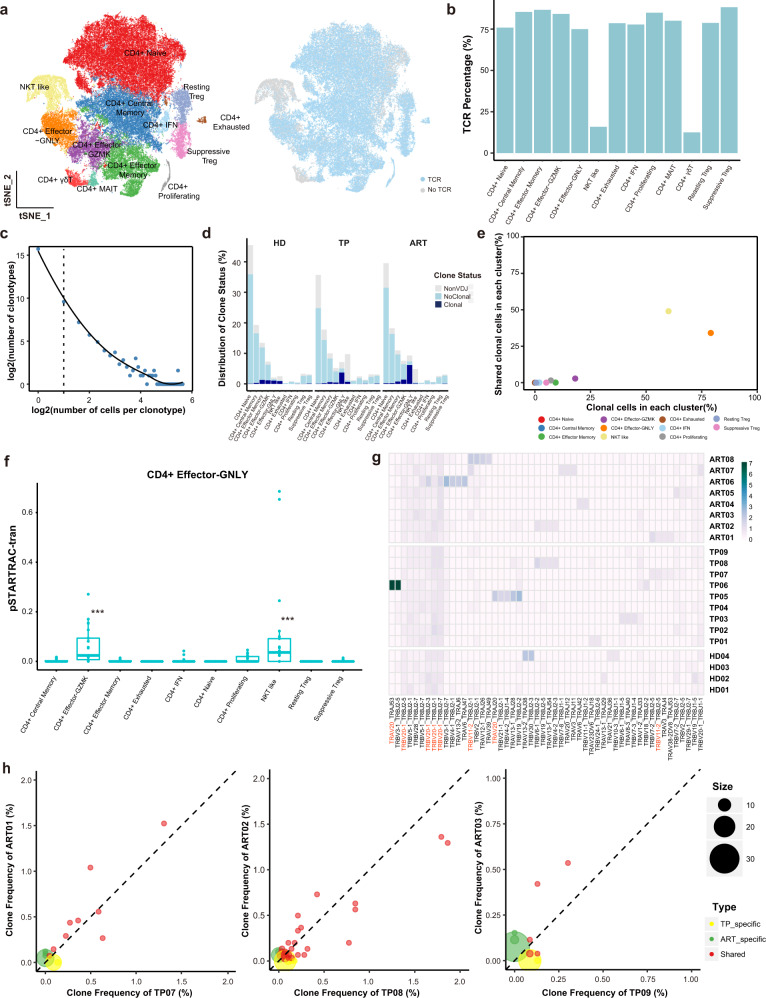
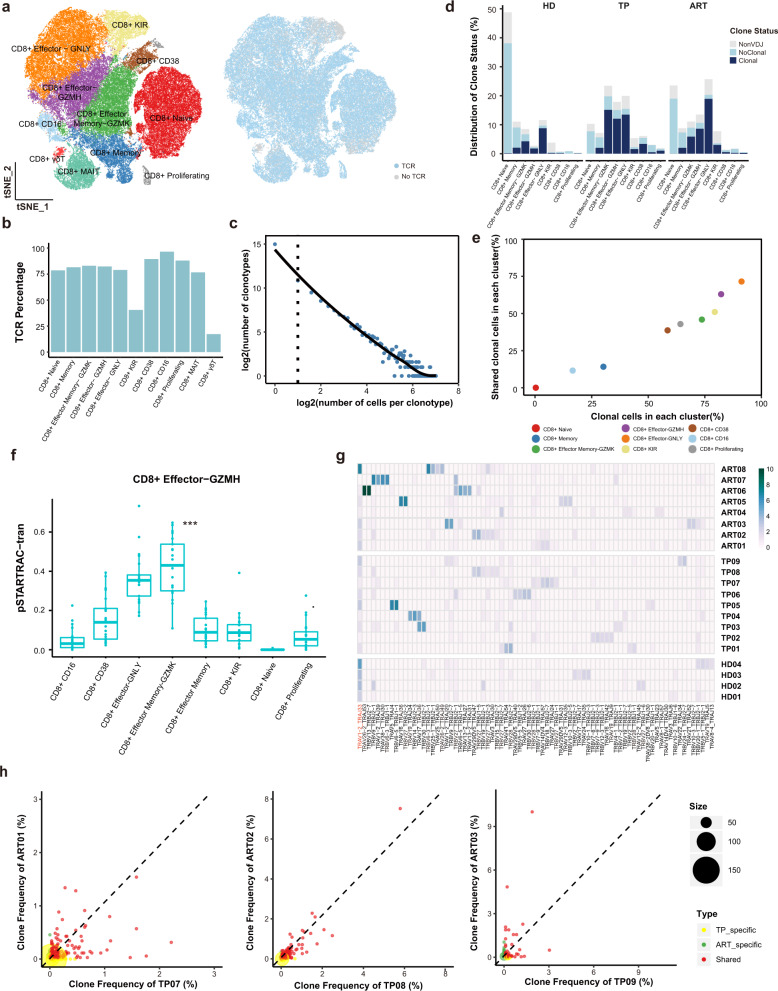
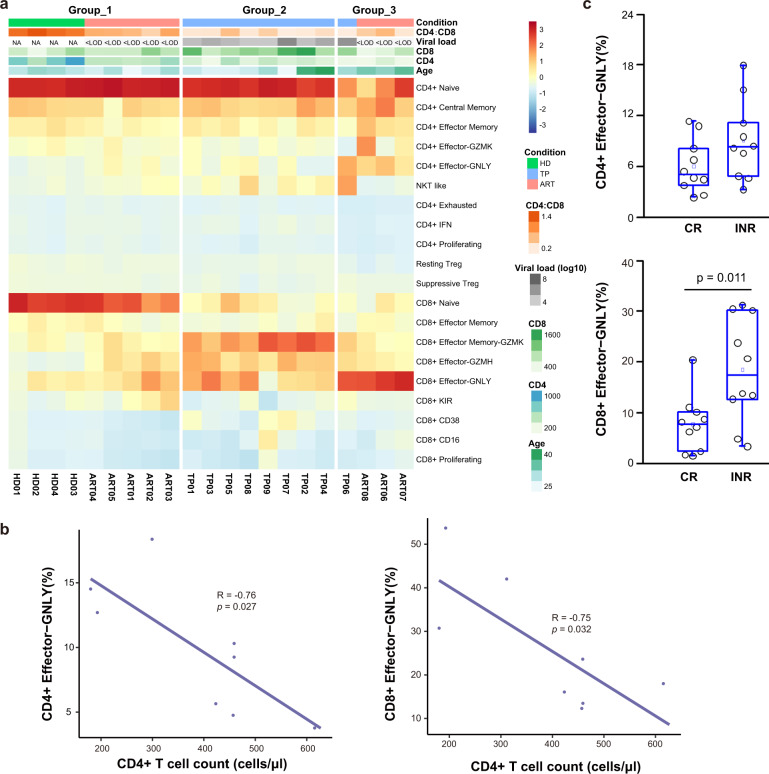
To obtain a comprehensive scenario of T cell profiles and synergistic immune responses, we performed single-cell RNA sequencing (scRNA-seq) on the peripheral T cells of 14 individuals with chronic human immunodeficiency virus 1 (HIV-1) infection, including nine treatment-naive (TP) and eight antiretroviral therapy (ART) participants (of whom three were paired with TP cases), and compared the results with four healthy donors (HD). Through analyzing the transcriptional profiles of CD4+ and CD8+ T cells, coupled with assembled T cell receptor sequences, we observed the significant loss of naive T cells, prolonged inflammation, and increased response to interferon-α in TP individuals, which could be partially restored by ART. Interestingly, we revealed that CD4+ and CD8+ Effector-GNLY clusters were expanded in TP cases, and persistently increased in ART individuals where they were typically correlated with poor immune restoration. This transcriptional dataset enables a deeper understanding of the pathogenesis of HIV-1 infection and is also a rich resource for developing novel immune targeted therapeutic strategies.


Conflict of interest statement

The authors declare no competing interests.

Figures

Fig. 1
Fig. 1. Study design and single-cell transcriptional profiling of CD4+ and CD8+ T cells from HDs and chronic HIV-1-infected individuals.
a Schematic showing the overall study design. scRNA-seq was applied to CD4+ and CD8+ T cells across the three conditions, and the output data were used for TCR profiling and expression analyses. b Cellular populations identified for CD4+ T cells. The t-SNE projection of 79,405 single cells from HD (n = 4), TP (n = 9), and ART (n = 8) samples, showing the formation of 13 clusters with the respective labels. Each dot corresponds to a single cell, colored according to cell types. c Violin plots showing the expression distribution of selected canonical cell markers in the 13 clusters of CD4+ T cells. Row representing selected marker genes and column representing clusters with the same color in b. d Cellular populations identified for CD8+ T cells. The t-SNE projection of 89,155 single cells from HD (n = 4), TP (n = 9), and ART (n = 8) samples, showing the formation of 11 clusters with the respective labels. Each dot corresponds to a single cell, colored according to cell types. e Violin plots showing the expression distribution of selected canonical cell markers in the 11 clusters of CD8+ T cells. Row representing selected marker genes and column representing clusters with the same color in d.
Fig. 2
Fig. 2. Immunological features of CD4+ T subsets across the three conditions.
a Condition preference of each cluster. Y-axis: average percent of samples across the three conditions. Conditions are shown in different colors. Each bar plot represents one cell cluster. Error bars represent ±S.E.M. for 4 healthy donors and 14 chronic HIV-1-infected individuals. *P < 0.05; **P < 0.01; two-sided unpaired Mann–Whitney U-test. b Box plots of the cytotoxicity and exhaustion scores across different clusters and conditions. Conditions are shown in different colors. Horizontal lines represent median values, with whiskers extending to the farthest data point within a maximum of 1.5× interquartile range. *P < 0.01; **P < 0.001; ***P < 0.0001; two-sided unpaired Dunn’s (Bonferroni) test. c DEGs of CD4+ T cells from the TPs or ARTs in comparison with those from the HDs. Each red dot denotes an individual gene with Benjamini–Hochberg adjusted P value (two-sided unpaired Mann–Whitney U-test) ≤0.01 and average log2(fold change) ≥0.5 for the TP/HD and ART/HD comparisons. Example genes are labeled with the gene name. d Gene enrichment analyses of the DEGs in TPs compared with healthy donors. GO terms are labeled with name and id and sorted by −log10 (P) value. A darker color indicates a smaller P value. The top 20 enriched GO terms are shown. Interesting terms are labeled in red color. e Similar to b but for inflammation and IFN-α response score. f Dot plot showing expression of some genes associated with inflammation and IFN-α response processes across the three conditions. The size of the circle indicates the percentage of cells expressing pathway-associated genes under each condition. The color of the circle represents the expression levels of pathway-associated genes under each condition, and the color red means a relatively high expression level, and black means a relatively low expression level.
Fig. 3
Fig. 3. Clonal expansion of CD4+ T cells and clonal maintenance of CD4+ Effector-GNLY cells following ART.
a t-SNE of CD4+ T cells. Clusters are denoted by color labeled with inferred cell types (left) and TCR detection (right). Cells are colored the same in (Fig. 1b). b Bar plots showing the percent of TCR detection in each CD4+ T cell cluster. c The association between the number of CD4+ T cell clones and the number of cells per clonotype. The dashed line separates non-clonal and clonal cells, with the latter identified by repeated usage of TCRs. LOESS fitting is labeled as the solid line showing a negative correlation between the two axes. d The distribution of the clone state of CD4+ T cells in each cluster across the three conditions. e Comparison between the fraction of clonal cells in each subset (X-axis) and percentage of cells with TCRs shared across clusters (Y-axis). f Developmental transition of CD4+ Effector-GNLY cells with other CD4+ cells quantified by pairwise STARTRAC-tran indices for each patient (n = 14). ***P < 0.001, Permutation test. g Top 5 paired V-J usage of TRA/B genes across four healthy donors and 14 chronic HIV-1-infected individuals. h Scatterplots comparing TCR clone frequencies between pre- and post-ART treatment for three participants. The size of the dot corresponds to the number of distinct clonotypes. The clonotypes that are shared between pre- and post-ART are displayed in blue, and those only in TP or ART are in green or orange, respectively.
Fig. 4
Fig. 4. Characterizations of CD8+ T cell subsets across the three conditions.
a Condition preference of each cluster. Y-axis: average percent of samples across the three conditions. Conditions are shown in different colors. Each bar plot represents one cell cluster. Error bars represent ±S.E.M. for four healthy donors and 14 chronic HIV-1-infected individuals. *P < 0.05; **P < 0.01; ***P < 0.001; two-sided unpaired Mann–Whitney U-test. b Box plots of the cytotoxicity and exhaustion scores across different clusters and conditions. Conditions are shown in different colors. Horizontal lines represent median values, with whiskers extending to the farthest data point within a maximum of 1.5× interquartile range. *P < 0.01; **P < 0.001; ***P < 0.0001; two-sided unpaired Dunn’s (Bonferroni) test. c DEGs of CD8+ T cells from the TPs or ARTs in comparison with those from the HDs. Each red dot denotes an individual gene with Benjamini–Hochberg adjusted P value (two-sided unpaired Mann–Whitney U-test) ≤0.01 and average log2(fold change) ≥0.5 for the TP/HD and ART/HD comparisons. Example genes are labeled with the gene name. d Gene enrichment analyses of the DEGs in TPs compared with healthy donors. GO terms are labeled with name and id and sorted by −log10 (P) value. A darker color indicates a smaller P value. The top 20 enriched GO terms are shown. Interesting terms are labeled in red color. e Similar to b but for inflammation and IFN-α response score. f Dot plot showing expression of some genes associated with inflammation and IFN-α response processes across the three conditions. The size of the circle indicates the percentage of cells expressing pathway-associated genes under each condition. The color of the circle represents the expression levels of pathway-associated genes under each condition, and the color red means a relatively high expression level, and black means a relatively low expression level.
Fig. 5
Fig. 5. Clonal expansion of CD8+ T cells and clonal maintenance of CD8+ Effector-GNLY cells following ART.
a t-SNE of CD8+ T cells. Clusters are denoted by color labeled with inferred cell types (left) and TCR detection (right). Cells are colored the same as in Fig. 1d. b Bar plots showing the percent of TCR detection in each CD8+ T cell cluster. c The association between the number of CD8+ T cell clones and the number of cells per clonotype. The dashed line separates non-clonal and clonal cells, with the latter identified by repeated usage of TCRs. LOESS fitting is labeled as the solid line showing a negative correlation between the two axes. d The distribution of the clone state of CD8+ T cells in each cluster across the three conditions. e Comparison between the fraction of clonal cells in each subset (X-axis) and percentage of cells with TCRs shared across clusters (Y-axis). f Developmental transition of CD8+ Effector-GZMH cells with other CD8+ cells quantified by pairwise STARTRAC-tran indices for each patient (n = 14). ***P < 0.001, Permutation test. g Top 5 paired V-J usage of TRA/B genes across four healthy donors and 14 chronic HIV-1-infected individuals. h Scatterplots comparing TCR clone frequencies between pre- and post-ART treatment for three participants. The size of the dot corresponds to the number of distinct clonotypes. The clonotypes that are shared between pre- and post-ART are displayed in blue, and those only in TP or ART are in green or orange, respectively.
Fig. 6
Fig. 6. Clinical implications of GNLY+ effector T cells in chronic HIV-1-infected individuals.
a Hierarchical clustering of compositions of CD4+ and CD8+ T cells in each patient. Top heat map showing clinical information (condition, viral load, CD4/CD8, CD8 count, CD4 count, CD3 count, and age) of 4 healthy donors and 14 chronic HIV-1-infected individuals. b Relationship between the proportions of CD4+ Effector-GNLY and CD8+ Effector-GNLY and the numbers of CD4+ T cells in PBMCs of ARTs. c Box plots showing frequencies of CD4+ Effector-GNLY (top) and CD8+ Effector-GNLY (bottom) in clinical CRs (n = 10) and INRs (n = 10). All differences with P < 0.05 are indicated; two-sided unpaired Mann–Whitney U-test.

References

    1. Maartens G, Celum C, Lewin SR. HIV infection: epidemiology, pathogenesis, treatment, and prevention. Lancet. 2014;384:258–271. - PubMed
    1. Fenwick C, et al. T-cell exhaustion in HIV infection. Immunol. Rev. 2019;292:149–163. - PMC - PubMed
    1. Doitsh G, Greene WC. Dissecting how CD4 T cells are lost during HIV infection. Cell Host Microbe. 2016;19:280–291. - PMC - PubMed
    1. Roederer M, et al. CD8 naive T cell counts decrease progressively in HIV-infected adults. J. Clin. Investig. 1995;95:2061–2066. - PMC - PubMed
    1. Serrano-Villar S, et al. HIV-infected individuals with low CD4/CD8 ratio despite effective antiretroviral therapy exhibit altered T cell subsets, heightened CD8+ T cell activation, and increased risk of non-AIDS morbidity and mortality. PLoS Pathog. 2014;10:e1004078. - PMC - PubMed