. 2022 Mar 28;13(3):276.
doi: 10.1038/s41419-022-04724-w.

Fibroblast growth factor 20 attenuates pathological cardiac hypertrophy by activating the SIRT1 signaling pathway

Affiliations

Fibroblast growth factor 20 attenuates pathological cardiac hypertrophy by activating the SIRT1 signaling pathway

Yunjie Chen et al. Cell Death Dis. .

Abstract

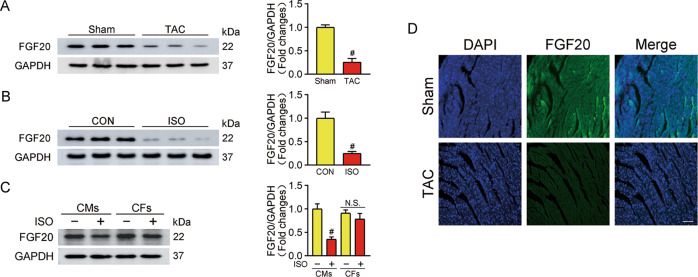
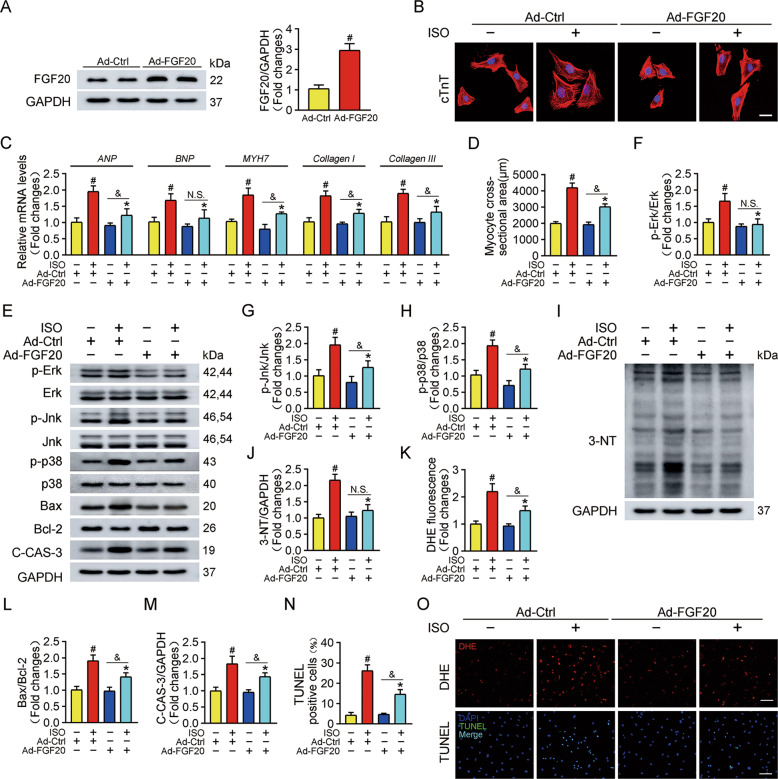
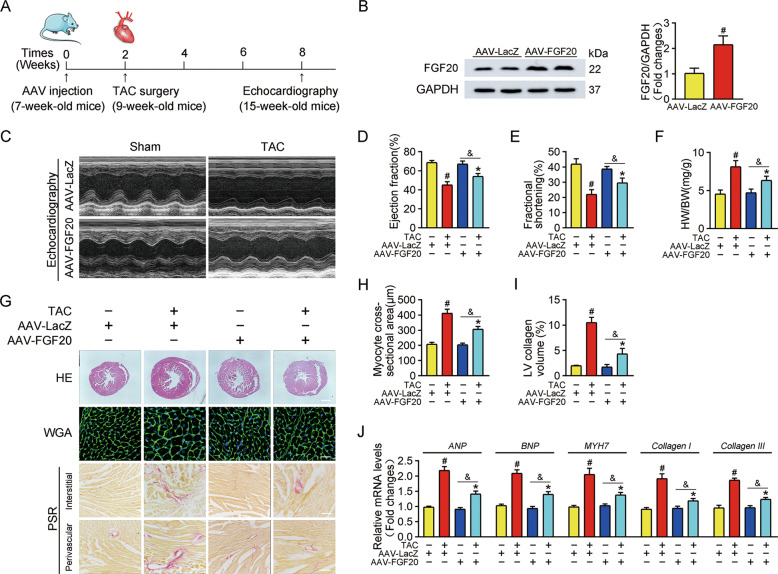
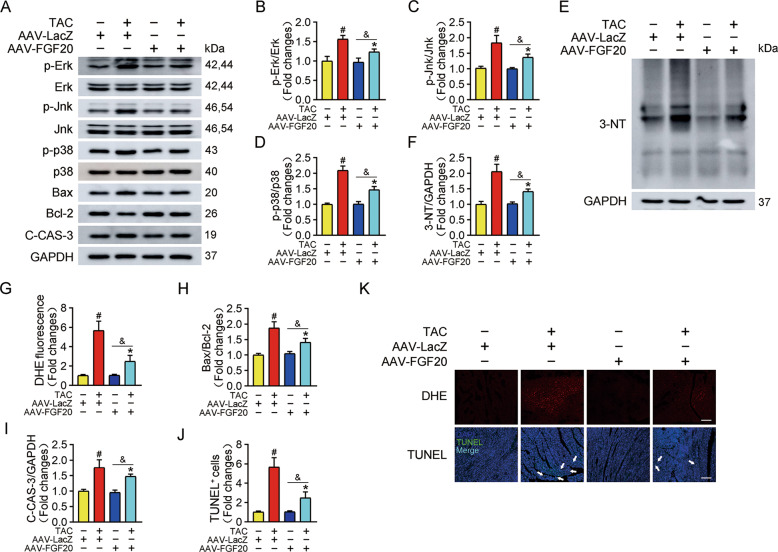
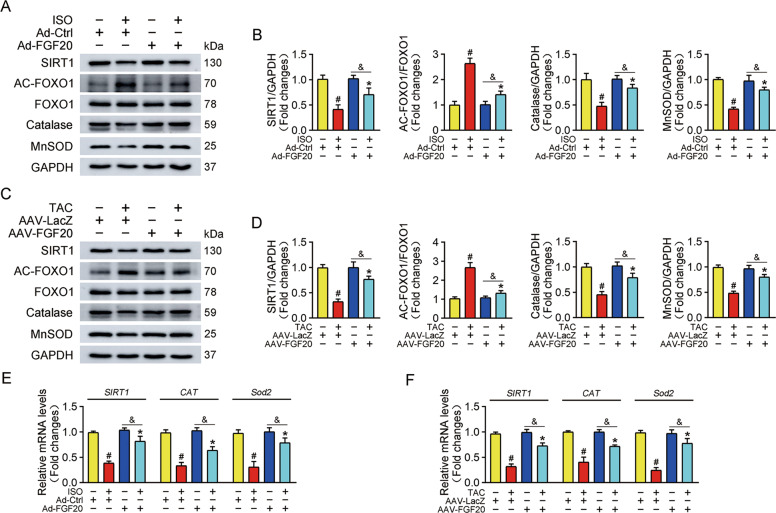
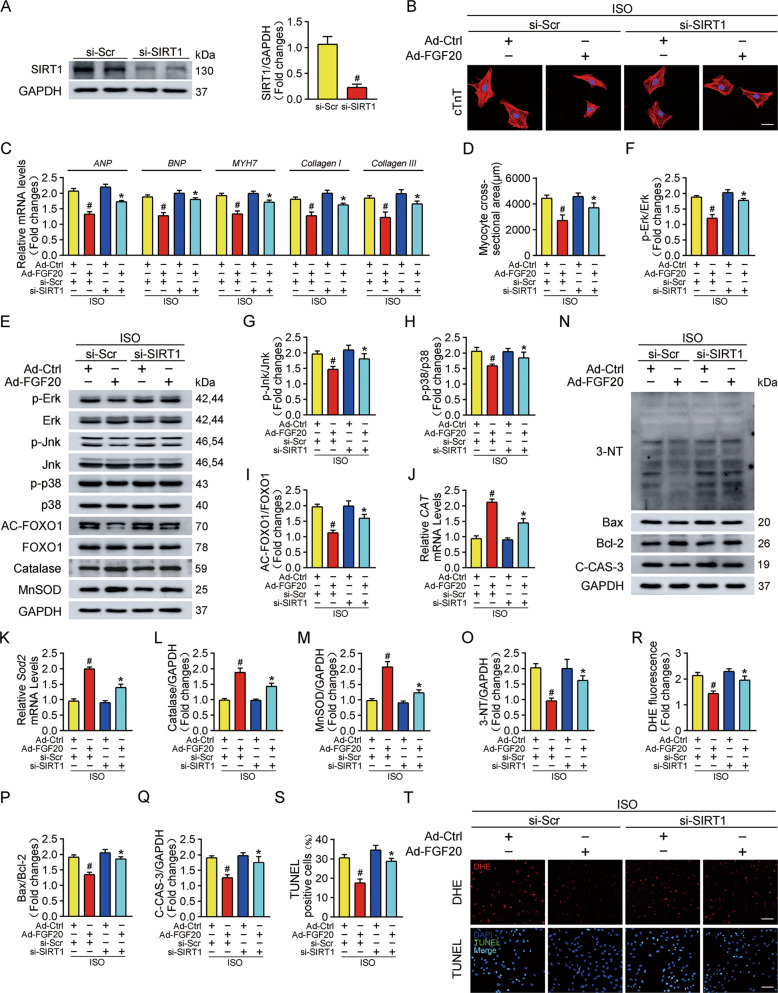
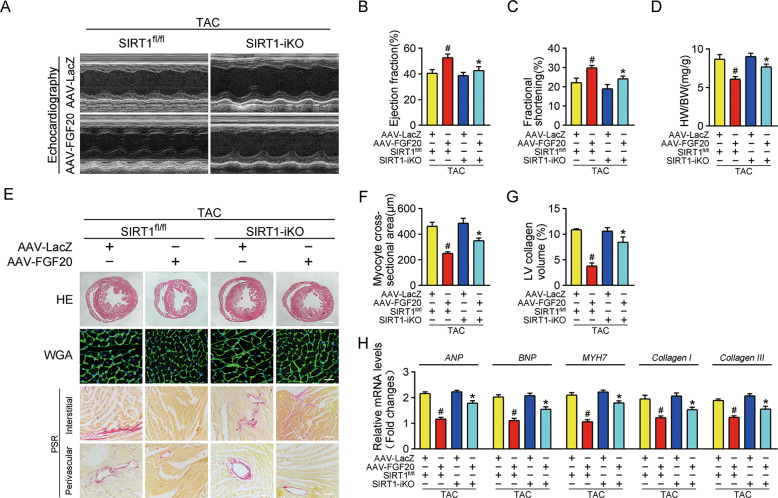
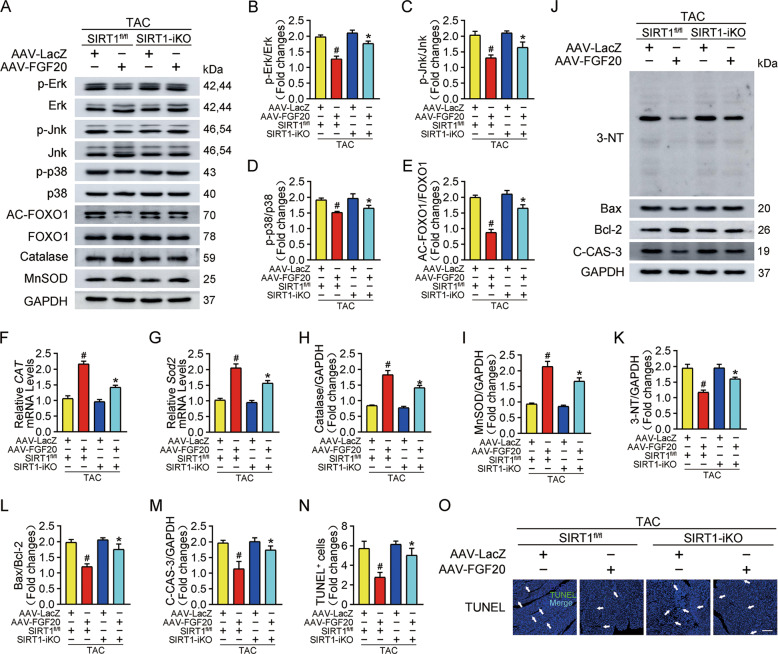
Cardiac hypertrophy occurs initially in response to an increased cardiac load as a compensatory mechanism to maintain cardiac output. However, sustained pathological hypertrophy can develop into heart failure and cause sudden death. Fibroblast growth factor 20 (FGF20) is a member of the fibroblast growth factor family, which involved in apoptosis, aging, inflammation, and autophagy. The precise function of FGF20 in pathological cardiac hypertrophy is unclear. In this study, we demonstrated that FGF20 was significantly decreased in response to hypertrophic stimulation. In contrast, overexpression of FGF20 protected against pressure overload-induced cardiac hypertrophy. Mechanistically, we found that FGF20 upregulates SIRT1 expression, causing deacetylation of FOXO1; this effect promotes the transcription of downstream antioxidant genes, thus inhibits oxidative stress. In content, the anti-hypertrophic effect of FGF20 was largely counteracted in SIRT1-knockout mice, accompanied by an increase in oxidative stress. In summary, our findings reveal a previously unknown protective effect of FGF20 on pathological cardiac hypertrophy by reducing oxidative stress through activation of the SIRT1 signaling pathway. FGF20 is a potential novel molecular target for preventing and treating pressure overload-induced myocardial injury.


Conflict of interest statement

The authors declare no competing interests.

Figures

Fig. 1
Fig. 1. FGF20 expression is decreased in cardiac hypertrophy.
A Western blot was performed and quantitatively analyzed to determine the protein levels of FGF20 in the hearts from TAC-induced cardiac hypertrophic mice and sham-operated controls. n = 5 per group. #P < 0.05 versus Sham group. B Western blot was performed and quantitatively analyzed to determine the protein levels of FGF20 in NRCMs with or without ISO treatment (10 μM) for 48 h. n = 5 per group. #P < 0.05 versus CON group. C Western blot was performed and quantitatively analyzed to determine the protein levels of FGF20 in NRCMs and NRCFs with or without ISO treatment. n = 5 per group. #P < 0.05 versus CON group. D Representative immunofluorescence and quantitative analysis of FGF20 proteins in the heart tissues from sham or TAC mice (Scale bar = 50 μm). n = 5. #P < 0.05 versus Sham group. Data represent means ± SEM. Two-tailed Student’s t test.
Fig. 2
Fig. 2. FGF20 overexpression protects against ISO-induced cardiomyocyte hypertrophy in vitro.
A Western blot was performed and quantitatively analyzed to determine the protein levels of FGF20 in NRCMs transfected with adenoviruses expressing FGF20 (Ad-FGF20) and or empty control vector (Ad-Ctrl). B Representative immunofluorescence (red for cTnT, blue for DAPI) and quantitative analysis of myocyte surface area in NRCMs transfected with Ad-Ctrl or Ad-FGF20 in the presence or absence of ISO. Scale bar = 40 μm. C RT-qPCR analysis of the mRNA levels of hypertrophic marker genes (ANP, BNP, and MYH7) and fibrosis marker genes (Collagen I and Collagen III) in NRCMs transfected with Ad-Ctrl or Ad-FGF20 in the presence or absence of ISO. D Quantification of myocyte surface area in B. E Western blot was performed to determine the protein levels of p-Erk, Erk, p-Jnk, Jnk, p-p38, p38 (MAPK signaling pathway), Bax, Bcl-2, and C-CAS-3 (Cleaved caspase 3) in NRCMs transfected with Ad-Ctrl or Ad-FGF20 in the presence or absence of ISO. FH Quantitative analysis of expressions of p-Erk, Erk, p-Jnk, Jnk, p-p38, and p38 in E. I, J Western blot was performed and quantitatively analyzed to determine the protein levels of 3-NT (a marker of oxidative stress-induced protein damage) in NRCMs transfected with Ad-Ctrl or Ad-FGF20 in the presence or absence of ISO. K Quantitative analysis of the level of ROS in O. L, M Quantitative analysis of expressions of Bax, Bcl-2, and C-CAS-3 in E. N Quantitative analysis of cardiomyocytes apoptosis in O. O DHE staining was performed to detect intracellular ROS (Scale bar = 80 μm) and TUNEL assay was performed to detect cell apoptosis (Scale bar = 60 μm), in NRCMs transfected with Ad-Ctrl or Ad-FGF20 in the presence or absence of ISO. n = 5 per group, #P < 0.05 versus Ad-Ctrl group, *P < 0.05 versus ISO group, &P < 0.05 versus Ad-FGF20 group. Data represent means ± SEM, Two-tailed Student’s t test.
Fig. 3
Fig. 3. Cardiac FGF20 ameliorates TAC-induced cardiac dysfunction and hypertrophy in vivo.
A Schematic diagram demonstrating the animal experiment design. B Western blot was performed and quantitatively analyzed to determine the protein levels of FGF20 in the hearts of mice transfected with AAV harboring FGF20 RNA under the cTnT promoter (AAV-FGF20) or a control vector negative control (AAV-LacZ) by myocardial injection. C Representative M-mode echocardiographic recording obtained from mice infected with AAV-LacZ or AAV-FGF20 and subjected Sham or TAC operation. DF Quantitative analysis of LV ejection fraction (EF), fractional shortening (FS) and heart-to-body weight ratio (HW/BW), respectively. G HE staining (Scale bar =0.8 mm) and WGA staining (Scale bar =30 μm) were performed to detect cardiac hypertrophy, and PSR staining (Scale bar = 200 μm) was were performed to detect cardiac fibrosis of mice infected with AAV-LacZ or AAV-FGF20 and subjected Sham or TAC operation. H Quantitative analysis of cardiomyocyte cross-sectional areas (CSA) in G. I Quantitative analysis of LV collagen volume in G. J RT-qPCR analysis of the mRNA levels of hypertrophic marker genes (ANP, BNP, and MYH7) and fibrosis marker genes (Collagen I and Collagen III) in the hearts of mice infected with AAV-LacZ or AAV-FGF20 and subjected Sham or TAC operation. n = 5 per group, #P < 0.05 versus AAV-LacZ + Sham group, *P < 0.05 versus AAV-LacZ + TAC group, &P < 0.05 versus AAV-FGF20 + Sham group. Data represent means ± SEM, Two-tailed Student’s t test.
Fig. 4
Fig. 4. Cardiac FGF20 ameliorates TAC-induced activation of MAPK signaling pathway, oxidative stress, and apoptosis in vivo.
A Western blot was performed to determine the protein levels of p-Erk, Erk, p-Jnk, Jnk, p-p38, p38 (MAPK signaling pathway), Bax, Bcl-2, and C-CAS-3 (Cleaved caspase 3) in the hearts of mice infected with AAV-LacZ or AAV-FGF20 and subjected Sham or TAC operation. BD Quantitative analysis of expressions of p-Erk, Erk, p-Jnk, Jnk, p-p38, and p38 in A. E, F Western blot was performed and quantitatively analyzed to determine the protein levels of 3-NT in the hearts of mice infected with AAV-LacZ or AAV-FGF20 and subjected Sham or TAC operation. G Quantitative analysis of the level of ROS in K. HI Quantitative analysis of expressions of Bax, Bcl-2 and C-CAS-3 in A. J Quantitative analysis of cardiomyocytes apoptosis in K. K DHE staining (Scale bar = 55 μm) was performed to detect ROS generation and TUNEL assay (Scale bar = 80 μm) was performed to detect cell apoptosis in the hearts of mice infected with AAV-LacZ or AAV-FGF20 and subjected Sham or TAC operation. n = 5 per group, #P < 0.05 versus AAV-LacZ + Sham group, *P < 0.05 versus AAV-LacZ + TAC group, &P < 0.05 versus AAV-FGF20 + Sham group. Data represent means ± SEM, Two-tailed Student’s t test.
Fig. 5
Fig. 5. SIRT1 is the effective executor of FGF20 in myocardial protection.
A Western blot was performed to determine the protein levels of SIRT1, AC-FOXO1, FOXO1, Catalase, and MnSOD in NRCMs transfected with Ad-Ctrl or Ad-FGF20 in the presence or absence of ISO. B Quantitative analysis of expressions of SIRT1, AC-FOXO1, FOXO1, Catalase, MnSOD in A. n = 5 per group, #P < 0.05 versus Ad-Ctrl group, *P < 0.05 versus Ad-Ctrl + ISO group. Data represent means ± SEM, Two-tailed Student’s t test. C Western blot was performed to determine the protein levels of SIRT1, AC-FOXO1, FOXO1, Catalase, and MnSOD in the hearts of mice infected with AAV-LacZ or AAV-FGF20 and subjected Sham or TAC operation. D Quantitative analysis of expressions of SIRT1, AC-FOXO1, FOXO1, Catalase, MnSOD in C. n = 5 per group, #P < 0.05 versus AAV-LacZ + Sham group, *P < 0.05 versus AAV-LacZ + TAC group. Data represent means ± SEM, Two-tailed Student’s t test. E RT-qPCR analysis of the mRNA levels of SIRT1, CAT, and Sod2 in NRCMs transfected with Ad-Ctrl or Ad-FGF20 in the presence or absence of ISO. n = 5 per group, #P < 0.05 versus Ad-Ctrl group, *P < 0.05 versus Ad-Ctrl + ISO group, &P < 0.05 versus Ad-FGF20 group. Data represent means ± SEM, Two-tailed Student’s t test. F RT-qPCR analysis of the mRNA levels of SIRT1, CAT and Sod2 in the hearts of mice infected with AAV-LacZ or AAV-FGF20 and subjected Sham or TAC operation. n = 5 per group, #P < 0.05 versus AAV-LacZ + Sham group, *P < 0.05 versus AAV-LacZ + TAC group, &P < 0.05 versus AAV-FGF20 + Sham group. Data represent means ± SEM, Two-tailed Student’s t test.
Fig. 6
Fig. 6. Knockdown of SIRT1 restricts the benefit of FGF20 to hypertrophic cardiomyocytes in vitro.
A Western blot was performed to determine the protein levels of SIRT1 in NRCMs transfected with short interference SIRT1 (si-SIRT1) or Scramble (si-Scr). B Representative immunofluorescence (red for cTnT, blue for DAPI) and quantitative analysis of myocyte surface area in NRCMs transfected with si-SIRT1 or si-Scr and Ad-Ctrl or Ad-FGF20 followed by ISO treatment. Scale bar = 40 μm. C RT-qPCR analysis of the mRNA levels of hypertrophic marker genes (ANP, BNP, and MYH7) and fibrosis marker genes (Collagen I and Collagen III) in NRCMs transfected with si-SIRT1 or si-Scr and Ad-Ctrl or Ad-FGF20 followed by ISO treatment. D Quantification of myocyte surface area in B. E Western blot was performed to determine the protein levels of p-Erk, Erk, p-Jnk, Jnk, p-p38, p38 (MAPK signaling pathway), AC-FOXO1, FOXO1, Catalase, and MnSOD in NRCMs transfected with si-SIRT1 or si-Scr and Ad-Ctrl or Ad-FGF20 followed by ISO treatment. FH Quantitative analysis of expressions of p-Erk, Erk, p-Jnk, Jnk, p-p38, and p38 in E. I, L, M Quantitative analysis of expressions of AC-FOXO1, FOXO1, Catalase, and MnSOD in E. J, K RT-qPCR analysis of the mRNA levels of CAT and Sod2 in NRCMs transfected with si-SIRT1 or si-Scr and Ad-Ctrl or Ad-FGF20 followed by ISO treatment. N Western blot was performed to determine the protein levels of 3-NT, Bax, Bcl-2, and C-CAS-3 (Cleaved caspase 3) in NRCMs transfected with si-SIRT1 or si-Scr and Ad-Ctrl or Ad-FGF20 followed by ISO treatment. OQ Quantitative analysis of expressions of 3-NT, Bax, Bcl-2, and C-CAS-3 in N. R Quantitative analysis of the level of ROS in T. S Quantitative analysis of cardiomyocytes apoptosis in T. T DHE staining was performed to detect intracellular ROS (Scale bar = 80 μm) and TUNEL assay was performed to detect cell apoptosis (Scale bar = 60 μm), in NRCMs transfected with si-SIRT1 or si-Scr and Ad-Ctrl or Ad-FGF20 followed by ISO treatment. n = 5 per group, #P < 0.05 versus ISO + si-Scr + Ad-Ctrl group, *P < 0.05 versus ISO + si-Scr + Ad-FGF20 group. Data represent means ± SEM, Two-tailed Student’s t test.
Fig. 7
Fig. 7. Cardiac-specific deletion of SIRT1 impairs the protective effect of FGF20 on cardiac dysfunction and hypertrophy in vivo.
A Representative M-mode echocardiographic recording obtained from SIRT1 flox/flox (SIRT1fl/fl) or SIRT1 inducible cardiac-specific knockout (SIRT1-iKO) mice infected with AAV-LacZ or AAV-FGF20 followed TAC operation. BD Quantitative analysis of LV ejection fraction (EF), fractional shortening (FS), and heart-to-body weight ratio (HW/BW), respectively. E HE staining (Scale bar = 0.8 mm) and WGA staining (Scale bar = 30 μm) were performed to detect cardiac hypertrophy and PSR staining (Scale bar = 200 μm) was were performed to detect cardiac fibrosis of SIRT1fl/fl or SIRT1-iKO mice infected with AAV-LacZ or AAV-FGF20 followed TAC operation. F Quantitative analysis of cardiomyocyte cross-sectional areas (CSA) in E. G Quantitative analysis of LV collagen volume in E. H RT-qPCR analysis of the mRNA levels of hypertrophic marker genes (ANP, BNP, and MYH7) and fibrosis marker genes (Collagen I and Collagen III) in the hearts of SIRT1fl/fl or SIRT1-iKO mice infected with AAV-LacZ or AAV-FGF20 followed TAC operation. n = 5 per group, #P < 0.05 versus TAC + AAV-LacZ + SIRT1fl/fl group, *P < 0.05 versus TAC + AAV-FGF20 + SIRT1fl/fl group Data represent means ± SEM, Two-tailed Student’s t test.
Fig. 8
Fig. 8. Cardiac-specific deletion of SIRT1 impairs the protective effect of FGF20 on activation of MAPK signaling pathway, oxidative stress, and apoptosis in vivo.
A Western blot was performed to determine the protein levels of p-Erk, Erk, p-Jnk, Jnk, p-p38, p38 (MAPK signaling pathway), AC-FOXO1, FOXO1, Catalase, and MnSOD in the hearts of SIRT1fl/fl or SIRT1-iKO mice infected with AAV-LacZ or AAV-FGF20 followed TAC operation. BD Quantitative analysis of expressions of p-Erk, Erk, p-Jnk, Jnk, p-p38, and p38 in A. E, HI Quantitative analysis of expressions of AC-FOXO1, FOXO1, Catalase, and MnSOD in A. F, G RT-qPCR analysis of the mRNA levels of Catalase (CAT) and Sod2 in the hearts of SIRT1fl/fl or SIRT1-iKO mice infected with AAV-LacZ or AAV-FGF20 followed TAC operation. J Western blot was performed to determine the protein levels of 3-NT, Bax, Bcl-2, and C-CAS-3 (Cleaved caspase 3) in the hearts of SIRT1fl/fl or SIRT1-iKO mice infected with AAV-LacZ or AAV-FGF20 followed TAC operation. KM Quantitative analysis of expressions of 3-NT, Bax, Bcl-2, and C-CAS-3 in J. N, O TUNEL assay was performed and quantitatively analyzed to determine cell apoptosis in the heart sections of SIRT1fl/fl or SIRT1-iKO mice infected with AAV-LacZ or AAV-FGF20 followed TAC operation. Scale bar = 80 μm. n = 5 per group, #P < 0.05 versus TAC + AAV-LacZ + SIRT1fl/fl group, *P < 0.05 versus TAC + AAV-FGF20 + SIRT1fl/fl group Data represent means ± SEM, Two-tailed Student’s t test.

References

    1. Hill J, Olson E. Cardiac plasticity. New Engl J Med. 2008;358:1370–80. - PubMed
    1. Frey N, Katus H, Olson E, Hill J. Hypertrophy of the heart: a new therapeutic target? Circulation. 2004;109:1580–9. - PubMed
    1. Nakamura M, Sadoshima J. Mechanisms of physiological and pathological cardiac hypertrophy. Nat Rev Cardiol. 2018;15:387–407. - PubMed
    1. Harper S, Johnson J, Borghetti G, Zhao H, Wang T, Wallner M, et al. GDF11 decreases pressure overload-induced hypertrophy, but can cause severe cachexia and premature death. Circ Res. 2018;123:1220–31. - PMC - PubMed
    1. Aimo A, Castiglione V, Borrelli C, Saccaro L, Franzini M, Masi S, et al. Oxidative stress and inflammation in the evolution of heart failure: From pathophysiology to therapeutic strategies. Eur J Prev Cardiol. 2020;27:494–510. - PubMed

Publication types