. 2022 Mar 30;13(3):282.
doi: 10.1038/s41419-022-04726-8.

Adiponectin receptor agonist ameliorates cardiac lipotoxicity via enhancing ceramide metabolism in type 2 diabetic mice

Affiliations

Adiponectin receptor agonist ameliorates cardiac lipotoxicity via enhancing ceramide metabolism in type 2 diabetic mice

Yaeni Kim et al. Cell Death Dis. .

Abstract

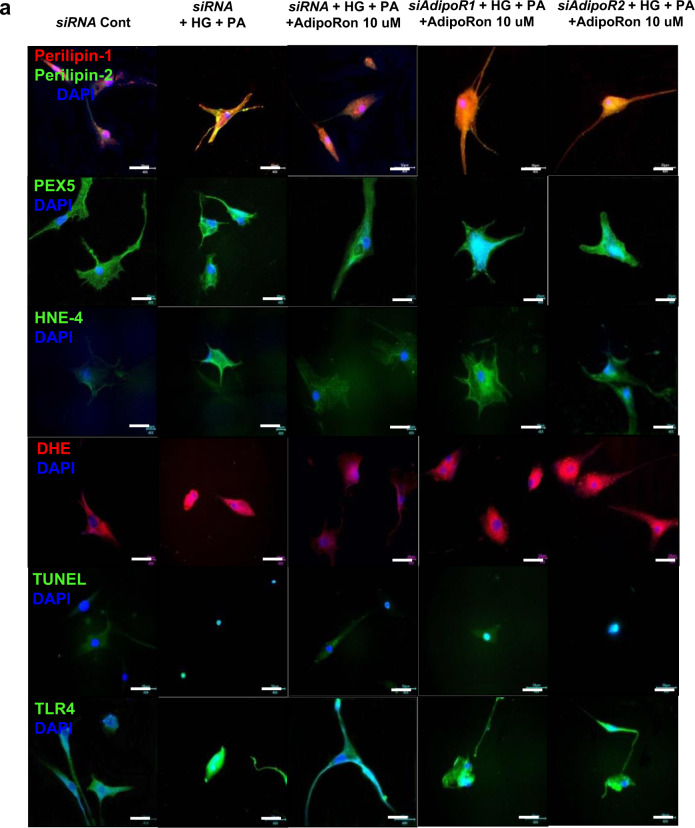
Accumulation of lipids and their metabolites induces lipotoxicity in diabetic cardiomyopathy. Lowering ceramide concentration could reduce the impact of metabolic damage to target organs. Adiponectin improves lipotoxicity through its receptors (AdiopRs), which have sequence homology with ceramidase enzymes. Therefore, cardioprotective role of AdipoR agonism by AdipoRon was investigated. Sixteen-week-old male db/m and db/db mice were fed a diet containing AdipoRon for four weeks. Phenotypic and metabolic profiles with associated cellular signaling pathways involved in lipid metabolism were investigated in the mice heart and human cardiomyocytes to establish treatment effect of AdipoRon. AdipoRon ameliorated insulin resistance, fibrosis, M1-dominant inflammation, and apoptosis in association with reduced accumulations of free fatty acid, triglycerides, and TLR4-related ceramide in the heart. This resulted in overall reduction in the level of oxidative stress which ameliorated cardiac hypertrophy and its function. AdipoRon increased the expression of AdipoR1 and AdipoR2 via pAMPK/FoxO1-induced Akt phosphorylation resulting from a decrease in PP2A level. It also increased acid ceramidase activity which reduced ceramide and increased sphingosine-1 phosphate levels in the heart of db/db mice and cultured human cardiomyocytes. Consistent upregulation of AdipoRs and their downstream regulatory pathways involving pAMPK/PPARα/PGC-1α levels led to lipid metabolism enhancement, thereby improving lipotoxicity-induced peroxisome biogenesis and oxidative stress. AdipoRon might control oxidative stress, inflammation, and apoptosis in the heart through increased AdipoR expression, acid ceramidase activity, and activation of AMPK-PPARα/PGC-1α and related downstream pathways, collectively improving cardiac lipid metabolism, hypertrophy, and functional parameters.


Conflict of interest statement

The authors declare no competing interests.

Figures

Fig. 1
Fig. 1. Changes in echocardiographic parameters of diabetic and non-diabetic mice with or without AdipoRon treatment.
a Representative images of echocardiogram. b-g Quantitative analyses of echocardiographic findings according to groups. *P < 0.05, and **P < 0.01 compared with other groups.
Fig. 2
Fig. 2. Changes in the myocardiac phenotypes; fibrosis, inflammation, and apoptosis of diabetic and non-diabetic mice with or without AdipoRon treatment.
a Representative sections stained with Masson trichrome to estimate the trichrome positive area (%), immunohistochemical staining for type IV collagen, TGF-β1-positive area, and immunofluorescence staining of CTGF-positive cells. be Quantitative analyses of the representative sections according to groups. f Representative images of immunofluorescence staining of F4/80-positive cells. g Quantitative analyses of F4/80-positive cells. h Representative images of western blotting of arginase I, arginase II, iNOS, and GAPDH levels. ik Quantitative analyses of representative western blotting images according to groups. l, m Quantitative analyses of MCP-1 and TNF-α in the cardiac tissues according to groups. n Immunohistochemical staining of TUNEL-positive cells. o Quantitative analyses of immunohistochemical staining according to groups. p Representative images of western blotting of Bax/Bcl-2. q Quantitative analyses of Bax/Bcl-2 according to groups *P < 0.05, **P < 0.01, and #P < 0.001 compared with other groups. Scale bars, 20 μm (in a, f)/ 100 μm (in n).
Fig. 3
Fig. 3. Changes in ceramide metabolism and its associated pathways in diabetic and non-diabetic mice with or without AdipoRon treatment.
a Representative images of immunofluorescence staining of perilipin-1/-2. b, c Quantitative analyses of perilipin-1/-2 according to groups. d Representative images of western blotting of perilipin-1/-2, and GAPDH levels. e, f Quantitative analyses western blotting images according to groups. g Representative images of immunofluorescence staining of PEX5, 4-HNE, DHE-positive cells, and TLR4 level (hk) Quantitative analyses of immunofluorescence images according to groups. l Representative images of western blotting of TLR4 and GAPDH levels. m Quantitative analyses of TLR-4 expression according to groups. ns Quantitative analyses of cholesterol, FFA, ceramide, acid ceramidase, sphingosine 1 phosphate, and PP2A activity in the cardiac tissues. *P < 0.05, **P < 0.01, and #P < 0.001 compared with other groups. Scale bars, 20 μm for perilipin-1/-2 (in a) and 50 μm for TLR4 (in g).
Fig. 4
Fig. 4. Changes in the expression of adiponectin receptors and their associated downstream signaling pathways in diabetic and non-diabetic mice with or without AdipoRon treatment.
a Representative images of western blotting of AdipoR1, AdipoR2, PI3K, pFoxO1, total FoxO1, and GAPDH levels. be Quantitative analyses of western blotting images according to groups. f Quantitative analyses of PI3K activity according to groups. g Representative images of western blotting of CaMKKα, CaMKKβ, phosphorylated Ser431LKB1, total LKB1, phosphorylated AMPK Thr172, total AMPK and GAPDH levels. hk Quantitative analyses of western blotting images according to groups. l Representative images of western blotting of PPARα, PGC-1α, and GAPDH levels. m, n Quantitative analyses according to groups. o Representative images of western blotting of phosphorylated ACC, total ACC, SREBP-1c, and GAPDH levels. p, q Quantitative analyses according to groups. r Representative images of western blotting of phosphorylated Akt, total Akt, phosphorylated Ser1177eNOS, total eNOS, and GAPDH levels. s, t Quantitative analyses according to groups. *P < 0.05, **P < 0.01, and #P < 0.001 compared with other groups.
Fig. 5
Fig. 5. Effect of AdipoRon on downstream signaling pathways in human cardiomyocytes cultured in low- or high-glucose (LG, HG) and palmitate (PA) media with or without AdipoRon.
a Representative images of western blotting of pLKB1, total LKB1, pAMPK, total AMPK, pFoxO1, total FoxO1, PPARα, and β-actin levels. be Quantitative analyses according to groups. f Representative images of western blotting of PGC-1α, phosphorylated ACC, total ACC, pAkt, total Akt, phosphorylated Ser1177eNOS, total eNOS, and β-actin levels. gj Quantitative analyses according to groups. k Representative images of immunofluorescence staining of DHE expression and TUNEL-positive cells. l, m Quantitative analyses according to groups. *P < 0.05, **P < 0.01, and #P < 0.001 compared with other groups. Scale bars, 20 μm (in k).
Fig. 6
Fig. 6. Effect of AdipoR1 and AdipoR2 siRNAs on oxidative stress and ceramide metabolism in human cardiomyocytes cultured in low- or high-glucose and palmitate media with or without AdipoRon.
a Representative images of immunofluorescence staining of perilipin-1/-2, PEX5, HNE4, DHE, TUNEL, and TLR4 expressions. bh Quantitative analyses according to groups. i Representative images of western blotting of perilipin-1/-2, PEX5, HNE4, TLR4, and actin levels. jn Quantitative analyses according to groups. oq Quantitative analyses of acid ceramidase, sphingosine 1 phosphate, and PP2A activity according to groups. *P < 0.05, **P < 0.01, and #P < 0.001 compared with other groups. Scale bars, 50 μm (in a).
Fig. 7
Fig. 7. Effect of AdipoR1 and AdipoR2 siRNAs on PI3K/FoxO1 and associated primary signaling pathways in human cardiomyocytes cultured in low- or high-glucose and palmitate media with or without AdipoRon.
a Representative images of western blotting of AdipoR1, AdipoR2, PI3K, pAkt, total Akt, pFoxO1, total FoxO1, and β-actin levels. bg Quantitative analyses according to groups. h Representative images of immunofluorescence staining of Fluo-4 AM. i Quantitative analyses if Fluo-4 AM according to groups. j Representative images of western blotting of CaMKKβ, pAMPK, total AMPK, PPARα, and β-actin levels. km Quantitative analyses according to groups. *P < 0.05, **P < 0.01, and #P < 0.001 compared with other groups. Scale bars, 20 μm (in h).
Fig. 8
Fig. 8. Cardiomyocyte survival and proliferation by adiponectin receptor agonism.
Adiponectin receptor agonism activates CaMKKβ, LKB1, AMPK and PPARα. It also has ceramidase activity and can catalyze the conversion of ceramide to sphingosine, which produces S1P, subsequently increasing S1P to ceramide ratio that further ameliorates endothelial dysfunction through increased NO level. Activation of associated downstream pathways exert prometabolic effects by enhancing fatty acid oxidation and mitochondrial biogenesis. Red dottedlines: Constitutive activation of FoxO1 by AMPK represses PP2A and its interaction with Akt, subsequently increasing Akt phosphorylation, which would otherwise have been dephosphorylated by continuous inhibitory effect of PP2A with subsequent inhibition of eNOS through ceramide biosynthesis. The net result is the improvement of ceramide-induced oxidative stress via pro-metabolic effects of adiponectin agonism in which pAMPK-induced FoxO1 activation might play a crucial role in modulating its receptor expressions.

References

    1. Unger RH. Lipid overload and overflow: metabolic trauma and the metabolic syndrome. Trends Endocrinol Metab. 2003;14:398–403. doi: 10.1016/j.tem.2003.09.008. - DOI - PubMed
    1. Goldberg IJ, Trent CM, Schulze PC. Lipid metabolism and toxicity in the heart. Cell Metab. 2012;15:805–12. doi: 10.1016/j.cmet.2012.04.006. - DOI - PMC - PubMed
    1. Banerjee S, Peterson LR. Myocardial metabolism and cardiac performance in obesity and insulin resistance. Curr Cardiol Rep. 2007;9:143–9. doi: 10.1007/BF02938341. - DOI - PubMed
    1. Harmancey R, Wilson CR, Taegtmeyer H. Adaptation and maladaptation of the heart in obesity. Hypertension. 2008;52:181–7. doi: 10.1161/HYPERTENSIONAHA.108.110031. - DOI - PMC - PubMed
    1. Rodrigues B, Cam MC, Jian K, Lim F, Sambandam N, Shepherd G. Differential effects of streptozotocin-induced diabetes on cardiac lipoprotein lipase activity. Diabetes. 1997;46:1346–53. doi: 10.2337/diab.46.8.1346. - DOI - PubMed

Publication types

MeSH terms