. 2022 Mar 29;13(1):1615.
doi: 10.1038/s41467-022-28810-x.

The world-wide waste web

Affiliations

The world-wide waste web

Johann H Martínez et al. Nat Commun. .

Abstract

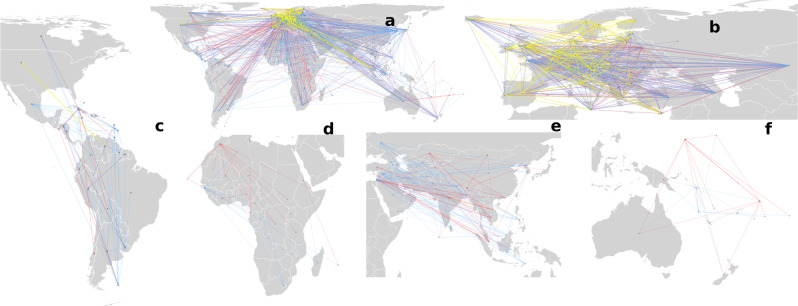
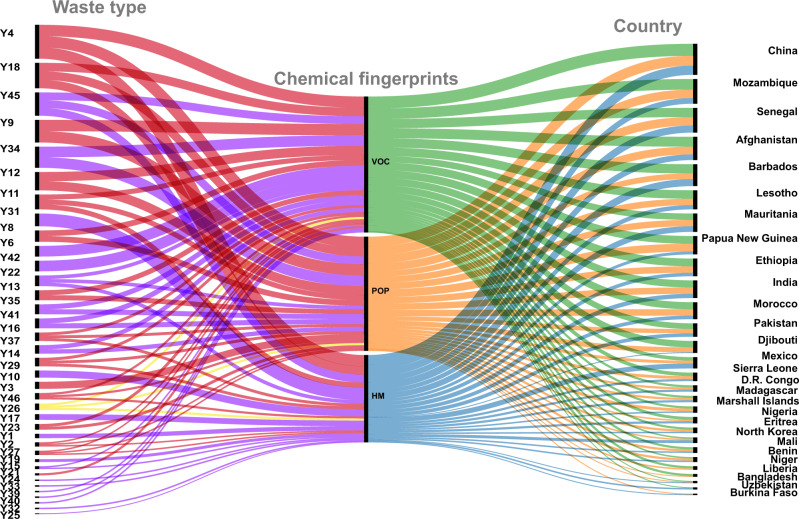
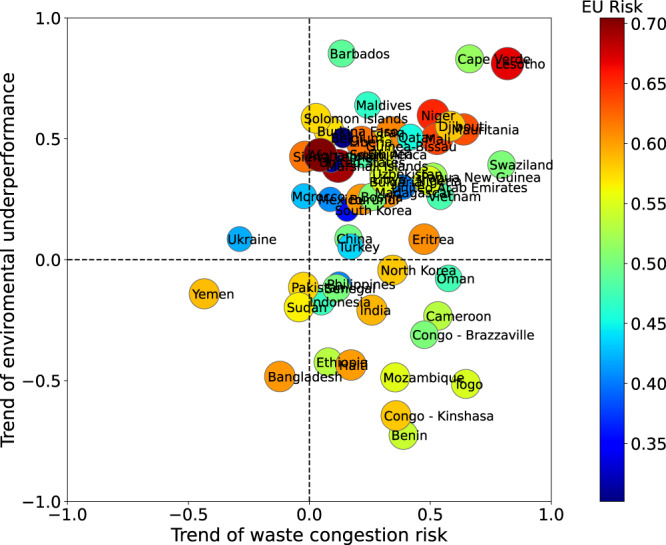
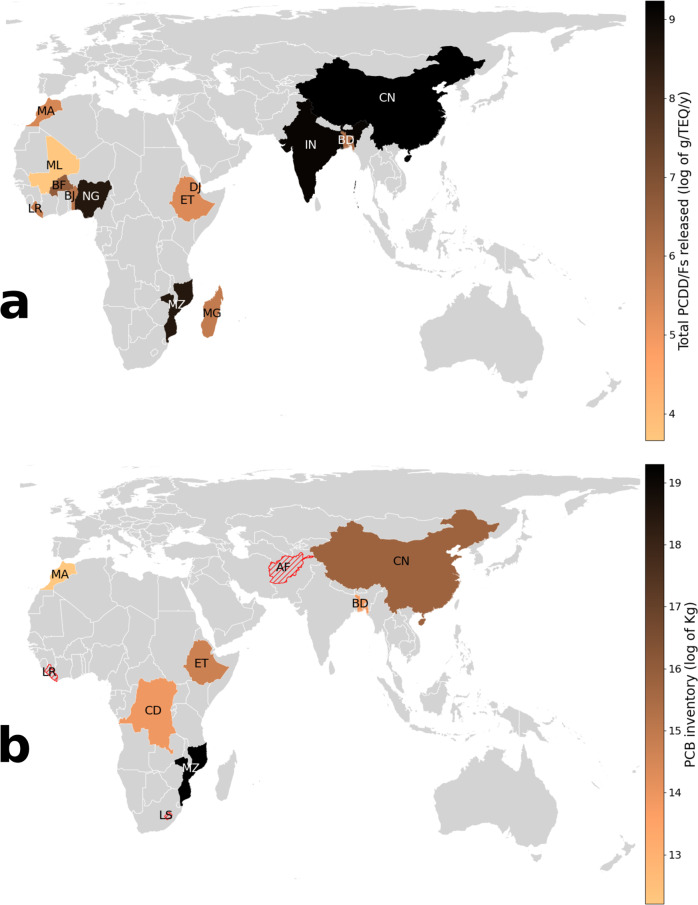
Countries globally trade with tons of waste materials every year, some of which are highly hazardous. This trade admits a network representation of the world-wide waste web, with countries as vertices and flows as directed weighted edges. Here we investigate the main properties of this network by tracking 108 categories of wastes interchanged in the period 2001-2019. Although, most of the hazardous waste was traded between developed nations, a disproportionate asymmetry existed in the flow from developed to developing countries. Using a dynamical model, we simulate how waste stress propagates through the network and affects the countries. We identify 28 countries with low Environmental Performance Index that are at high risk of waste congestion. Therefore, they are at threat of improper handling and disposal of hazardous waste. We find evidence of pollution by heavy metals, by volatile organic compounds and/or by persistent organic pollutants, which are used as chemical fingerprints, due to the improper handling of waste in several of these countries.


Conflict of interest statement

The authors declare no competing interests.

Figures

Fig. 1
Fig. 1. The world-wide waste web.
Superposition of the W4 networks of types I (red edges), type II (blue edges), and type III (yellow edges) of waste, where the nodes represent the countries which traded the corresponding waste in the years 2001–2019. The direction of the edges indicates the flow from exporter to importer as reported in the BaC database. A view of the global network in (a), with zooms for the local networks of Europe in (b), the Americas (c), Africa (d), Asia (e), and Oceania (f). Map tiles by Bjorn Sandvik, under CC BY-SA 3.0 available at http://thematicmapping.org/downloads/world_borders.php.
Fig. 2
Fig. 2. Potential environmental impact of waste congestion (PEIWC).
Plot of the risk of waste congestion versus the environmental performance (a) indicating the central region of “tolerance” where countries process waste with relatively low environmental and human health impacts. The tolerance zone is defined here by the upper and lower 50% prediction bounds for response values associated with the linear regression trend between the two risk indices. Countries over the tolerance zone are at high risk of improper handling and disposal of wastes (HRIHDW). bd Illustration of the PEIWC for wastes of types I–III, respectively. Nodes are colored by the continent to which the country belongs to: blue (Americas), purple (Europe), orange (Africa), green (Asia), yellow (Australia/Oceania). Icons of panel a were obtained from https://www.pdclipart.org/ under CC Public Domain.
Fig. 3
Fig. 3. Chemical fingerprints of waste.
The three classes of chemical fingerprints: Volatile Organic Compounds (VOC) (green), Persistent Organic Pollutants (POP) (orange), and HM (blue) left by the three BaC waste types Y1-Y18 (red), Y19-Y45 (purple), Y46-Y47 (yellow) in the top 28 countries at high risk of improper handling and disposal of wastes (HRIHDW).
Fig. 4
Fig. 4. Temporal trend (period 2001–2019) of the waste congestion risk and of the environmental underperformance risk for some countries at HRIHDW.
The trend is measured by the Pearson correlation coefficient between the corresponding variable and the years in the period. Bottom-left quarter identifies the countries with a trend to improve both indices. Top-right quarter identified those countries with a trend to deterioration of both indices. EU Risk stands for Environmental Underperformance Risk.
Fig. 5
Fig. 5. High risk of improper handling and disposal of wastes.
Illustration of countries at HRIHDW of types I–III wastes and the chemical fingerprints left by these HW in their environment and/or human health. Countries with impact of heavy metals (HM) and persistent organic pollutants (POP) (green), volatile organic compounds (VOC) and HM (purple), VOC, HM and POP (red), VOC and POP (yellow) are illustrated. Map tiles by Bjorn Sandvik, under CC BY-SA 3.0 available at http://thematicmapping.org/downloads/world_borders.php.
Fig. 6
Fig. 6. Geographical distribution of PCB and Dioxins.
a Amounts of PCB stored in some of the countries at HRIHDW identified in this work. The amounts are given in logarithmic scale. b Total amounts of PCDD/Fs released to the environment by some of the countries at HRIHDW identified in this work. The amounts are given in logarithmic scale. The average amount of PCDD/Fs released in the 64 countries not in the list of countries at HRIHDW is 398.8 g/TEQ/y, which in log scale is 5.99. Map tiles by Bjorn Sandvik, under CC BY-SA 3.0 available at http://thematicmapping.org/downloads/world_borders.php.

References

    1. Wilson DC, Velis CA. Waste management—still a global challenge in the 21st century: an evidence-based call for action. Waste Manage. Res. 2015;33:1049–1051. - PubMed
    1. Chen DM-C, Bodirsky BL, Krueger T, Mishra A, Popp A. The world’s growing municipal solid waste: trends and impacts. Environ. Res. Lett. 2020;15:074021.
    1. Akpan VE, Olukanni DO. Hazardous waste management: an African overview. Recycling. 2020;5:15.
    1. The world counts hazardous waste statistics—the world counts. https://www.theworldcounts.com/challenges (2021).
    1. Krueger, J. in Yearbook of International Co-operation on Environment and Development 2002, 43–51 (2001).

Publication types