. 2022 Mar 29;9(1):113.
doi: 10.1038/s41597-022-01244-2.

Calcium Imaging and Electrophysiology of hippocampal Activity under Anesthesia and natural Sleep in Mice

Affiliations

Calcium Imaging and Electrophysiology of hippocampal Activity under Anesthesia and natural Sleep in Mice

Andrey Formozov et al. Sci Data. .

Abstract

The acute effects of anesthesia and their underlying mechanisms are still not fully understood. Thus, comprehensive analysis and efficient generalization require their description in various brain regions. Here we describe a large-scale, annotated collection of 2-photon calcium imaging data and multi-electrode, extracellular electrophysiological recordings in CA1 of the murine hippocampus under three distinct anesthetics (Isoflurane, Ketamine/Xylazine and Medetomidine/Midazolam/Fentanyl), during natural sleep, and wakefulness. We cover several aspects of data quality standardization and provide a set of tools for autonomous validation, along with analysis workflows for reuse and data exploration. The datasets described here capture various aspects of neural activity in hundreds of pyramidal cells at single cell resolution. In addition to relevance for basic biological research, the dataset may find utility in computational neuroscience as a benchmark for models of anesthesia and sleep.


Conflict of interest statement

The authors declare no competing interests.

Figures
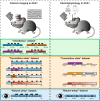
Fig. 1
Fig. 1
Experimental design and data-acquisition procedures for two-photon calcium imaging (left) and electrophysiological recordings (right) from the mouse hippocampus. The calcium imaging “Anesthesia” dataset was acquired in blocks of 5 min (indicated by black rectangles) in each condition (awake, isoflurane, MMF, and Keta/Xyl). The “Transition State” and “Natural Sleep” datasets capture 6–6.5 h of monitoring with blocks of calcium recordings lasting from 2 to 19 min, each. Electrophysiological recordings were acquired continuously for 105 min (“Transition State”) or for 67 to 147 min (“Natural Sleep”). Pupillometry recordings accompany all “Natural Sleep” datasets.
Fig. 2
Fig. 2
Technical validation of the calcium imaging datasets. Several basic characteristics of the recordings are considered for validation. Number of extracted ROIs (one data point per recording), distribution of the median amplitude and skewness of the signal traces for all ROI, decay time of transients extracted from the traces, and 2nd/1st ratio (the ratio of the median signal of the first and the second half of the traces in each recording) as an indicator of recording stability. The box plots represent the distribution of a parameter in the range between the 1st (Q1) and 3rd (Q3) quartile, the central line is a median (2nd quartile, Q2), while whiskers defined as 1.5 * (Q3 – Q1). Recordings in “Anesthesia” (n = 7 animals) and “Transition State” (n = 7) datasets are grouped by condition, while in “Natural sleep” (n = 3) dataset, they are grouped by animal.
Fig. 3
Fig. 3
Validation of electrophysiological recordings. (a) LFP power spectral density in awake period, different colors indicate different animals. (b) Number of refractory period violations in SUA data. (c) Correlation between the firing rates in the first and the second half of the data.
Fig. 4
Fig. 4
Tracking of eye features and dynamics in pupil size. (a) Example of feature tracking during calcium imaging experiments (upper, lower, left, and right edges of the pupil (orange) and eyelid (magenta), n = 100 samples). Images are the mean of 100 subsequent frames. (b) Same as (a), but for extracellular electrophysiological recordings. (c) Raw pupil diameter across sessions, color-coded by animal and session type. (d) Average pupil diameter in pixels in each session as a function of the fraction of sleep periods in this respective session. (e) Maximum-normalized pupil size for each animal during epochs classified as awake. (f) Same as (e), but for epochs classified as sleep. The box plots represent the distribution of a parameter in the range between the 1st (Q1) and 3rd (Q3) quartile, the central line is a median (2nd quartile, Q2), while whiskers defined as minimum and maximum values, respectively.
Fig. 5
Fig. 5
Interactive structure of the analysis pipeline for electrophysiological and calcium imaging data [Interactive version].

References

    1. Yang W, et al. Anesthetics fragment hippocampal network activity, alter spine dynamics, and affect memory consolidation. PLOS Biology. 2021;19:e3001146. doi: 10.1371/journal.pbio.3001146. - DOI - PMC - PubMed
    1. Chen T-W, et al. Ultrasensitive fluorescent proteins for imaging neuronal activity. Nature. 2013;499:295–300. doi: 10.1038/nature12354. - DOI - PMC - PubMed
    1. Harris KD, Quiroga RQ, Freeman J, Smith SL. Improving data quality in neuronal population recordings. Nat Neurosci. 2016;19:1165–1174. doi: 10.1038/nn.4365. - DOI - PMC - PubMed
    1. Pachitariu, M. et al. Suite2p: beyond 10,000 neurons with standard two-photon microscopy. 061507, 10.1101/061507(2017).
    1. Ching S, Brown EN. Modeling the dynamical effects of anesthesia on brain circuits. Current Opinion in Neurobiology. 2014;25:116–122. doi: 10.1016/j.conb.2013.12.011. - DOI - PMC - PubMed

Publication types