. 2022 Mar 28;12(1):5291.
doi: 10.1038/s41598-022-09364-w.

Förster resonance energy transfer biosensors for fluorescence and time-gated luminescence analysis of rac1 activity

Affiliations

Förster resonance energy transfer biosensors for fluorescence and time-gated luminescence analysis of rac1 activity

Ha Pham et al. Sci Rep. .

Abstract

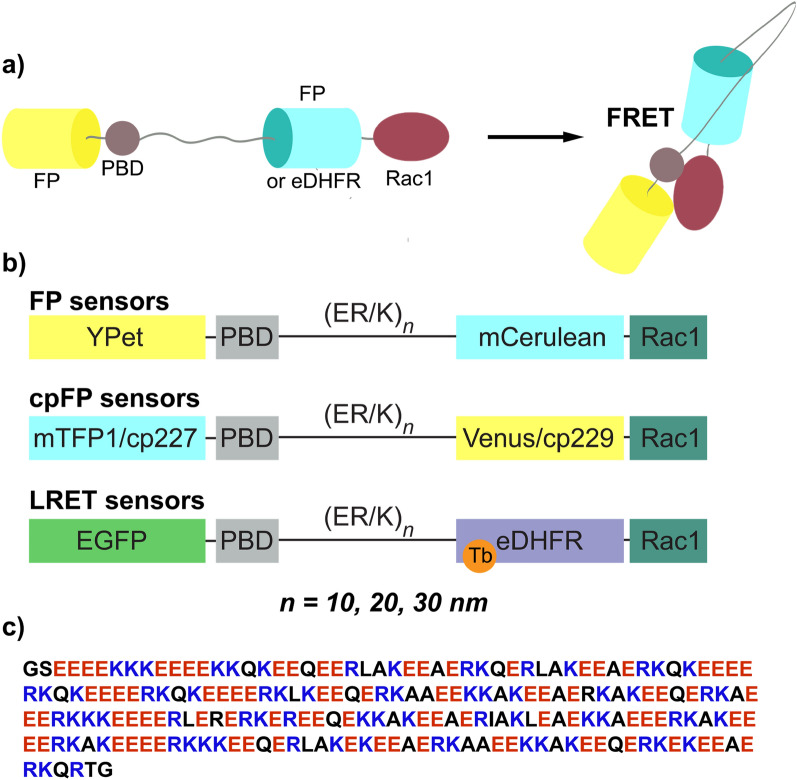
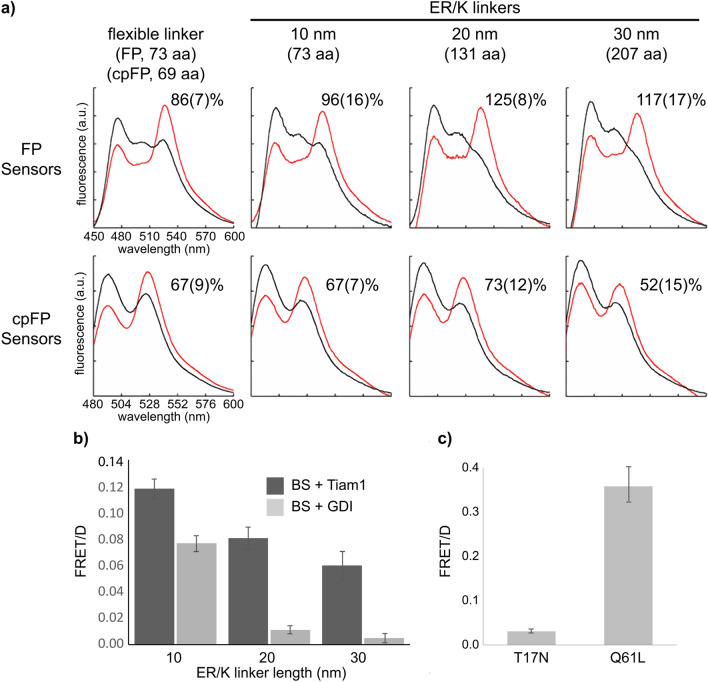
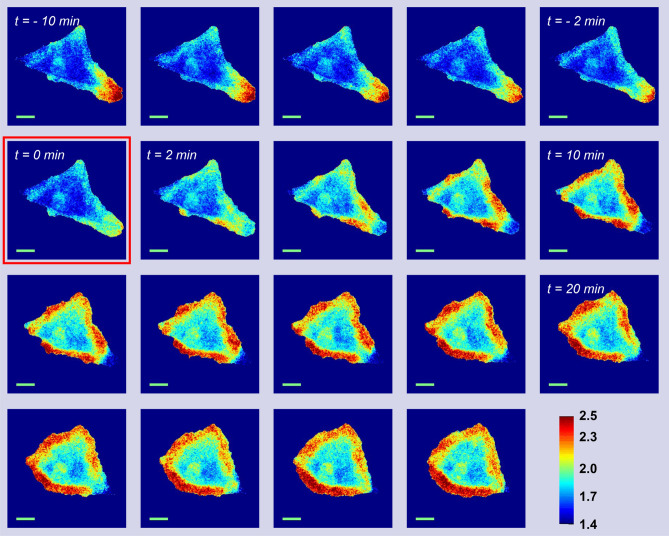
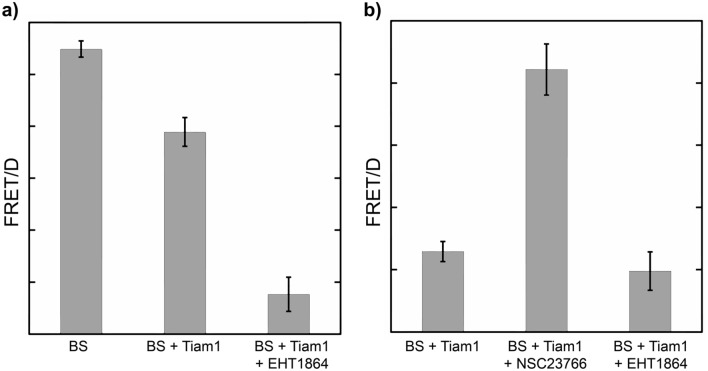
Genetically encoded, Förster resonance energy transfer (FRET) biosensors enable live-cell optical imaging of signaling molecules. Small conformational changes often limit the dynamic range of biosensors that combine fluorescent proteins (FPs) and sensing domains into a single polypeptide. To address this, we developed FRET and lanthanide-based FRET (LRET) biosensors of Rac1 activation with two key features that enhance sensitivity and dynamic range. For one, alpha helical linker domains separate FRET partners and ensure a large conformational change and FRET increase when activated Rac1 at the biosensor C-terminus interacts with an amino-terminal Rac binding domain. Incorporation of a luminescent Tb(III) complex with long (~ ms) excited state lifetime as a LRET donor enabled time-gated luminescence measurements of Rac1 activity in cell lysates. The LRET dynamic range increased with ER/K linker length up to 1100% and enabled robust detection of Rac1 inhibition in 96-well plates. The ER/K linkers had a less pronounced, but still significant, effect on conventional FRET biosensors (with FP donors and acceptors), and we were able to dynamically image Rac1 activation at cell edges using fluorescence microscopy. The results herein highlight the potential of FRET and LRET biosensors with ER/K linkers for cell-based imaging and screening of protein activities.


Conflict of interest statement

The authors declare no competing interests.

Figures

Figure 1
Figure 1
Design of FRET and LRET Rac1 biosensors. (a) Schematic representation and (b) mammalian expression constructs of single-chain FRET or LRET Rac1 biosensors. A series of nine sensors was constructed in which alpha-helical ER/K linkers of different length (10 nm, 20 nm and 30 nm) were combined with three fluorophore pairs: (i) mCerulean and Ypet; (ii) circularly permutated mutant (cp227) of mTFP1 and circularly permutated mutant (cp229) of Venus; (iii) Tb(III) complex (bound to E. coli dihydrofolate reductase, eDHFR) and EGFP. (c) Sequence of a 30 nm alpha-helical ER/K linker (207 residues) that includes alternated repeats of approximately four negatively charged glutamates (red) and four negatively charged arginines or lysines (blue). The linker is rigid to keep protein components far apart in OFF state. Stochastic breaks allow protein interaction in the biosensor ON-state and promote a large change in donor-sensitized acceptor emission.
Figure 2
Figure 2
Evaluation of Rac1 biosensors by fluorometry and TGL luminescence. Rac1 biosensors were evaluated by co-expressing each sensor with Tiam1 (On state, red trace in (a) or black bar in (b) or RhoGDI (Off state, black trace in (a) or gray bar in (b) in 293 T cells. (a) Cells co-expressing FP or cpFP sensors and the regulators were scanned for emission profiles in cell suspension using a cuvette-based fluorometer. ΔR/Ri values representing differences in FRET efficiency between the On and Off states are shown for the indicated biosensor. (b) Cells co-expressing LRET biosensors and the regulators were grown in a 96-well plate. Following overnight incubation, cells were treated with lysis buffer containing TMP-TTHA-cs124 (25 nM). The time-gated emission (gate delay, 0.2 ms) at 520 nm (Tb-to-GFP LRET) and 615 nm (Tb only) were measured using a time-resolved fluorescence plate reader. Substantially larger 520 nm/615 nm (FRET/D) ratios were observed in the positive control wells (Tiam1) relative to those seen in the negative controls (RhoGDI). (c) 293 T cells expressing inactive (Rac1 T17N) or active (Rac1 Q61L) mutants of the LRET biosensor with 30 nm ER/K linker were grown in a 96-well plate and underwent the same lysis-buffer treatment and plate-reader measurement as in (b). Fluorescence spectra in (a) are representative of cells transiently expressing biosensors with transfection efficiency > 70%. Dynamic range values represented as mean(sem) (n ≥ 3 transfections). Error bars in (b), (c), sem (n ≥ 3 transfections/plates; 16 wells/plate for each condition).
Figure 3
Figure 3
Live-cell imaging of Rac1 biosensors. Representative image series of a HeLa cell co-expressing the FP Rac1 sensor with the 20 nm ER/K linker (transient transfection) and RapR-Src constructs (stable transfection) was imaged at two-minute intervals. The first image obtained following rapamycin addition (500 nM) is indicated by the square (at t = 0). The montage shows FRET/mCerulean ratio images with warmer colors reflecting higher localized Rac1 activity.
Figure 4
Figure 4
LRET robustly detects chemical inhibition of Rac1 activitation in 96-well plates. (a) 293 T cells expressing a LRET Rac1 biosensor (30 nm ER/K linker) alone (BS) or with Tiam1 (BS + Tiam1) were grown overnight in 96-well plates, then incubated with. Time-gated measurements were obtained following 4 h incubation with EHT 1864 (50 µM, 0.5% DMSO) and addition of a lysis buffer containing TMP-TTHA-cs124. (b) 293 T cells co-expressing the sensor and Tiam1 were grown in 96-well overnight with or without inhibitors in the media. Time-gated measurements were taken after adding the lysis buffer as in (a). Bar graphs depict mean FRET/donor (FRET/D) ratios measured for each condition. Error bars, sem (n ≥ 3 transfections/plates; 16 wells/plate for each condition).

Similar articles

Cited by

References

    1. Greenwald EC, Mehta S, Zhang J. Genetically encoded fluorescent biosensors illuminate the spatiotemporal regulation of signaling networks. Chem. Rev. 2018;118:11707–11794. - PMC - PubMed
    1. Specht EA, Braselmann E, Palmer AE. A critical and comparative review of fluorescent tools for live-cell imaging. Annu. Rev. Physiol. 2017;79:93–117. - PubMed
    1. Welch CM, Elliott H, Danuser G, Hahn KM. Imaging the coordination of multiple signalling activities in living cells. Nat. Rev. Mol. Cell Biol. 2011;12:749–756. - PMC - PubMed
    1. Terai K, Imanishi A, Li C, Matsuda M. Two decades of genetically encoded biosensors based on Förster Resonance energy transfer. Cell Struct. Funct. 2019;44:153–169. - PubMed
    1. Jares-Erijman EA, Jovin TM. FRET imaging. Nat. Biotechnol. 2003;21:1387–1395. - PubMed

Publication types

MeSH terms