. 2022 Dec;6(12):1370-1383.
doi: 10.1038/s41551-022-00867-5. Epub 2022 Mar 29.

Detection of signs of disease in external photographs of the eyes via deep learning

Affiliations

Detection of signs of disease in external photographs of the eyes via deep learning

Boris Babenko et al. Nat Biomed Eng. 2022 Dec.

Abstract

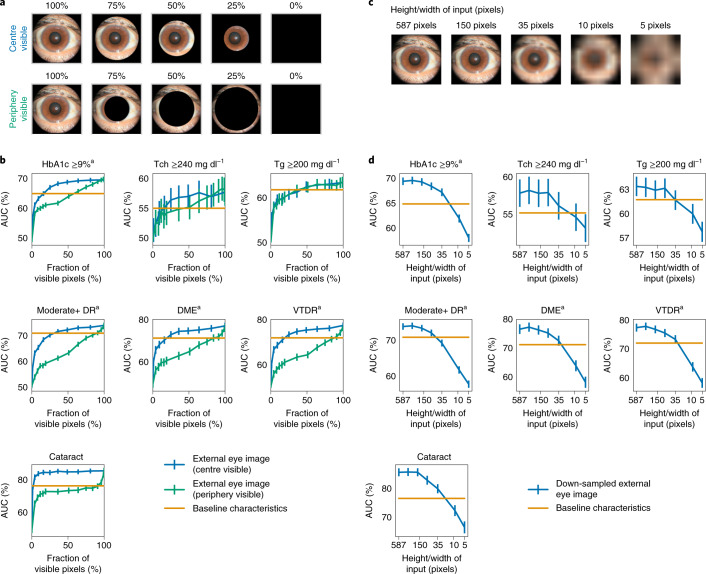
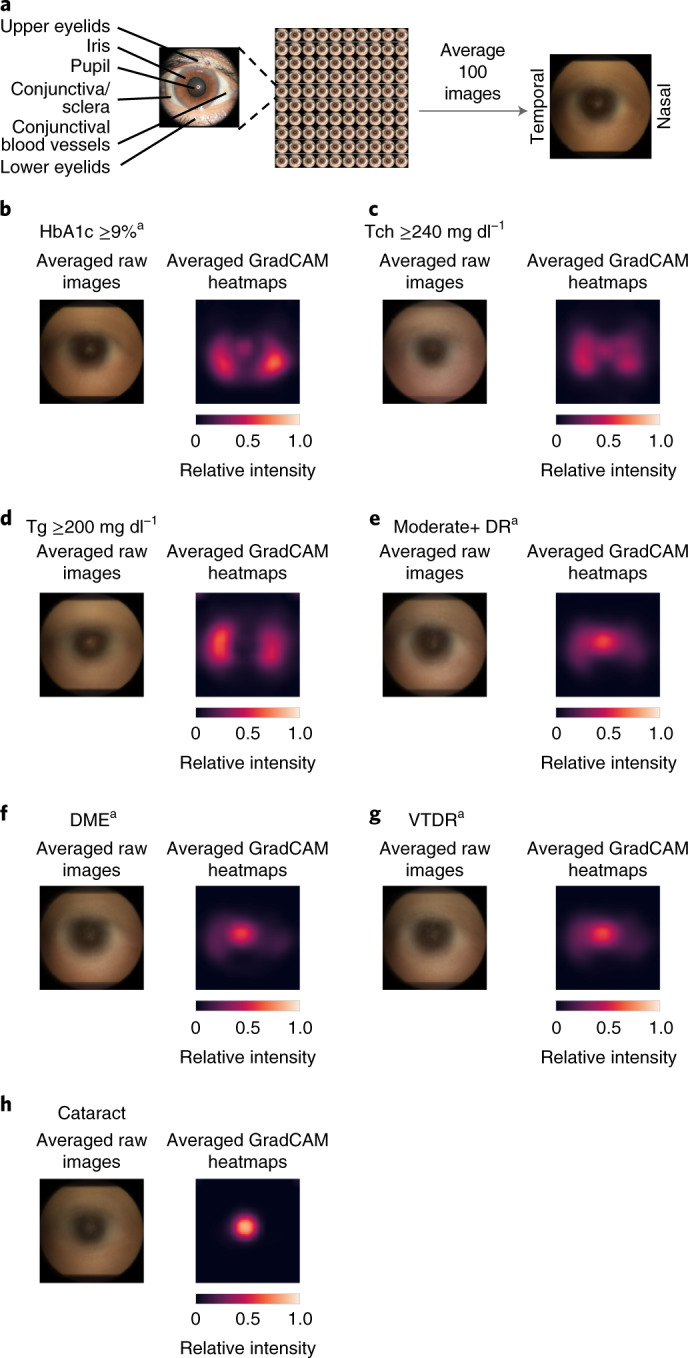
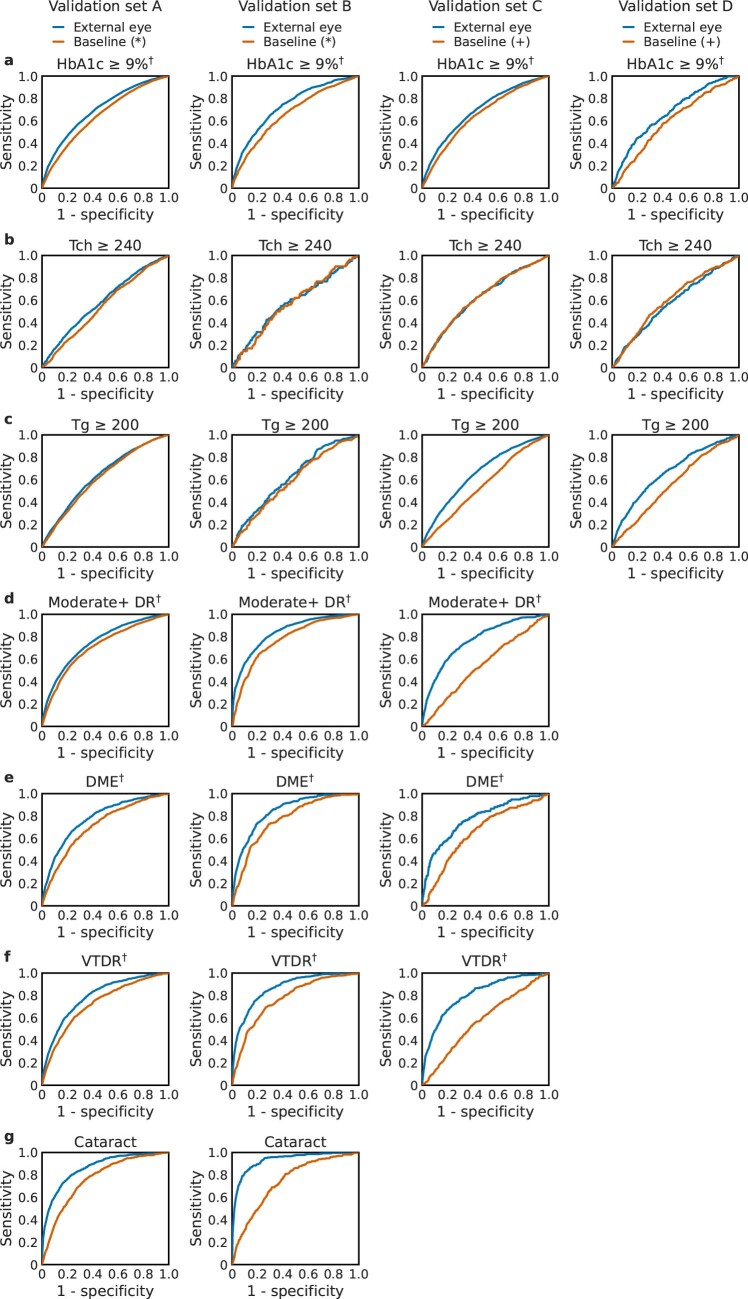
Retinal fundus photographs can be used to detect a range of retinal conditions. Here we show that deep-learning models trained instead on external photographs of the eyes can be used to detect diabetic retinopathy (DR), diabetic macular oedema and poor blood glucose control. We developed the models using eye photographs from 145,832 patients with diabetes from 301 DR screening sites and evaluated the models on four tasks and four validation datasets with a total of 48,644 patients from 198 additional screening sites. For all four tasks, the predictive performance of the deep-learning models was significantly higher than the performance of logistic regression models using self-reported demographic and medical history data, and the predictions generalized to patients with dilated pupils, to patients from a different DR screening programme and to a general eye care programme that included diabetics and non-diabetics. We also explored the use of the deep-learning models for the detection of elevated lipid levels. The utility of external eye photographs for the diagnosis and management of diseases should be further validated with images from different cameras and patient populations.


Conflict of interest statement

B.B., A.M., N.K., G.S.C., L.P., D.R.W., A.V., N.H. and Y.L. are employees of Google LLC, own Alphabet stock and are co-inventors on patents (in various stages) for machine learning using medical images. I.T. is a consultant of Google LLC. J.C. is the CEO of EyePACS Inc. A.Y.M. declares no competing interests.

Figures

Fig. 1
Fig. 1. Extracting insights from external photographs of the front of the eye.
a, Diabetes-related complications can be diagnosed by using specialized cameras to take fundus photographs, which visualize the posterior segment of the eye. By contrast, anterior imaging using a standard consumer-grade camera can reveal conditions affecting the eyelids, conjunctiva, cornea and lens. In this work, we show that external photographs of the eye can offer insights into diabetic retinal disease and detect poor blood sugar control. These images are shown for illustrative purposes only and do not necessarily belong to the same subject. b, Our external eye DLS was developed on data from California (CA, yellow) and evaluated on data from 18 other US states (light blue). c, AUCs for the four validation datasets. The prediction tasks shown are poor sugar control (HbA1c ≥9%), elevated lipids (total cholesterol (Tch) ≥240 mg dl−1, triglycerides (Tg) ≥200 mg dl−1), moderate+ DR, DME, VTDR and a positive control: cataract. Some targets were not available in validation sets C and D. Error bars are 95% CIs computed using the DeLong method. A graphic visualization of receiver operating characteristic (ROC) curves is shown in Extended Data Fig. 3, and Supplementary Table 1 contains numerical values of AUCs along P values for improvement. d, Similar to c but for PPV. The thresholds used for the PPV are based on the 5% of patients with the highest predicted likelihood. Error bars are 95% bootstrap CIs. A graphic visualization of the PPV over multiple thresholds is in Extended Data Fig. 1. aBaseline characteristics models for validation sets A and B include self-reported age, sex, race/ethnicity and years with diabetes and were trained on the training dataset. bThe baseline characteristics models for validation sets C and D include self-reported age and sex and were trained directly on the respective sets due to large differences in patient population compared with the development set. Thus, these overestimate baseline performance. cPre-specified primary prediction tasks.
Fig. 2
Fig. 2. Importance of different regions of the image and impact of image resolution.
a, Sample images with different parts of the image visible. Top: only a circle centred around the centre is visible. Bottom: only the peripheral rim is visible. b, AUCs as a function of the fraction of input pixels visible when the DLS sees only the centre (blue curve) or peripheral regions (green curve). A large delta between the blue and green curves (for example, for cataract) indicates that most of the information is in the region corresponding to the blue line. c, Sample images of different resolutions. Images were down-sampled to a certain size (for example, ‘5’ indicates 5 × 5 pixels across) and then up-sampled to the same original input size of 587 × 587 pixels to ensure that the network has the exact same capacity (Methods). d, AUCs corresponding to different input image resolutions. Error bars are 95% CIs computed using the DeLong method. aPre-specified primary prediction tasks.
Fig. 3
Fig. 3. Qualitative and quantitative saliency analysis illustrating the influence of various regions of the image towards the prediction.
a, Overview of anterior eye anatomy. bh, Eye images from patients with HbA1c ≥9% (b), Tch ≥240 mg dl−1 (c), Tg ≥200 mg dl−1 (d), moderate+ DR (e), DME (f), VTDR (g), and cataract (h). Illustrations are the result of averaging images or saliency maps from 100 eyes, with laterality manually adjusted via horizontal flips to have the nasal side on the right (Methods). Left: the original averaged image. Right: a similarly averaged saliency from GradCAM. Saliency maps from other methods are shown in Supplementary Fig. 4a–g. aPre-specified primary prediction tasks.
Extended Data Fig. 1
Extended Data Fig. 1. Curves of positive predictive value (PPV) as a function of threshold for various predictions using external eye images.
a, poor sugar control (HbA1c ≥ 9%), b-c, elevated lipids (total cholesterol ≥ 240 mg dl-1 and triglycerides ≥ 200 mg dl-1), d, moderate-or-worse diabetic retinopathy (DR), e, diabetic macular edema (DME), f, vision-threatening DR (VTDR), and g, a positive control: cataract. In these plots, the x-axis indicates the percentage of patients predicted to be positive; for example 5% means the top 5% based on predicted likelihood was categorized to be “positive”, and the respective curves indicate the PPV for that threshold. The curves are truncated at the extreme end (when only 0.5% of patients are predicted positive, confidence intervals are wide) to reduce noise and improve clarity. Shaded areas indicate 95% bootstrap confidence intervals. Empty panels indicate unavailable data in validation set C and D. (*) Baseline characteristics models for validation sets A and B include self-reported age, sex, race/ethnicity and years with diabetes and were trained on the training dataset. (+) The baseline characteristics models for validation sets C and D use self-reported age and sex and were trained directly on validation sets C and D due to large differences in patient population compared to the development set. : prespecified primary prediction tasks.
Extended Data Fig. 2
Extended Data Fig. 2. Curves of negative predictive values (NPV) as a function of threshold for various predictions using external eye images.
a, poor sugar control (HbA1c ≥ 9%), b-c, elevated lipids (total cholesterol ≥ 240 mg dl-1 and triglycerides ≥ 200 mg dl-1), d, moderate-or-worse diabetic retinopathy (DR), e, diabetic macular edema (DME), f, vision-threatening DR (VTDR), and g, a positive control: cataract. This is the NPV equivalent of Extended Data Fig. 1. The curves are truncated at the extreme end (when only 1% of patients are predicted negative, confidence intervals are wide) to reduce noise and improve clarity. Shaded areas indicate 95% bootstrap confidence intervals. Empty panels indicate unavailable data in validation set C and D. (*) Baseline characteristics models for validation sets A and B include self-reported age, sex, race/ethnicity and years with diabetes and were trained on the training dataset. (+) The baseline characteristics models for validation sets C and D use self-reported age and sex and were trained directly on validation sets C and D due to large differences in patient population compared to the development set. : prespecified primary prediction tasks.
Extended Data Fig. 3
Extended Data Fig. 3. Receiver operating characteristic curves (ROCs) for various predictions using external eye images.
a, poor sugar control (HbA1c ≥ 9%), b-c, elevated lipids (total cholesterol ≥ 240 mg dl-1 and triglycerides ≥ 200 mg dl-1), d, moderate-or-worse diabetic retinopathy (DR), e, diabetic macular edema (DME), f, vision-threatening DR (VTDR), and g, a positive control: cataract. Sample sizes (“N” for the number of visits and “n” for the number of positive visits), area under ROC (AUCs), and the p-value for the difference are provided in Supplementary Table 1. Empty panels indicate unavailable data in validation sets C and D. (*) Baseline characteristics models for validation sets A and B include self-reported age, sex, race/ethnicity and years with diabetes and were trained on the training dataset. (+) The baseline characteristics models for validation sets C and D use self-reported age and sex and were trained directly on validation sets C and D due to large differences in patient population compared to the development set. : prespecified primary prediction tasks.
Extended Data Fig. 4
Extended Data Fig. 4. Saliency analysis illustrating the influence of various regions of the image towards the prediction.
a-g, Figures are generated in the same manner as in Fig. 3, but with different saliency methods: Integrated Gradients on the left, and guided backpropagation on the right. h-i, Quantifying the pixel intensity in the averaged saliency heatmaps. : prespecified primary prediction tasks.

Comment in

  • Eyeing severe diabetes upfront.
    Teo ZL, Ting DSW. Teo ZL, et al. Nat Biomed Eng. 2022 Dec;6(12):1321-1322. doi: 10.1038/s41551-022-00879-1. Nat Biomed Eng. 2022. PMID: 35411115 No abstract available.

Similar articles

Cited by

References

    1. Poplin R, et al. Prediction of cardiovascular risk factors from retinal fundus photographs via deep learning. Nat. Biomed. Eng. 2018;2:158–164. doi: 10.1038/s41551-018-0195-0. - DOI - PubMed
    1. Cheung, C. Y. et al. A deep-learning system for the assessment of cardiovascular disease risk via the measurement of retinal-vessel calibre. Nat. Biomed. Eng. 10.1038/s41551-020-00626-4 (2020). - PubMed
    1. Mitani A, et al. Detection of anaemia from retinal fundus images via deep learning. Nat. Biomed. Eng. 2020;4:18–27. doi: 10.1038/s41551-019-0487-z. - DOI - PubMed
    1. Sabanayagam C, et al. A deep-learning algorithm to detect chronic kidney disease from retinal photographs in community-based populations. Lancet Digit. Health. 2020;2:e295–e302. doi: 10.1016/S2589-7500(20)30063-7. - DOI - PubMed
    1. Rim TH, et al. Prediction of systemic biomarkers from retinal photographs: development and validation of deep-learning algorithms. Lancet Digit. Health. 2020;2:e526–e536. doi: 10.1016/S2589-7500(20)30216-8. - DOI - PubMed

Publication types