. 2022 Oct;43(10):2696-2708.
doi: 10.1038/s41401-022-00897-4. Epub 2022 Mar 29.

Pan-KRAS inhibitors suppress proliferation through feedback regulation in pancreatic ductal adenocarcinoma

Affiliations

Pan-KRAS inhibitors suppress proliferation through feedback regulation in pancreatic ductal adenocarcinoma

Cheng-Xiang Wang et al. Acta Pharmacol Sin. 2022 Oct.

Abstract

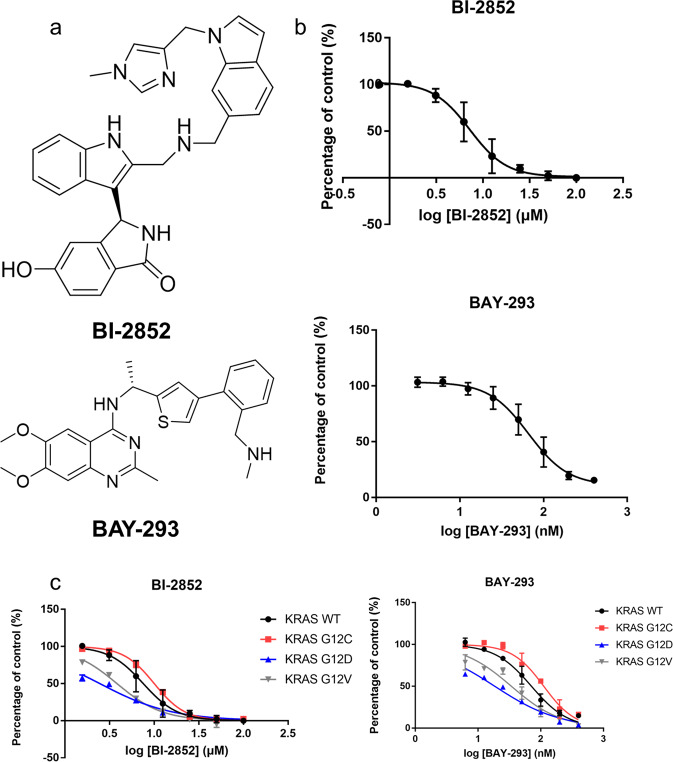
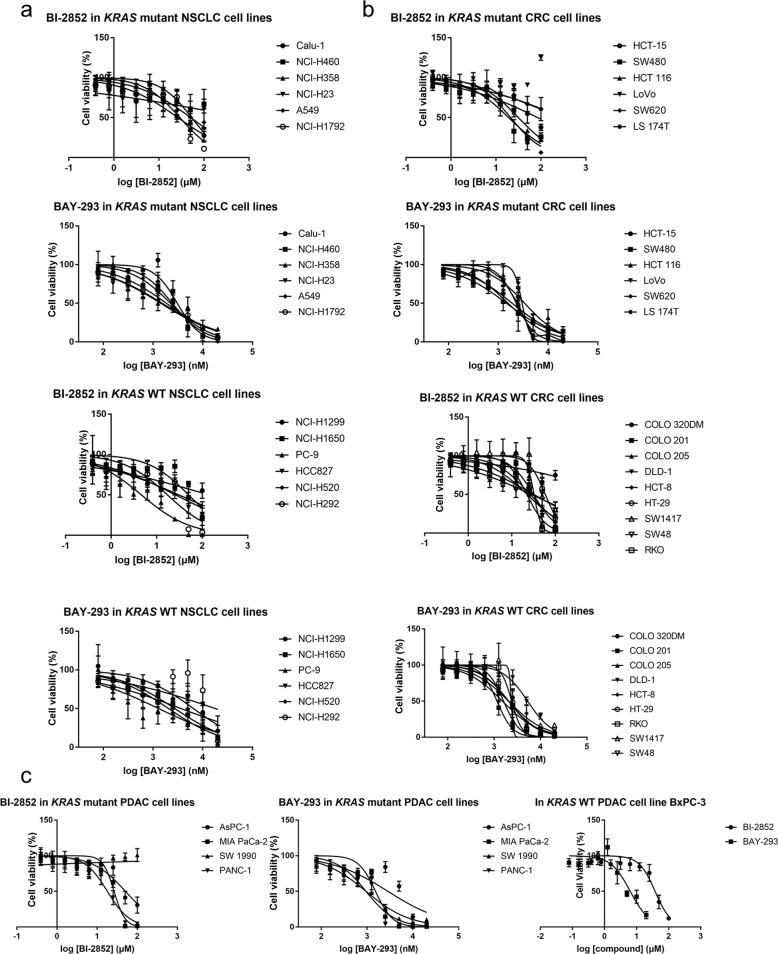
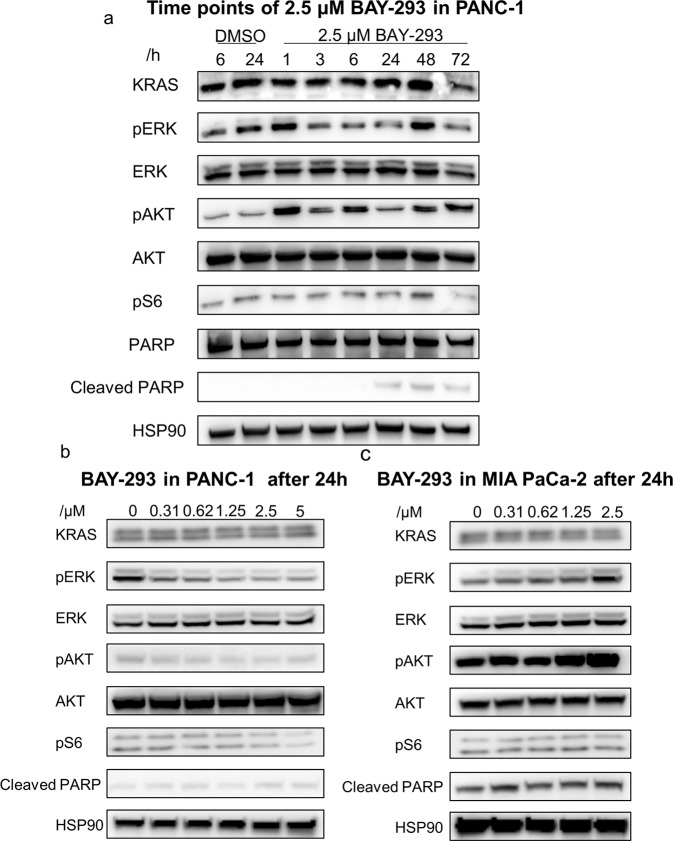
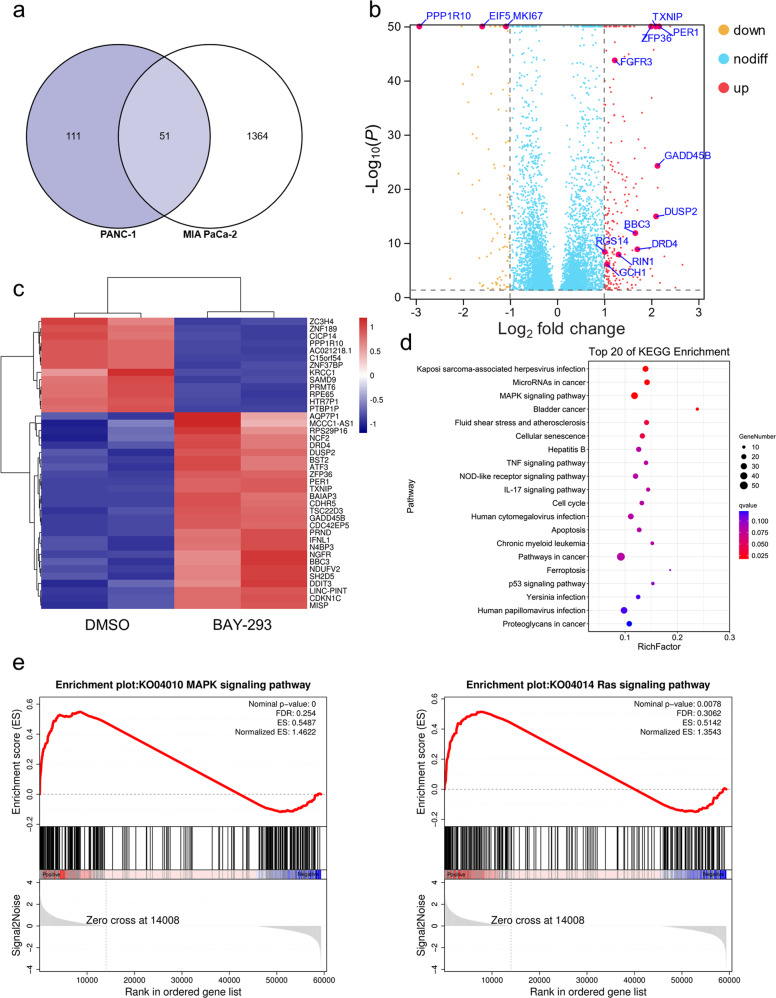
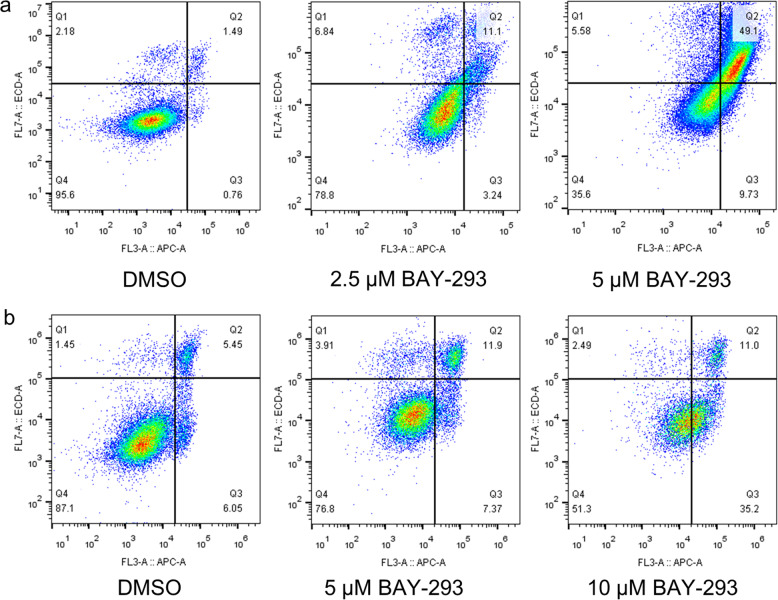
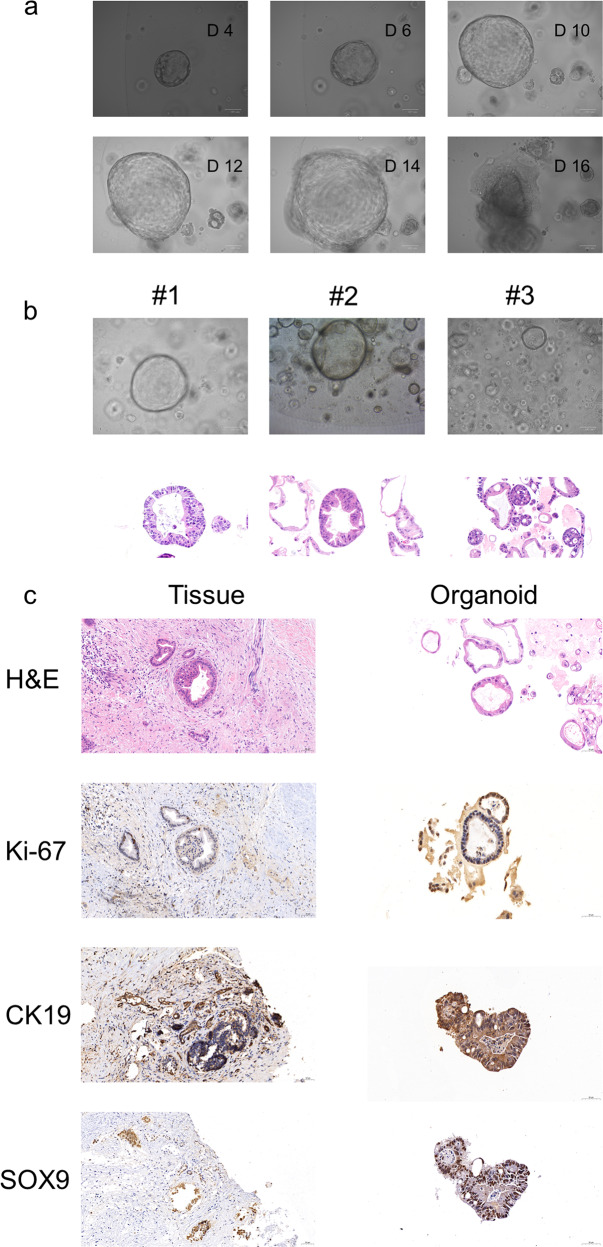
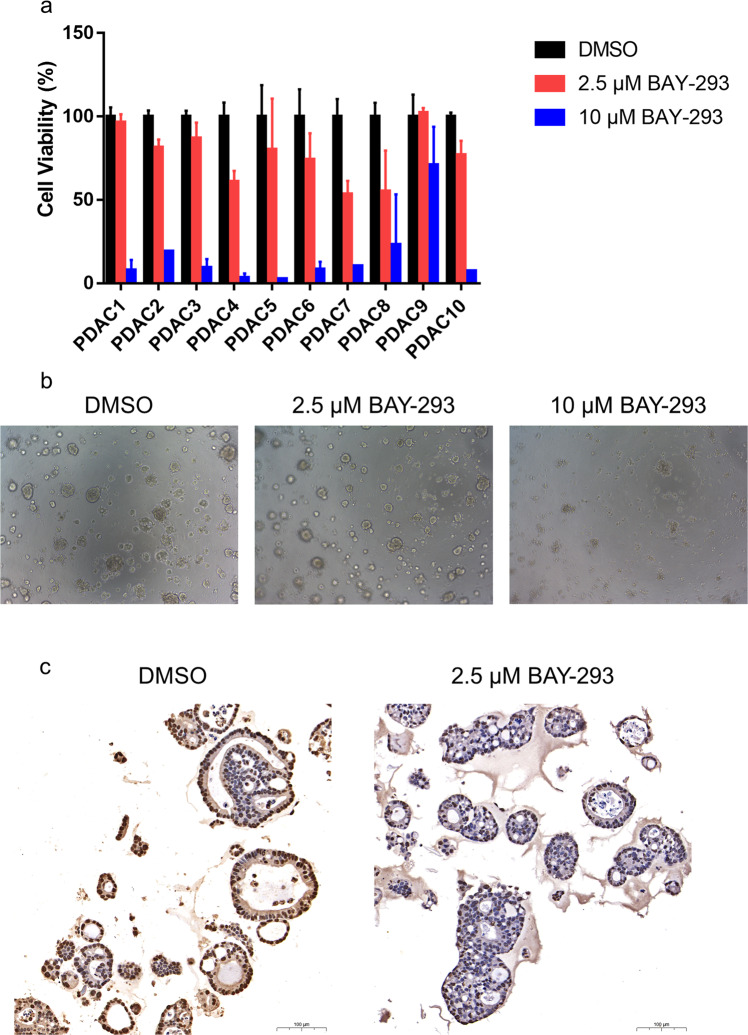
Pancreatic ductal adenocarcinoma (PDAC) is currently one of the most lethal cancers worldwide. Several basic studies have confirmed that Kirsten rat sarcoma virus (KRAS) is a key driver gene for the occurrence of PDAC, and KRAS mutations have also been found in most patients in clinical studies. In this study, two pan-KRAS inhibitors, BI-2852 and BAY-293, were chosen as chemical probes to investigate their antitumor potency in PDAC. Their inhibitory effects on KRAS activation were validated in vitro and their antiproliferative potency in PDAC cell lines were profiled, with half-maximal inhibitory concentration (IC50) values of approximately 1 μM, demonstrating the therapeutic potential of pan-KRAS inhibitors in the treatment of PDAC. However, feedback regulation in the KRAS pathway weakened inhibitor activity, which was observed by a 50 times difference in BAY-293 from in vitro activity. Furthermore, pan-KRAS inhibitors effectively inhibited cell proliferation in 3D organoids cultured from PDAC patient samples; however, there were some variations between individuals. These results provide a sufficient theoretical foundation for KRAS as a clinical therapeutic target and for the application of pan-KRAS inhibitors in the treatment of PDAC, with important scientific significance in translational medicine.

Keywords: BAY-293; KRAS; driver gene; organoid; pancreatic ductal adenocarcinoma.


Conflict of interest statement

The authors declare no competing interests.

Figures

Fig. 1
Fig. 1. BI-2852 and BAY-293 inhibited the activation of Kirsten rat sarcoma virus (KRAS) mediated by SOS1.
a Chemical structures of BI-2852 (top) and BAY-293 (bottom). b Concentration-dependent inhibitory effects of BI-2852 (up) and BAY-293 (down) on the activation of KRASWT mediated by SOS1, assessed using nucleotide exchange assay. Data are shown as mean ± SD from three independent experiments. c Concentration-dependent inhibition effects of BI-2852 (left) and BAY-293 (right) on the activation of KRAS variants mediated by SOS1, assessed by nucleotide exchange assay. Data are shown as mean ± SD from two or three independent experiments. The color key for the KRAS variant is shown.
Fig. 2
Fig. 2. BAY-293 slightly inhibited proliferation of Kirsten rat sarcoma virus (KRAS)-driven cancer cells in 2D culture.
a MIA PaCa-2 cells were labeled with 5 μM and cultured in Dulbecco’s Modified Eagle’s Medium (DMEM) supplemented with 2% (left) or 10% fetal bovine serum (FBS) (right) and treated with dimethyl sulfoxide (DMSO) or BAY-293 for 4 day. The red peak represents cells analyzed immediately after labeling, the dark green peak represents cells treated with 5 μM BAY-293, the light green peak represents cells treated with 2.5 μM BAY-293, the orange peak represents cells treated with 1.25 μM BAY-293, and the blue peak represents cells treated with DMSO. b PANC-1 cells labeled with 5 μM were cultured in DMEM medium supplemented with 2% (left) or 10% FBS (right) and treated with DMSO or BAY-293 for 5 day. The red peak represents cells analyzed immediately after labeling, the dark green peak represents cells treated with 10 μM BAY-293, the light green peak represents cells treated with 5 μM BAY-293, the orange peak represents cells treated with 2.5 μM BAY-293, and the blue peak represents cells treated with DMSO.
Fig. 3
Fig. 3. BI-2852 and BAY-293 inhibited proliferation of Kirsten rat sarcoma virus (KRAS)-driven cancer cells.
a Dose response of the viability of various KRAS WT or KRAS mutant non-small cell lung cancer)NSCLC) cell lines exposed to BI-2852 and BAY-293 cultured in 3D spheroids and low serum conditions for 6 days, and cell viability was determined using alamarBlue. The cell viability of the drug-treated groups was normalized to that of the corresponding positive control dimethyl sulfoxide (DMSO)-treated groups. The points indicate the mean ± s.e.m of three independent experiments. The symbol key for the NSCLC cell lines is shown. b Dose response of the viability of various KRAS WT or KRAS mutant colorectal cancer (CRC) cell lines exposed to BI-2852 and BAY-293 cultured in 3D spheroids and low serum conditions for 6 days, and cell viability was determined using alamarBlue. The cell viability of the drug-treated groups was normalized to that of the corresponding positive control DMSO-treated groups. The points indicate the mean ± s.e.m. of three independent experiments. The symbol key for the CRC cell lines is shown. c Dose response of the viability of various KRAS WT or KRAS mutant pancreatic ductal adenocarcinoma (PDAC) cell lines exposed to BI-2852 and BAY-293 cultured in 3D spheroids and low serum conditions for 6 days, and cell viability was determined using alamarBlue. The cell viability of the drug-treated groups was normalized to that of the corresponding positive control DMSO-treated groups. The points indicate the mean ± s.e.m. of three independent experiments. The symbol key for the PDAC cell lines is shown.
Fig. 4
Fig. 4. BAY-293 regulated Kirsten rat sarcoma virus (KRAS) signaling pathway.
a Western blot analysis of KRAS signaling pathway targets in PANC-1 cells treated from 1 h to 72 h with BAY-293 at 2.5 μmol/L. HSP90 was used as a loading control. b Western blot analyses of KRAS signaling pathway targets in PANC-1 cells treated for 24 h with BAY-293 over a 5-point dose response. HSP90 was used as a loading control. c Western blot analyses of KRAS signaling pathway targets in MIA PaCa-2 cells treated for 24 h with BAY-293 over a 4-point dose response. HSP90 was used as a loading control.
Fig. 5
Fig. 5. BAY-293 induced feedback regulations in pancreatic ductal adenocarcinoma (PDAC).
a Venn diagram illustrating the overlap of differentially expressed genes (DEGs) between PANC-1 cells treated with 5 μM BAY-293 versus dimethyl sulfoxide (DMSO) and MIA PaCa-2 cells treated with 2.5 μM BAY-293 versus DMSO with FDR < 0.05. b Volcano plots displaying differentially expressed genes in MIA PaCa-2 cells 48 h after treatment with DMSO or 2.5 μM BAY-293. Significance is denoted in the legend (FDR < 0.01). c Hierarchical clustering of the top 40 differentially regulated genes (FDR < 0.05) following treatment with BAY-293 (2.5 μM) or DMSO for 48 h. Two independent biological replicates per group. d The Kyoto Encyclopedia of Genes and Genomes (KEGG) pathway enrichment analysis performed on MIA PaCa-2 cells treated with BAY-293 (2.5 μM). Top 20 KEGG enrichment pathways. e GSEA plots showing representative gene set enrichment analyses (nominal P < 0.01) following BAY-293 treatment.
Fig. 6
Fig. 6. BAY-293 promoted pancreatic ductal adenocarcinoma (PDAC) cell apoptosis.
a MIA PaCa-2 cells were cultured in 2% fetal bovine serum (FBS) and exposed to BAY-293 (0, 2.5, and 5 μM) for 48 h, and Annexin V-APC/propidium iodide (PI) staining analysis was conducted to evaluate the percentage of apoptotic cells using flow cytometry. b PANC-1 cells were cultured in 2% FBS and exposed to BAY-293 (0, 5, and 10 μM) for 48 h, and Annexin V-APC/PI staining analysis was conducted to evaluate the percentage of apoptotic cells using flow cytometry.
Fig. 7
Fig. 7. Modeling human pancreatic ductal adenocarcinoma (PDAC) with patient-derived organoids.
a Time-lapse imaging sequence of the PADC#1 organoids. Representative images (20× objective magnification) are shown. Scale bars, 100 µm. b Microscopy and hematoxylin and eosin (H&E) staining images of PDAC #1, #2, and #3. Representative images (microscopy image, ×10 magnification; H&E staining images, 40× objective magnification) are shown. Scale bars, 100 µm. c H&E and immunohistochemistry images of Ki-67, CK19, and SOX9 staining in tumor organoids and matched primary tumors. Representative images (Tissue, 20× objective magnification; Organoids, 30× objective magnification) are shown. Scale bars, 50 µm.
Fig. 8
Fig. 8. BAY-293 inhibited cell growth of pancreatic ductal adenocarcinoma (PDAC) patient-derived organoids.
a Cell viability assay results of PDAC organoid cultures treated with dimethyl sulfoxide (DMSO), 2.5 µM BAY-293, or 10 µM BAY-293 for 6 days. The results were normalized to those of DMSO-treated organoids. The color key for drug concentration is shown. b Representative images (10× objective magnification) of PDAC organoid cultures treated with DMSO, 2.5 µM BAY-293, or 10 µM BAY-293 for 6 days. c Immunohistochemistry image (15× objective magnification) of Ki-67 staining in PDAC organoid cultures treated with DMSO or 2.5 µM BAY-293. Scale bars, 100 µm.

Similar articles

Cited by

References

    1. Ekbom A, McLaughlin JK, Karlsson B-M, Nyrén O, Gridley G, Adami H-O, et al. Pancreatitis and pancreatic cancer: a population-based study. JNCI: J Natl Cancer Inst. 1994;86:625–7. doi: 10.1093/jnci/86.8.625. - DOI - PubMed
    1. Kleeff J, Korc M, Apte M, La Vecchia C, Johnson CD, Biankin AV, et al. Pancreatic cancer. Nat Rev Dis Prim. 2016;2:16022. doi: 10.1038/nrdp.2016.22. - DOI - PubMed
    1. Siegel RL, Miller KD, Fuchs HE, Jemal A. Cancer statistics, 2021. CA Cancer J Clin. 2021;71:7–33. doi: 10.3322/caac.21654. - DOI - PubMed
    1. Neoptolemos JP, Kleeff J, Michl P, Costello E, Greenhalf W, Palmer DH. Therapeutic developments in pancreatic cancer: current and future perspectives. Nat Rev Gastroenterol Hepatol. 2018;15:333–48.. doi: 10.1038/s41575-018-0005-x. - DOI - PubMed
    1. Conroy T, Hammel P, Hebbar M, Ben Abdelghani M, Wei AC, Raoul JL, et al. FOLFIRINOX or gemcitabine as adjuvant therapy for pancreatic cancer. N Engl J Med. 2018;379:2395–406.. doi: 10.1056/NEJMoa1809775. - DOI - PubMed

MeSH terms