

Beta-Hydroxybutyrate Suppresses Hepatic Production of the Ghrelin Receptor Antagonist LEAP2
- PMID: 35352108
- PMCID: PMC9119693
- DOI: 10.1210/endocr/bqac038
Beta-Hydroxybutyrate Suppresses Hepatic Production of the Ghrelin Receptor Antagonist LEAP2
Abstract
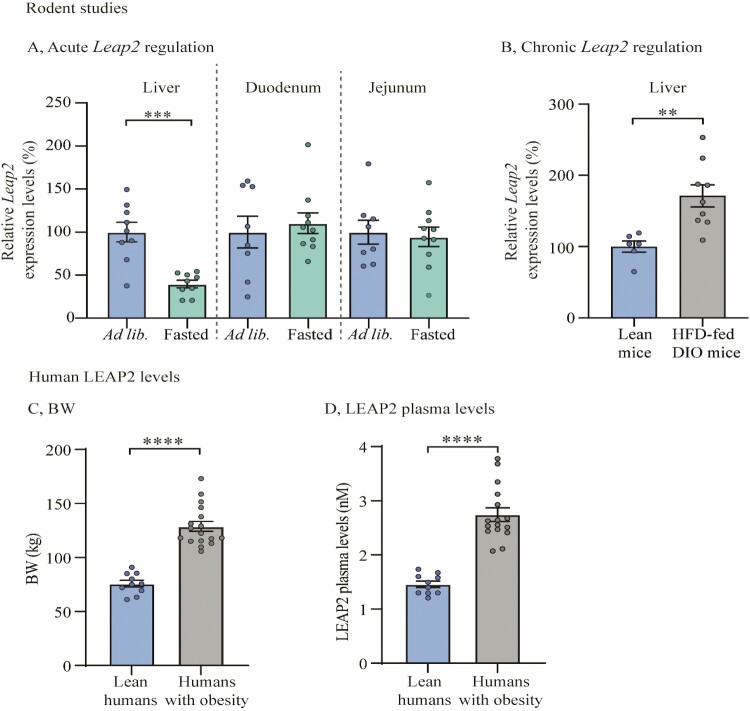
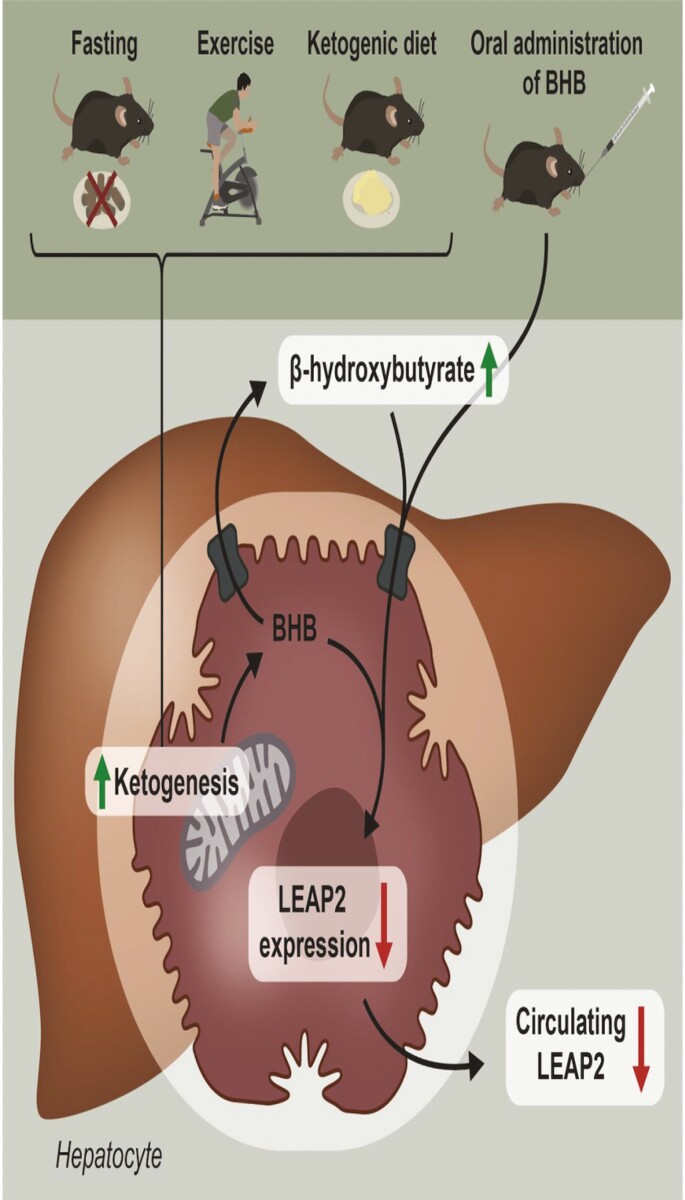
Introduction: Liver-expressed antimicrobial peptide-2 (LEAP2) is an endogenous ghrelin receptor antagonist, which is upregulated in the fed state and downregulated during fasting. We hypothesized that the ketone body beta-hydroxybutyrate (BHB) is involved in the downregulation of LEAP2 during conditions with high circulating levels of BHB.
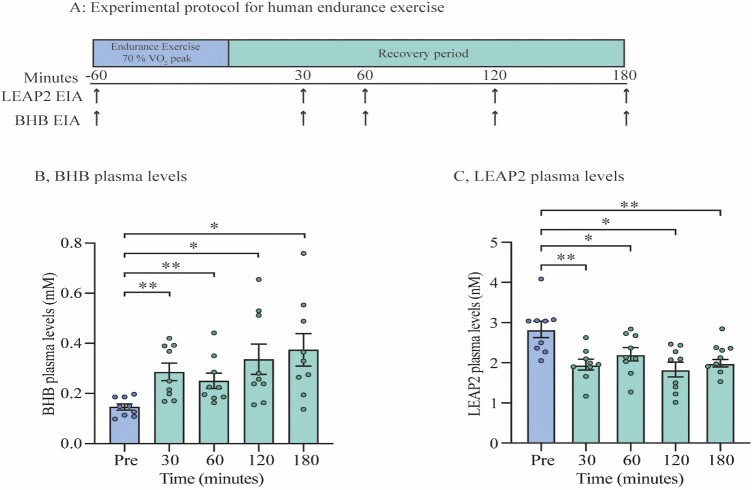
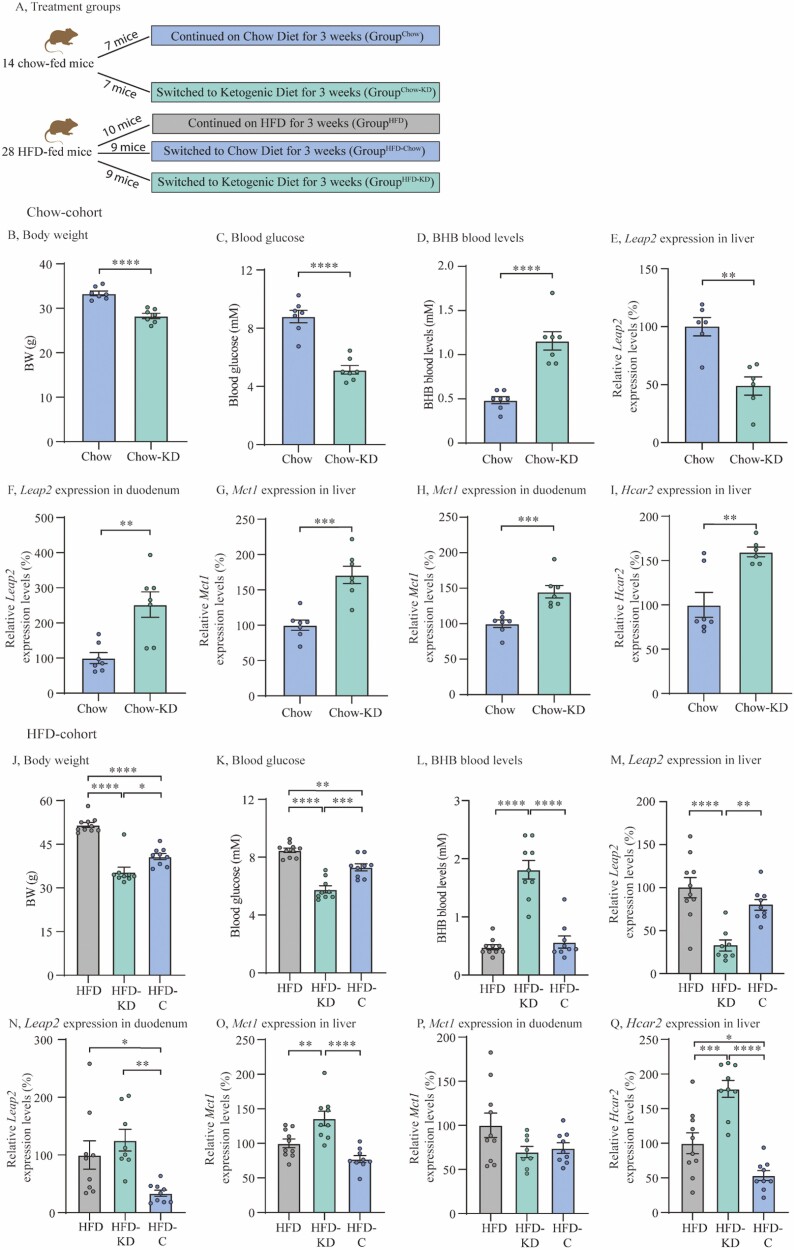
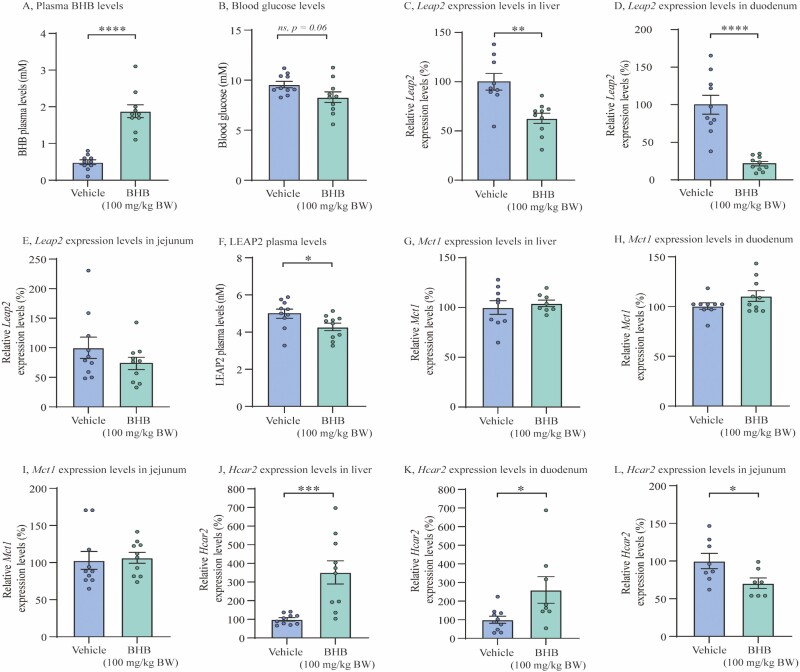
Methods: Hepatic and intestinal Leap2 expression were determined in 3 groups of mice with increasing circulating levels of BHB: prolonged fasting, prolonged ketogenic diet, and oral BHB treatment. LEAP2 levels were measured in lean and obese individuals, in human individuals following endurance exercise, and in mice after BHB treatment. Lastly, we investigated Leap2 expression in isolated murine hepatocytes challenged with BHB.
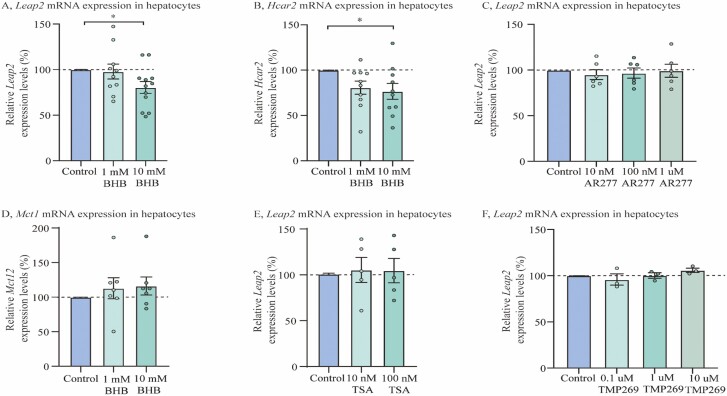
Results: We confirmed increased circulating LEAP2 levels in individuals with obesity compared to lean individuals. The recovery period after endurance exercise was associated with increased plasma levels of BHB levels and decreased LEAP2 levels in humans. Leap2 expression was selectively decreased in the liver after fasting and after exposure to a ketogenic diet for 3 weeks. Importantly, we found that oral administration of BHB increased circulating levels of BHB in mice and decreased Leap2 expression levels and circulating LEAP2 plasma levels, as did Leap2 expression after direct exposure to BHB in isolated murine hepatocytes.
Conclusion: From our data, we suggest that LEAP2 is downregulated during different states of energy deprivation in both humans and rodents. Furthermore, we here provide evidence that the ketone body, BHB, which is highly upregulated during fasting metabolism, directly downregulates LEAP2 levels. This may be relevant in ghrelin receptor-induced hunger signaling during energy deprivation.
Keywords: LEAP2; energy deprivation; exercise; ketogenic diet; ketone bodies.
© The Author(s) 2022. Published by Oxford University Press on behalf of the Endocrine Society.
Figures
Similar articles
-
Ghrelin-LEAP2 interactions along the stomach-liver axis.Endocr J. 2025 Apr 1;72(4):341-353. doi: 10.1507/endocrj.EJ24-0543. Epub 2024 Dec 27. Endocr J. 2025. PMID: 39756956 Free PMC article. Review.
-
LEAP2 deletion in mice enhances ghrelin's actions as an orexigen and growth hormone secretagogue.Mol Metab. 2021 Nov;53:101327. doi: 10.1016/j.molmet.2021.101327. Epub 2021 Aug 21. Mol Metab. 2021. PMID: 34428557 Free PMC article.
-
Liver-expressed antimicrobial peptide 2 is a hepatokine regulated by ghrelin, nutrients, and body weight.Sci Rep. 2024 Oct 21;14(1):24782. doi: 10.1038/s41598-024-74048-6. Sci Rep. 2024. PMID: 39433849 Free PMC article.
-
GHSR controls food deprivation-induced activation of CRF neurons of the hypothalamic paraventricular nucleus in a LEAP2-dependent manner.Cell Mol Life Sci. 2022 May 4;79(5):277. doi: 10.1007/s00018-022-04302-5. Cell Mol Life Sci. 2022. PMID: 35504998 Free PMC article.
-
Critical Insights Into LEAP2 Biology and Physiological Functions: Potential Roles Beyond Ghrelin Antagonism.Endocrinology. 2025 Jan 6;166(2):bqaf011. doi: 10.1210/endocr/bqaf011. Endocrinology. 2025. PMID: 39823403 Review.
Cited by
-
Ghrelin-LEAP2 interactions along the stomach-liver axis.Endocr J. 2025 Apr 1;72(4):341-353. doi: 10.1507/endocrj.EJ24-0543. Epub 2024 Dec 27. Endocr J. 2025. PMID: 39756956 Free PMC article. Review.
-
[Correlation between serum ghrelin and liver-expressed antimicrobial peptide-2 with idiopathic short stature in children].Zhongguo Dang Dai Er Ke Za Zhi. 2024 Dec 15;26(12):1261-1266. doi: 10.7499/j.issn.1008-8830.2404038. Zhongguo Dang Dai Er Ke Za Zhi. 2024. PMID: 39725387 Free PMC article. Chinese.
-
Postprandial Increases in Liver-Gut Hormone LEAP2 Correlate with Attenuated Eating Behavior in Adults Without Obesity.J Endocr Soc. 2023 May 12;7(7):bvad061. doi: 10.1210/jendso/bvad061. eCollection 2023 Jun 5. J Endocr Soc. 2023. PMID: 37287649 Free PMC article.
-
Plasma LEAP2 concentration is associated with energy intake and postprandial insulin increase depending on meal size but not weight status in men.Diabetes Obes Metab. 2025 Aug;27(8):4427-4435. doi: 10.1111/dom.16483. Epub 2025 May 23. Diabetes Obes Metab. 2025. PMID: 40406913 Free PMC article.
-
Regulation of LEAP2 by insulin and glucagon in mice and humans.Cell Rep Med. 2025 Mar 18;6(3):101996. doi: 10.1016/j.xcrm.2025.101996. Epub 2025 Mar 7. Cell Rep Med. 2025. PMID: 40056903 Free PMC article.
References
-
- Small CJ, Bloom SR. Gut hormones and the control of appetite. Trends Endocrinol Metab. 2004;15(6):259–263. - PubMed
-
- Kojima M, Hosoda H, Date Y, Nakazato M, Matsuo H, Kangawa K. Ghrelin is a growth-hormone-releasing acylated peptide from stomach. Nature. 1999;402:656–660. - PubMed
-
- Andrews ZB. Central mechanisms involved in the orexigenic actions of ghrelin. Peptides. 2011;32(11):2248– 2255. - PubMed
