. 2022 Aug;45(8):1507-1520.
doi: 10.1007/s40618-022-01781-y. Epub 2022 Mar 29.

Role of nuclear factor of activated T cells in chondrogenesis osteogenesis and osteochondroma formation

Affiliations

Role of nuclear factor of activated T cells in chondrogenesis osteogenesis and osteochondroma formation

E Canalis et al. J Endocrinol Invest. 2022 Aug.

Abstract

Purpose: Nuclear factor of activated T cells (NFATc) are transcription factors that play a function in the immune response and in osteoclast differentiation. In the present work, we define the function of NFATc2 in chondrogenic and osteogenic cells.

Methods: Nfatc2loxP/loxP and Nfatc1loxP/loxP;Nfatc2loxP/loxP conditional mice were crossed with Prx1-Cre transgenics to inactivate Nfatc2 singly and with Nfatc1. Femurs and vertebrae were examined by microcomputed tomography (µCT) X-Ray images and histology and analyzed for the presence of osteochondromas.

Results: µCT demonstrated that Prx1-Cre;Nfatc2∆/∆ female mice had transient osteopenia and male mice did not have a cancellous or a cortical bone phenotype when compared to control mice. In contrast, the dual inactivation of Nfatc1 and Nfatc2 in Prx1-expressing cells resulted in cancellous osteopenia and small bones at 1 month of age in both sexes. Nfatc1;Nfatc2 deleted mice exhibited a ~ 50% decrease in bone volume and connectivity. Total bone area, periosteal and endocortical bone perimeters and femoral length were reduced indicating smaller bones. As the mice matured, the shortening of the femoral length persisted, but the osteopenic phenotype resolved and cancellous femoral bone of 4-month-old Nfatc1;Nfatc2 deleted mice was not different from controls although male mice had vertebral osteopenia. In addition, Nfatc1;Nfatc2 deleted mice displayed distortion of the distal metaphysis and, as they matured, the articular presence of mineralized tumors with the appearance of osteochondromas.

Conclusion: Our studies reveal that NFATc1 and NFATc2 are necessary for optimal bone homeostasis and the suppression of osteochondroma formation.

Keywords: Chondrocytes; NFATc1; NFATc2; Osteoblasts; Osteochondroma; Skeletal homeostasis.


Conflict of interest statement

Conflicts of interest: The authors declare no conflicts of interest with the contents of this article.

Figures

Figure 1.
Figure 1.
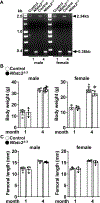
Weight, femoral length and documentation of DNA recombination of the Nfatc2 allele by Prx1 enhancer driven Cre. (A) DNA from calvariae obtained from Prx1-Cre;Nfatc2Δ/Δ mice and from their respective Nfatc2loxP/loxP controls was isolated. Cre-dependent DNA recombination was demonstrated by gel electrophoresis of PCR amplification products obtained with primers for the Nfatc2Δ alleles. The arrow heads indicate the position of the 2.3 kilobase (kb) amplicon verifying the Nfatc2loxP allele, and the 0.36 kb amplicon verifying the Nfatc2Δ allele. (B) Body weight and (C) femoral length of 1 and 4 month old Prx1-Cre;Nfatc2Δ/Δ and sex-matched control Nfatc2loxP/loxP littermates. Values for male mice are n = 4 to 6 control and n = 4 to 11 Nfatc2Δ/Δ. Values for female mice are n = 3 to 6 control and n = 5 Nfatc2∆/∆.
Figure 2.
Figure 2.
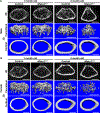
Representative microcomputed tomography images in 2 and 3 dimensions (2D and 3D) of distal trabecular bone and midshaft cortical bone of femurs from 1 and 4 month old Prx1-Cre;Nfatc2Δ/Δ mice and littermate controls. Bars in the right corner represent 1 mm for 2D and 3D cancellous and 0.5 mm for 3D cortical bone images. Note triangular shape of distal metaphysis in 2 dimensional (2D) cross sectional images from 4 month old male and female mice Prx1-Cre;Nfatc2Δ/Δ (right upper panels).
Figure 3.
Figure 3.
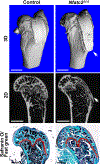
Representative images in 2 and 3 dimensions (2D and 3D) of femoral microcomputed topography (µCT) and tissue sections of femurs stained with safranin O and fast green from 4 month old Prx1-Cre; Nfatc2∆/∆ male mice and control littermates. Arrows indicate osteochondroma-appearing lesions. Bars in µCT images represent 1 mm and in histology 0.5 mm.
Figure 4.
Figure 4.
Weight, femoral length and documentation of DNA recombination of the Nfatc1 and Nfatc2 alleles by Prx1 enhancer driven Cre. (A) DNA from tibiae obtained from Prx1-Cre;Nfatc1Δ/Δ;Nfatc2Δ/Δ mice and Nfatc1loxP/loxP;Nfatc2loxP/loxP controls was isolated. Cre-dependent DNA recombination was demonstrated by gel electrophoresis of PCR amplification products obtained with primers for the Nfatc1loxP and Nfatc1 (left panel) and Nfatc2loxP and Nfatc2Δ (right panel) alleles. On the left panel, the arrow head indicates the position of the 410 base pair (bp) amplicon verifying the Nfatc1loxP allele and the arrow indicates the 510 bp amplicon verifying the Nfatc1Δ allele. On the right panel, the arrow head indicates the 2.3 kilobase (kb) amplicon verifying the Nfatc2loxP allele, and the arrow indicates the 0.36 kb amplicon verifying the Nfatc2Δ allele. (B) Body weight and (C) femoral length of Prx1-Cre;Nfatc1Δ/Δ;Nfatc2Δ/Δ and sex-matched control Nfatc1loxP/loxP;Nfatc2loxP/loxP littermates. Values for male mice are n = 4 to 8 control and n = 4 to 5 Nfatc1Δ/Δ;Nfatc2Δ/Δ. Values for female mice are n = 4 to 11 control and n = 2 to 6 Nfatc1∆/∆;Nfatc2∆/∆.
Figure 5.
Figure 5.
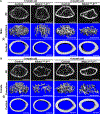
Representative microcomputed tomography images in 2 and 3 dimensions (2D and 3D) of distal trabecular bone and midshaft cortical bone of femurs from 1 and 4 month old Prx1-Cre;Nfatc1Δ/Δ;Nfatc2Δ/Δ mice and littermate controls. Bars in the right corner represent 1 mm for 2D and 3D cancellous and 0.5 mm for 3D cortical bone images. Note distortion of distal metaphysis in 2D cross sectional images from 1 and 4 month old male and female Prx1-Cre;Nfatc1Δ/Δ;Nfatc2Δ/Δ (right upper panels).
Figure 6.
Figure 6.
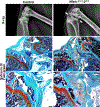
Representative images of X-Rays and histology from 8 month and 4 month old, respectively, Prx1-Cre;Nfatc1∆/∆;Nfatc2∆/∆ mice and control littermates. Sections were stained with safranin O and fast green. Arrows point to calcified osteochondroma like lesions. Bars in the right corner represents 200 µm for middle panels and 100 µm for lower panels. Framed area demonstrates increased cartilaginous tissue in Prx1-Cre;Nfatc1∆/∆;Nfatc2∆/∆ mice.

References

    1. Crabtree GR, Olson EN(2002) NFAT signaling: choreographing the social lives of cells. Cell 109 Suppl:S67–S79. - PubMed
    1. Sitara D, Aliprantis AO (2010) Transcriptional regulation of bone and joint remodeling by NFAT. Immunol Rev 233:286–300. - PMC - PubMed
    1. Graef IA, Chen F, Crabtree GR (2001) NFAT signaling in vertebrate development. Curr Opin Genet Dev 11:505–512. - PubMed
    1. Aliprantis AO, Ueki Y, Sulyanto R, Park A, Sigrist KS, Sharma SM, Ostrowski MC, Olsen BR, Glimcher LH (2008) NFATc1 in mice represses osteoprotegerin during osteoclastogenesis and dissociates systemic osteopenia from inflammation in cherubism. J Clin Invest 118:3775–3789. - PMC - PubMed
    1. Ikeda F, Nishimura R, Matsubara T, Hata K, Reddy SV, Yoneda T (2006) Activation of NFAT signal in vivo leads to osteopenia associated with increased osteoclastogenesis and bone-resorbing activity. J Immunol 177:2384–2390. - PubMed

Substances