Identification and validation of a seven-gene prognostic marker in colon cancer based on single-cell transcriptome analysis
- PMID: 35352485
- PMCID: PMC8965382
- DOI: 10.1049/syb2.12041
Identification and validation of a seven-gene prognostic marker in colon cancer based on single-cell transcriptome analysis
Abstract
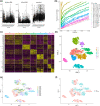
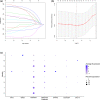
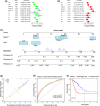
Colon cancer (CC) is one of the most commonly diagnosed tumours worldwide. Single-cell RNA sequencing (scRNA-seq) can accurately reflect the heterogeneity within and between tumour cells and identify important genes associated with cancer development and growth. In this study, scRNA-seq was used to identify reliable prognostic biomarkers in CC. ScRNA-seq data of CC before and after 5-fluorouracil treatment were first downloaded from the Gene Expression Omnibus database. The data were pre-processed, and dimensionality reduction was performed using principal component analysis and t-distributed stochastic neighbour embedding algorithms. Additionally, the transcriptome data, somatic variant data, and clinical reports of patients with CC were obtained from The Cancer Genome Atlas database. Seven key genes were identified using Cox regression analysis and the least absolute shrinkage and selection operator method to establish signatures associated with CC prognoses. The identified signatures were validated on independent datasets, and somatic mutations and potential oncogenic pathways were further explored. Based on these features, gene signatures, and other clinical variables, a more effective predictive model nomogram for patients with CC was constructed, and a decision curve analysis was performed to assess the utility of the nomogram. A prognostic signature consisting of seven prognostic-related genes, including CAV2, EREG, NGFRAP1, WBSCR22, SPINT2, CCDC28A, and BCL10, was constructed and validated. The proficiency and credibility of the signature were verified in both internal and external datasets, and the results showed that the seven-gene signature could effectively predict the prognosis of patients with CC under various clinical conditions. A nomogram was then constructed based on features such as the RiskScore, patients' age, neoplasm stage, and tumor (T), nodes (N), and metastases (M) classification, and the nomogram had good clinical utility. Higher RiskScores were associated with a higher tumour mutational burden, which was confirmed to be a prognostic risk factor. Gene set enrichment analysis showed that high-score groups were enriched in 'cytoplasmic DNA sensing', 'Extracellular matrix receptor interactions', and 'focal adhesion', and low-score groups were enriched in 'natural killer cell-mediated cytotoxicity', and 'T-cell receptor signalling pathways', among other pathways. A robust seven-gene marker for CC was identified based on scRNA-seq data and was validated in multiple independent cohort studies. These findings provide a new potential marker to predict the prognosis of patients with CC.
Keywords: colon cancer (CC); metastasis-associated genes; progression; single-cell RNA sequencing (scRNA-seq); the cancer genome atlas (TCGA); tumour mutational burden (TMB).
© 2022 The Authors. IET Systems Biology published by John Wiley & Sons Ltd on behalf of The Institution of Engineering and Technology.
Conflict of interest statement
The authors declare that they have no conflicts of interest.
Figures


References
-
- Sung, H. , et al.: Global cancer statistics 2020: GLOBOCAN estimates of incidence and mortality worldwide for 36 cancers in 185 countries. CA Cancer J. Clin. 71(3), 209–249 (2021) - PubMed
-
- Siegel, R.L. , et al.: Colorectal cancer statistics, 2020. CA Cancer J. Clin. 70(3), 145–164 (2020) - PubMed
-
- Cheng, L. , et al.: Trends in colorectal cancer incidence by anatomic site and disease stage in the United States from 1976 to 2005. Am. J. Clin. Oncol. 34(6), 573–580 (2011) - PubMed
-
- Longley, D.B. , Harkin, D.P. , Johnston, P.G. : 5‐fluorouracil: mechanisms of action and clinical strategies. Nat. Rev. Cancer. 3(5), 330–338 (2003) - PubMed
Publication types
MeSH terms
Substances
LinkOut - more resources
Full Text Sources
Research Materials

