. 2022 May 1;149(9):dev200136.
doi: 10.1242/dev.200136. Epub 2022 May 3.

Sequential action of JNK genes establishes the embryonic left-right axis

Affiliations

Sequential action of JNK genes establishes the embryonic left-right axis

Christopher J Derrick et al. Development. .

Abstract

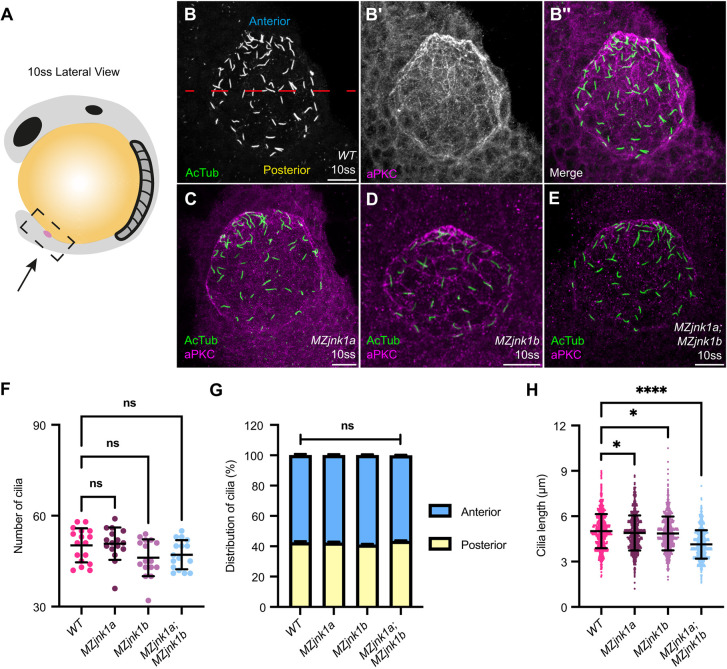
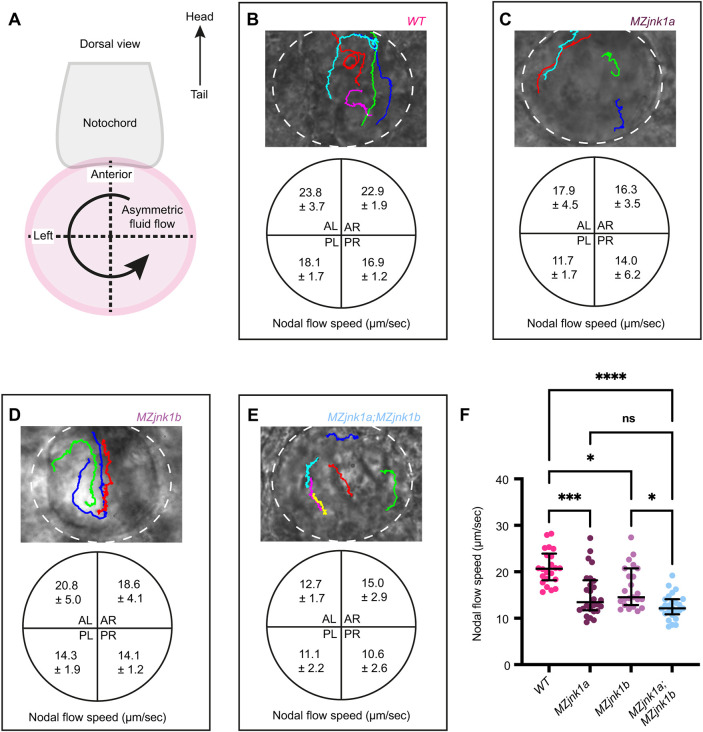
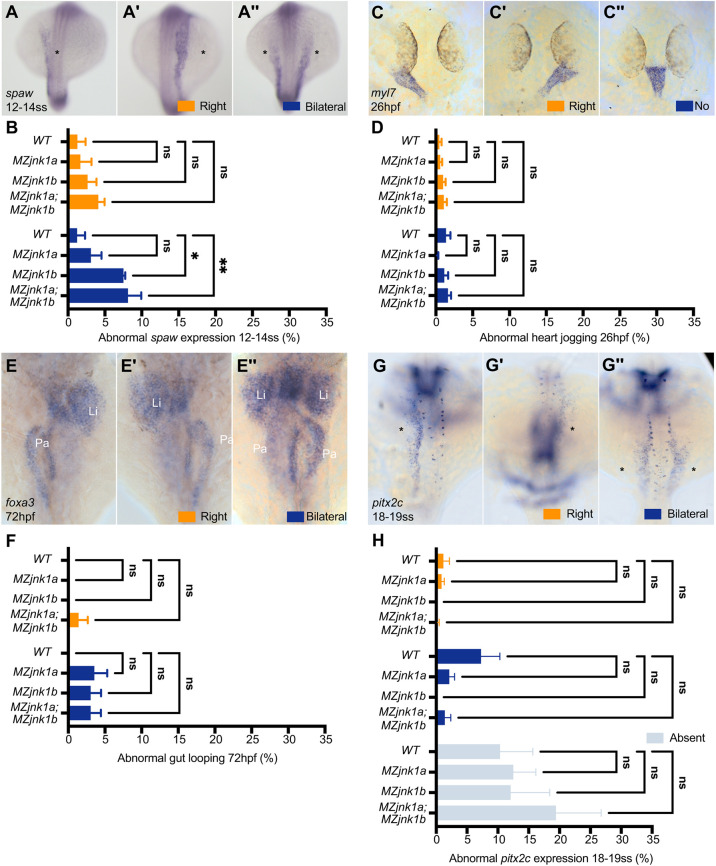
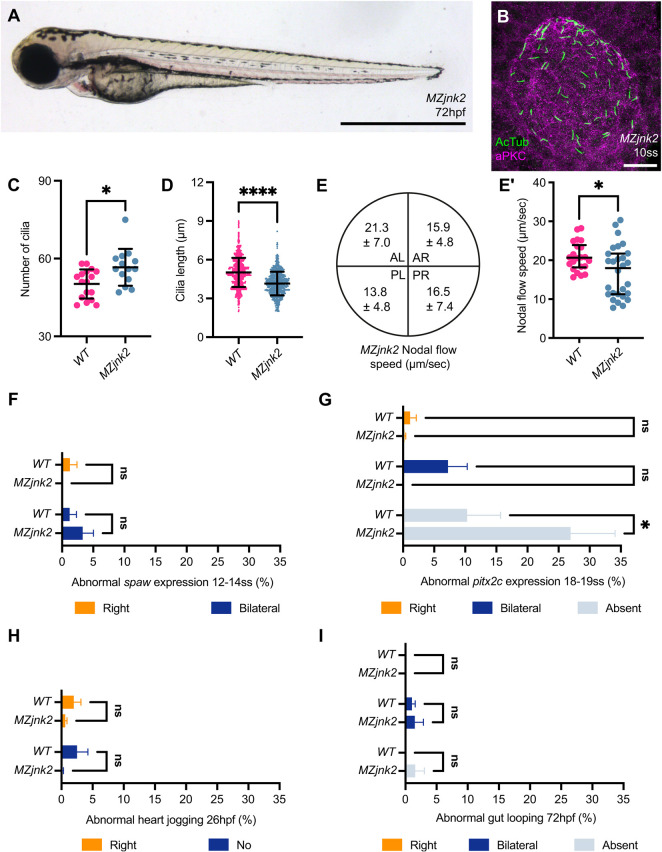
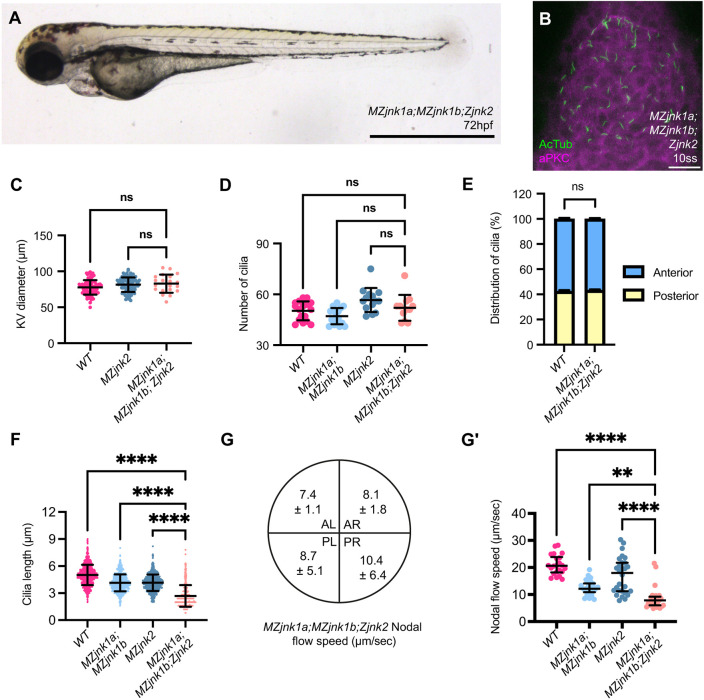
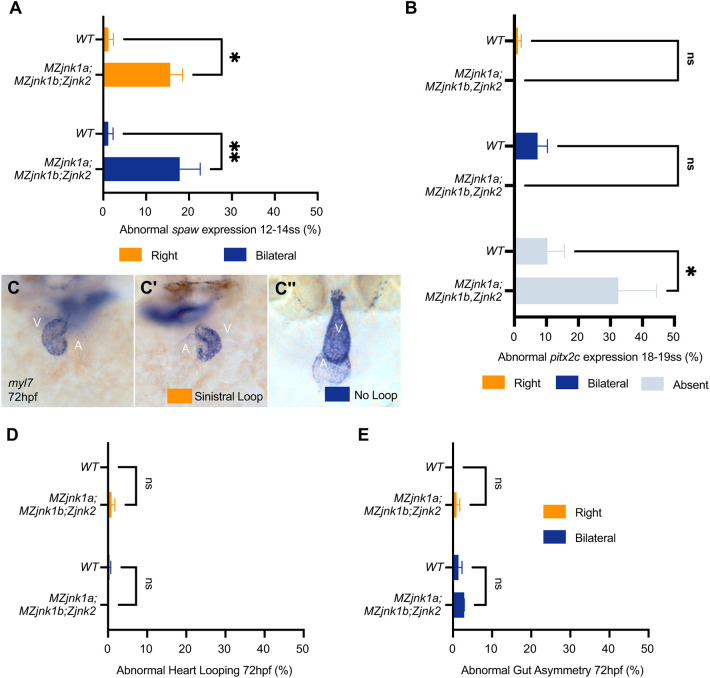
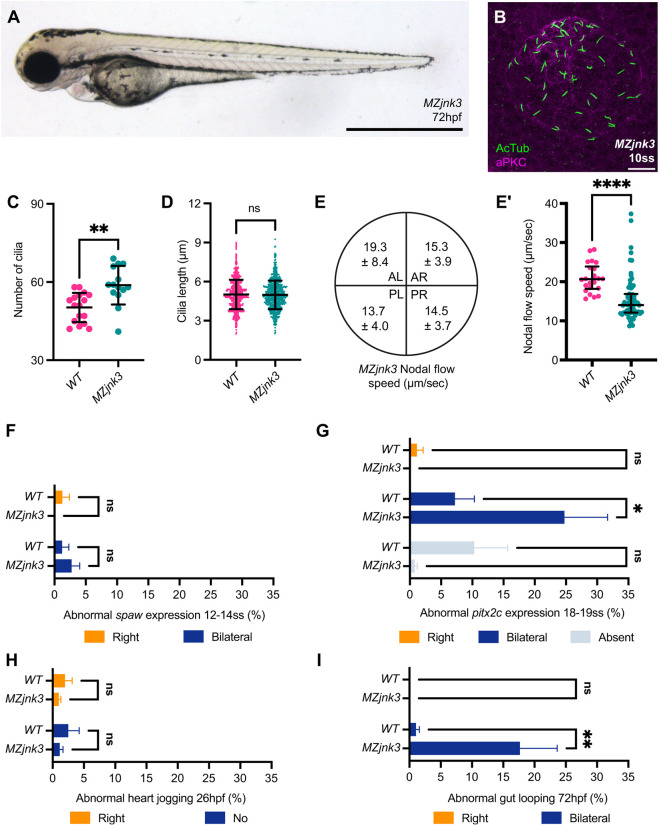
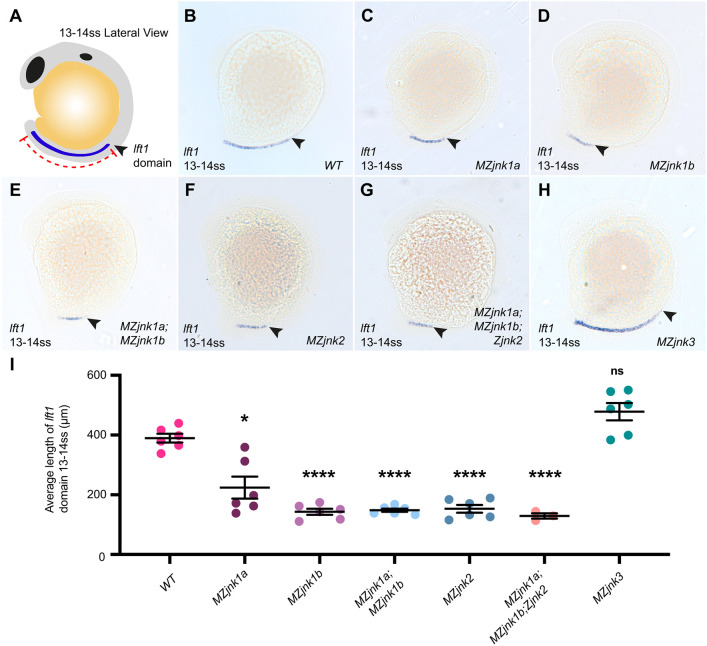
The establishment of the left-right axis is crucial for the placement, morphogenesis and function of internal organs. Left-right specification is proposed to be dependent on cilia-driven fluid flow in the embryonic node. Planar cell polarity (PCP) signalling is crucial for patterning of nodal cilia, yet downstream effectors driving this process remain elusive. We have examined the role of the JNK gene family, a proposed downstream component of PCP signalling, in the development and function of the zebrafish node. We show jnk1 and jnk2 specify length of nodal cilia, generate flow in the node and restrict southpaw to the left lateral plate mesoderm. Moreover, loss of asymmetric southpaw expression does not result in disturbances to asymmetric organ placement, supporting a model in which nodal flow may be dispensable for organ laterality. Later, jnk3 is required to restrict pitx2c expression to the left side and permit correct endodermal organ placement. This work uncovers multiple roles for the JNK gene family acting at different points during left-right axis establishment. It highlights extensive redundancy and indicates JNK activity is distinct from the PCP signalling pathway.

Keywords: Cilia; JNK; Kupffer's vesicle; Laterality; PCP; Zebrafish.


Conflict of interest statement

Competing interests The authors declare no competing or financial interests.

Figures

Fig. 1.
Fig. 1.
jnk1a and jnk1b function redundantly to regulate cilia length in the zebrafish left-right organiser. (A) Schematic of zebrafish embryo at the 10-somite stage (ss), lateral view. Kupffer's vesicle (KV, magenta) is located at the caudal tip of the notochord. The caudal region of the embryo imaged in B-E is outlined. (B,B′) Representative image of wild-type KV at 10 ss used for characterisation of cilial parameters by immunohistochemistry for acetylated tubulin with depiction of anterior (blue) and posterior (yellow) in KV (B) and aPKC (B′). (B″) Merged images. (C-E) Representative MZjnk1a (C), MZjnk1b (D) and MZjnk1a;MZjnk1b (E) KVs at 10 ss labelling acetylated tubulin (green) and aPKC (magenta). (F) Quantification of the number of cilia in KV in wild-type, MZjnk1a, MZjnk1b and MZjnk1a;MZjnk1b embryos at 10 ss. jnk1 mutants display no differences in the number of nodal cilia in KV. (G) Quantification of nodal cilia distribution in wild-type, MZjnk1a, MZjnk1b and MZjnk1a;MZjnk1b embryos at 10 ss. Antero-posterior distribution nodal cilia is unaffected in jnk1 mutants. (H) Quantification of length of nodal cilial in wild-type, MZjnk1a, MZjnk1b and MZjnk1a;MZjnk1b embryos at 10 ss. MZjnk1a and MZjnk1b mutant embryos display a similar significant reduction in cilia length. Loss of both jnk1a and jnk1b results in a more dramatic reduction in cilia length. (F) Data are mean±s.d., one-way ANOVA, multiple comparisons. Wild type, n=17; MZjnk1a, MZjnk1b and MZjnk1a;MZjnk1b, n=16. (G) Data are mean±s.e.m., two-way ANOVA, multiple comparisons, n=16. (H) Data are mean±s.d., one-way ANOVA, multiple comparisons. Wild type, n=809; MZjnk1a, n=812; MZjnk1b, n=743; MZjnk1a;MZjnk1b, n=754. ns, not significant; *P<0.05, ****P<0.0001. (B-E) Anterior is upwards, left is leftwards. Scale bars: 20 µm.
Fig. 2.
Fig. 2.
jnk1a and jnk1b are required for fluid flow in KV. (A) Schematic showing KV (magenta) at the base of the notochord (grey) and direction of nodal flow (arrow) at 10-14 ss. The notochord was used to define the antero-posterior and left-right axes for subdivision of KV into quadrants. (B-E) Representative bright-field images of wild type (B), MZjnk1a (C), MZjnk1b (D) and MZjnk1a;MZjnk1b KVs (white dotted line), and traces of bead trajectories over time (coloured lines), together with mean bead speed (µm/s) in each quadrant±s.d. (F) Quantification of average bead speed in KV between 10 and 14 ss. MZjnk1a and MZjnk1b mutant embryos have significantly slower average nodal flow compared with wild-type controls. Loss of both jnk1a and jnk1b results in a greater reduction in average speed. (F) Data are median±interquartile range, Kruskal-Wallis test, multiple comparisons. Wild type, n=22 beads across six embryos; MZjnk1a, n=26 beads across four embryos; MZjnk1b, n=23 beads across three embryos; MZjnk1a;MZjnk1b, n=25 beads across four embryos. (B-E) Anterior is upwards; left is leftwards. ns, not significant. *P<0.05, ***P<0.001, ****P<0.0001. AL, anterior left; AR, anterior right; PL, posterior left; PR, posterior right.
Fig. 3.
Fig. 3.
Loss of jnk1 disrupts Nodal signalling, but not organ asymmetry. (A-A″) Representative images of mRNA in situ hybridisation for the zebrafish Nodal homolog southpaw (spaw) at 12-14 ss, showing normal expression in the left lateral plate mesoderm (LPM) (A, asterisk), and abnormal right-sided (A′, asterisk) or bilateral (A″, asterisks) expression. (B) Characterisation of abnormal spaw expression in wild type, and in MZjnk1a, MZjnk1b and MZjnk1a;MZjnk1b mutants at 12-14 ss. MZjnk1b and MZjnk1a;MZjnk1b mutants display a significant increase in the percentage of embryos with bilateral spaw expression. Loss of jnk1a alone does not have a significant impact on spaw expression. (C-C″) Representative images of mRNA in situ hybridisation of the pan-cardiac marker myosin, light chain 7, regulatory (myl7) at 26 hpf showing normal left jogging of the heart (C), abnormal right jogging (C′) or no jogging (C″). (D) Quantification of jogging in wild type, and MZjnk1a, MZjnk1b and MZjnk1a;MZjnk1b mutants at 26 hpf. Loss of jnk1 does not affect heart jogging. (E-E″) Representative images of mRNA in situ hybridisation of the endodermal marker forkhead box A3 (foxa3) at 72 hpf showing organ placement of the liver (Li) and pancreas (Pa) following gut looping (E), reversed gut looping (E′) or a failure of LPM migration, resulting in a bilateral gut, most obviously observed by the presence of bilaterally positioned livers (E″). (F) Quantification of gut looping in wild type, and MZjnk1a, MZjnk1b and MZjnk1a;MZjnk1b mutants at 72 hpf. Loss of jnk1 does not affect endoderm morphogenesis. (G-G″) Representative images of mRNA in situ hybridisation of paired-liked homeodomain 2, isoform c (pitx2c) at 18-19 ss, showing normal expression in the left lateral plate mesoderm (F, asterisk), and abnormal right-sided (F′, asterisk) or bilateral (F″, asterisks) expression. (H) Characterisation of abnormal pitx2c expression in wild type, and MZjnk1a, MZjnk1b and MZjnk1a;MZjnk1b mutants at 18-19 ss. Loss of jnk1 does not result in abnormal expression of pitx2c. (B) Data are mean±s.e.m., two-way ANOVA comparison of right and bilateral. n=3 clutches. Minimum clutch sizes: wild type, n=27; MZjnk1a, n=21; MZjnk1b, n=27; MZjnk1a;MZjnk1b, n=17. (D) Data are mean±s.e.m., two-way ANOVA comparison of right jogging and no jogging. n=7 clutches for wild type, n=6 clutches for MZjnk1a, and n=8 clutches for MZjnk1b and MZjnk1a;MZjnk1b. Minimum clutch sizes: wild type, n=32; MZjnk1a, n=46; MZjnk1b, n=46; MZjnk1a;MZjnk1b, n=43. (F) Data are mean±s.e.m., two-way ANOVA comparison of right and bilateral. n=3 clutches. Minimum clutch sizes: wild type, n=25, MZjnk1a, n=16; MZjnk1b, n=21; MZjnk1a;MZjnk1b, n=22. (H) Data are mean±s.e.m., two-way ANOVA, multiple comparisons analysing right, bilateral and absent pitx2c expression. n=5 clutches. Minimum clutch sizes: wild type, n=75; MZjnk1a, n=73; MZjnk1b, n=64; MZjnk1a:MZjnk1b, n=37. (A-A″,C-C″,G-G″) Dorsal views. (E-E″) Ventral views. ns, not significant. *P<0.05, **P<0.01.
Fig. 4.
Fig. 4.
jnk2 regulates nodal cilia development and KV flow. (A) Representative bright-field image of MZjnk2 mutant at 3 dpf. (B) Representative MZjnk2 KV at 10 ss labelling acetylated tubulin (green) and aPKC (magenta). (C) Quantification of number of cilia in wild-type and MZjnk2 embryos at 10 ss. Loss of jnk2 results in a significant increase in the number of nodal cilia. (D) Quantification of length of nodal cilial in wild-type and MZjnk2 embryos at 10 ss. MZjnk2 mutant embryos have a significant reduction in the length of nodal cilia. (E,E′) Quantification of nodal flow speed in MZjnk2 by quadrant (μm/s; data are mean±s.d.) (E) and average speed (E′) between 10 and 14 ss. Loss of jnk2 results in a significant reduction in average speed (E′). (F) Loss of jnk2 does not impact normal spaw expression at 12-14 ss. (G) Characterisation of abnormal pitx2c expression in wild type and MZjnk2 mutants at 18-19 ss. Loss of jnk2 results in a significant proportion of embryos that do not have pitx2c expression in the lateral plate mesoderm. (H) Heart jogging is unaffected in MZjnk2 mutants. (I) Gut looping occurs normally in MZjnk2 mutants. (C) Data are mean±s.d., Welch's t-test. MZjnk2, n=14. Wild-type data are from Fig. 1F. (D) Data are mean±s.d., Welch's t-test. MZjnk2, n=737. Wild-type data are from Fig. 1H. (E′) Data are median±interquartile range, Mann–Whitney test. MZjnk2, n=28 beads from six embryos. Wild-type data are from Fig. 2F. (F) Data are mean±s.e.m., two-way ANOVA comparison of right and bilateral. n=3 clutches. Minimum clutch size: MZjnk2, n=24. Wild-type data are from Fig. 3B. (G) Data are mean±s.e.m., two-way ANOVA, multiple comparisons analysing right, bilateral and absent. n=5 clutches. Minimum clutch size: MZjnk2, n=81. Wild-type data are from Fig. 3H. (H) Data are mean±s.e.m., two-way ANOVA comparison of right and no jog. n=6 clutches for wild type and MZjnk2. Minimum clutch sizes: wild type, n=101; MZjnk2, n=46. (I) Data are mean±s.e.m., two-way ANOVA comparison of right and bilateral. n=3 clutches. Minimum clutch sizes: wild type, n=98; MZjnk2, n=89. (A) Lateral view, anterior leftwards. Scale bar: 1 mm. (B) Anterior upwards. Scale bar: 20 µm. ns, not significant. *P<0.05, ****P<0.0001. AL, anterior left, AR, anterior right; PL, posterior left; PR, posterior right.
Fig. 5.
Fig. 5.
jnk1a, jnk1b and jnk2 function together in nodal cilia development and KV function. (A) Representative bright-field image of MZjnk1a;MZjnk1b;Zjnk2 embryo at 3 dpf. (B) Representative MZjnk1a;MZjnk1b;Zjnk2 KVs at 10 ss labelling acetylated tubulin (green) and aPKC (magenta). (C) KV diameter quantification in wild type, and in MZjnk2 and MZjnk1a;MZjnk1b;Zjnk2 mutant embryos at 8 ss. KV size is not impacted by loss of jnk1 and jnk2 function. (D) Quantification of number of cilia in wild type, and in MZjnk1a;MZjnk1b, MZjnk2 and MZjnk1a;MZjnk1b;Zjnk2 mutant embryos at 10 ss. Loss of jnk1a, jnk1b and jnk2 does not impact cilia number in KV. (E) Quantification of nodal cilia distribution in wild-type and MZjnk1a;MZjnk1b;Zjnk2 embryos at 10 ss. Antero-posterior distribution of nodal cilia is unaffected by loss of jnk2 in a jnk1-null background. (F) Quantification of length of nodal cilial in wild type, and in MZjnk1a;MZjnk1b, MZjnk2 and MZjnk1a;MZjnk1b;Zjnk2 mutant embryos at 10 ss. MZjnk1a;MZjnk1b;Zjnk2 mutant embryos have a greater reduction in the length of nodal cilia compared with MZjnk1a;MZjnk1b or MZjnk2 mutants. (G,G′) Quantification of nodal flow speed in MZjnk1a;MZjnk1b;Zjnk2 by quadrant (µm/s; data are mean±s.d.) (G) and average speed (G′) between 10 and 14 ss. MZjnk1a;MZjnk1b;Zjnk2 mutant embryos have a greater reduction in the average speed of nodal flow compared with MZjnk1a;MZjnk1b or MZjnk2 mutants. (C) Data are mean±s.d., one-way ANOVA, multiple comparisons. MZjnk1a;MZjnk1b;Zjnk2, n=20. Wild-type data are from Fig. S1B. MZjnk2 data are from Fig. S2C. (D) Data are mean±s.d., one-way ANOVA, multiple comparisons. MZjnk1a;MZjnk1b;Zjnk2, n=12. Wild-type and MZjnk1a;MZjnk1b data are from Fig. 1F. MZjnk2 data are from Fig. 4C. (E) Data are mean±s.e.m., two-way ANOVA, multiple comparisons. MZjnk1a;MZjnk1b;Zjnk2, n=14. Wild-type data are from Fig. 1G. (F) Data are mean±s.d., one-way ANOVA, multiple comparisons. MZjnk1a;MZjnk1b;Zjnk2, n=466. Wild-type and MZjnk1a;MZjnk1b data are from Fig. 1H. MZjnk2 data are from Fig. 4D. (G′) Data are median±interquartile range, Kruskal–Wallis test, multiple comparisons, MZjnk1a;MZjnk1b;Zjnk2, n=28 beads across three embryos. Wild-type and MZjnk1a;MZjnk1b data are from Fig. 2F. MZjnk2 data are from Fig. 4E′. (A) Lateral view, anterior leftwards. Scale bar: 1 mm. (B) Anterior upwards. Scale bar: 20 µm. ns, not significant. **P<0.01, ****P<0.0001. AL, anterior left; AR, anterior right; PL, posterior left; PR, posterior right.
Fig. 6.
Fig. 6.
Asymmetric spaw expression is dispensable for organ asymmetry. (A) Characterisation of abnormal spaw expression in wild type and MZjnk1a;MZjnk1b;Zjnk2 mutants at 12-14 ss. Loss of jnk1 and jnk2 results in ∼40% of embryos displaying either right or bilateral spaw expression. (B) Characterisation of abnormal pitx2c expression in wild type and MZjnk1a;MZjnk1b;Zjnk2 mutants at 18-19 ss; loss of jnk1 and jnk2 results in a significant increase in the proportion of embryos without pitx2c expression in the LPM. (C-C″) Representative images of mRNA in situ hybridisation for the pan-cardiac marker myl7 at 72 hpf showing normal dextral looping of the heart (C), abnormal sinistral (reverse) looping (C′) or non-looped hearts (C″). (D,E) Quantification of (D) heart looping and (E) gut looping in wild type and MZjnk1a;MZjnk1b;Zjnk2 mutants at 72 hpf. Loss of jnk1 and jnk2 activity does not impact organ laterality. (A) Data are mean±s.e.m., two-way ANOVA comparison of right and bilateral. n=3 clutches. Minimum clutch size: MZjnk1a;MZjnk1b;Zjnk2, n=10. Wild-type data are from Fig. 3B. (B) Data are mean±s.e.m., two-way ANOVA, multiple comparisons analysing right, bilateral and absent. n=5 clutches. Minimum clutch size: MZjnk1a;MZjnk1b;Zjnk2, n=40. Wild-type data are from Fig. 3H. (D) Data are mean±s.e.m., two-way ANOVA comparison of sinistral and no loop. n=3 clutches. Minimum clutch sizes: wild type, n=88; MZjnk1a;MZjnk1b;Zjnk2, n=34. (E) Data are mean±s.e.m., two-way ANOVA comparison of right and bilateral. n=3 clutches, same clutches as in D. (C-C″) Ventral view. ns, not significant. *P<0.05, **P<0.01. V, ventricle; A, atrium.
Fig. 7.
Fig. 7.
jnk3 is required to restrict pitx2c. (A) Representative bright-field image of MZjnk3 mutant at 3 dpf. (B) Representative MZjnk3 KV at 10 ss labelling acetylated tubulin (green) and aPKC (magenta). (C) Quantification of number of cilia in wild-type and MZjnk3 embryos at 10 ss. Loss of jnk3 results in a significant increase in the number of nodal cilia. (D) Quantification of length of nodal cilial in wild-type and MZjnk3 embryos at 10 ss. Loss of jnk3 does not affect cilial length. (E,E′) Quantification of nodal flow speed in MZjnk3 by quadrant (µm/s; data are mean±s.d.) (E) and average speed (E′) between 10 and 14 ss. Loss of jnk3 results in a significant reduction in average speed (E′). (F) Loss of jnk3 does not impact normal spaw expression at 12-14 ss. (G) Characterisation of abnormal pitx2c expression in wild type and MZjnk3 mutants at 18-19 ss. Loss of jnk3 leads to a significant increase in the proportion of embryos that display bilateral pitx2c expression. (H) Heart jogging is unaffected in MZjnk3 mutants. (I) MZjnk3 mutants have a significant proportion of bilaterally positioned abdominal organs. (C) Data are mean±s.d., Welch's t-test. MZjnk3, n=14. Wild-type data are from Fig. 1F. (D) Data are mean±s.d., Welch's t-test. MZjnk3, n=720. Wild-type data are from Fig. 1H. (E′) Data are median±interquartile range, Mann–Whitney test. MZjnk3, n=61 beads across 11 embryos. Wild-type data are from Fig. 2F. (F) Data are mean±s.e.m., two-way ANOVA comparison of right and bilateral. n=3 clutches. Minimum clutch size: MZjnk3, n=23. Wild-type data are from Fig. 3B. (G) Data are mean±s.e.m., two-way ANOVA, multiple comparisons analysing right, bilateral and absent. n=5 clutches. Minimum clutch size: MZjnk3, n=81. Wild-type data are from Fig. 3H. (H) Data are mean±s.e.m., two-way ANOVA comparison of right and no jog. n=8 clutches for MZjnk3. Minimum clutch size: MZjnk3, n=46. Wild-type data are from Fig. 4H. (I) Data are mean±s.e.m., two-way ANOVA comparison of right and bilateral. n=3 clutches. Minimum clutch size: MZjnk3, n=92. Wild-type data are from Fig. 4I. (A) Lateral view, anterior leftwards. Scale bar: 1 mm. (B) Anterior upwards. Scale bar: 20 µm. ns, not significant. *P<0.05, **P<0.01, ****P<0.0001. AL, anterior left; AR, anterior right; PL, posterior left; PR, posterior right.
Fig. 8.
Fig. 8.
jnk1 and jnk2 are required for early establishment of the midline barrier. (A) Schematic of zebrafish embryo at 13-14 ss. Lateral view. lefty1 (lft1) expression (blue) extends anteriorly from the base of the notochord (red). Arrowhead indicates the anterior limit of expression. Representative images of mRNA in situ hybridisation of lft1 at 13-14 ss in (B) wild type, and (C) MZjnk1a, (D) MZjnk1b, (E) MZjnk1a;MZjnk1b, (F) MZjnk2, (G) MZjnk1a;MZjnk1b;Zjnk2 and (H) MZjnk3 mutant embryos. Arrowheads indicate the anterior limit of lft1 expression in the notochord. (I) Quantification of the average length of lft1 expression at 13-14 ss. Loss of jnk1a results in ∼50% reduction in average length of lft1 domain. MZjnk1b, MZjnk1a;MZjnk1b, MZjnk2 and MZjnk1a;MZjnk1b;Zjnk2 mutants display a more dramatic and similar reduction in the extent of lft1 propagation in the notochord. lft1 expression is unaffected in MZjnk3 mutants. (B-H) Lateral view, anterior is towards the top. (I) Data are mean±s.e.m., Brown-Forsythe and Welch ANOVA, multiple comparisons, with notations denoting result of test between wild type and respective mutant. n=6 clutches. Minimum clutch sizes: wild type, n=82; MZjnk1a, n=73; MZjnk1b, n=61; MZjnk1a;MZjnk1b, n=78; MZjnk2, n=59; MZjnk3, n=69; MZjnk1a;MZjnk1b;Zjnk2, n=37. (B-H) Lateral views, anterior leftwards. ns, not significant. *P<0.05, ****P<0.0001.

Similar articles

Cited by

References

    1. Ai, D., Liu, W., Ma, L., Dong, F., Lu, M.-F., Wang, D., Verzi, M. P., Cai, C., Gage, P. J., Evans, S.et al. (2006). Pitx2 regulates cardiac left-right asymmetry by patterning second cardiac lineage-derived myocardium. Dev. Biol. 296, 437-449. 10.1016/j.ydbio.2006.06.009 - DOI - PMC - PubMed
    1. Alten, L., Schuster-Gossler, K., Beckers, A., Groos, S., Ulmer, B., Hegermann, J., Ochs, M. and Gossler, A. (2012). Differential regulation of node formation, nodal ciliogenesis and cilia positioning by Noto and Foxj1. Development 139, 1276-1284. 10.1242/dev.072728 - DOI - PubMed
    1. Amack, J. D. (2014). Salient features of the ciliated organ of asymmetry. Bioarchitecture 4, 6-15. 10.4161/bioa.28014 - DOI - PMC - PubMed
    1. Amack, J. D., Wang, X. and Yost, H. J. (2007). Two T-box genes play independent and cooperative roles to regulate morphogenesis of ciliated Kupffer's vesicle in zebrafish. Dev. Biol. 310, 196-210. 10.1016/j.ydbio.2007.05.039 - DOI - PubMed
    1. Antic, D., Stubbs, J. L., Suyama, K., Kintner, C., Scott, M. P. and Axelrod, J. D. (2010). Planar cell polarity enables posterior localization of nodal cilia and left-right axis determination during mouse and Xenopus embryogenesis. PLoS One 5, e8999. 10.1371/journal.pone.0008999 - DOI - PMC - PubMed

Publication types

Substances

LinkOut - more resources