

Smaller species but larger stages: Warming effects on inter- and intraspecific community size structure
- PMID: 35352827
- PMCID: PMC9285768
- DOI: 10.1002/ecy.3699
Smaller species but larger stages: Warming effects on inter- and intraspecific community size structure
Abstract
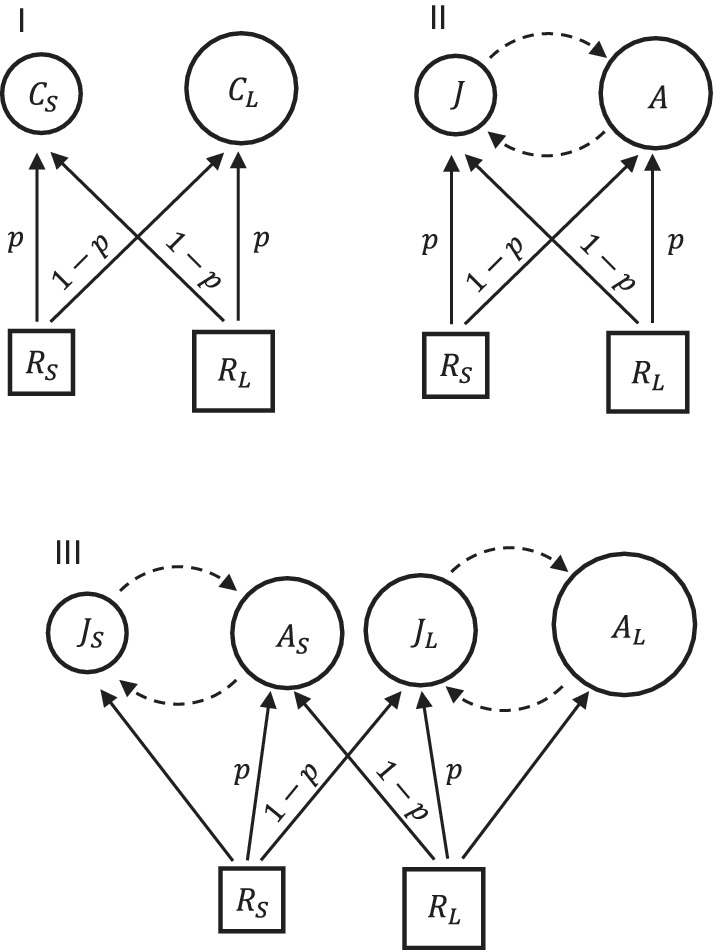
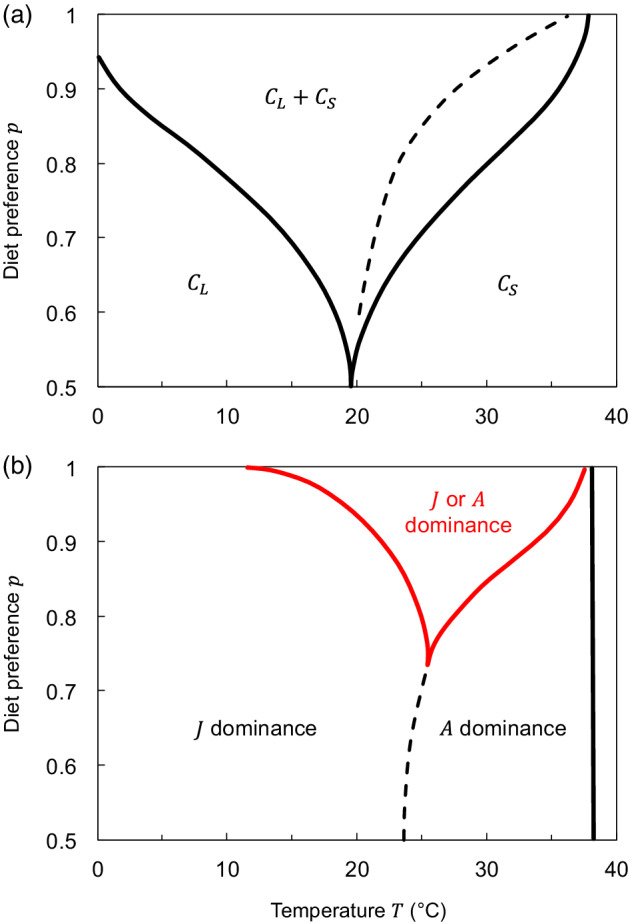
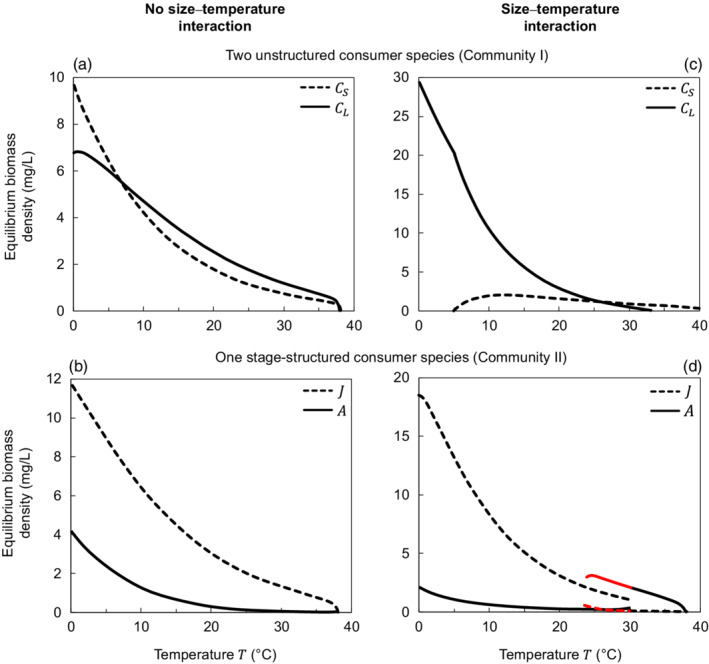
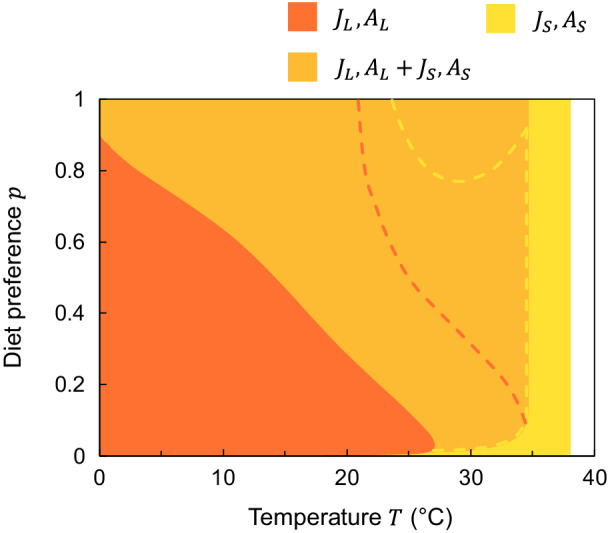
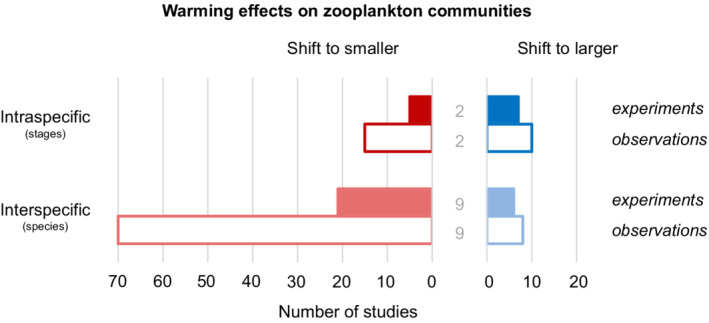
Global warming can alter size distributions of animal communities, but the contribution of size shifts within versus between species to such changes remains unknown. In particular, it is unclear if expected body size shrinkage in response to warming, observed at the interspecific level, can be used to infer similar size shifts within species. In this study, we compare warming effects on interspecific (relative species abundance) versus intraspecific (relative stage abundance) size structure of competing consumers by analyzing stage-structured bioenergetic food web models consisting of one or two consumer species and two resources, parameterized for pelagic plankton. Varying composition and temperature and body size dependencies in these models, we predicted interspecific versus intraspecific size structure across temperature. We found that warming shifted community size structure toward dominance of smaller species, in line with empirical evidence summarized in our review of 136 literature studies. However, this result emerged only given a size-temperature interaction favoring small over large individuals in warm environments. In contrast, the same mechanism caused an intraspecific shift toward dominance of larger (adult) stages, reconciling disparate observations of size responses within and across zooplankton species in the literature. As the empirical evidence for warming-driven stage shifts is scarce and equivocal, we call for more experimental studies on intraspecific size changes with warming. Understanding the global warming impacts on animal communities requires that we consider and quantify the relative importance of mechanisms concurrently shaping size distributions within and among species.
Keywords: adult; body size; competition; diet preference; global warming; juvenile; optimum; stage; temperature; zooplankton.
© 2022 The Authors. Ecology published by Wiley Periodicals LLC on behalf of The Ecological Society of America.
Conflict of interest statement
The authors declare no conflict of interest.
Figures
Similar articles
-
Effects of Warming on Intraguild Predator Communities with Ontogenetic Diet Shifts.Am Nat. 2021 Dec;198(6):706-718. doi: 10.1086/716927. Epub 2021 Oct 11. Am Nat. 2021. PMID: 34762572
-
Phytoplankton cell size: intra- and interspecific effects of warming and grazing.PLoS One. 2012;7(11):e49632. doi: 10.1371/journal.pone.0049632. Epub 2012 Nov 30. PLoS One. 2012. PMID: 23226215 Free PMC article.
-
Climate change affects low trophic level marine consumers: warming decreases copepod size and abundance.Oecologia. 2015 Mar;177(3):849-860. doi: 10.1007/s00442-014-3130-4. Epub 2014 Nov 21. Oecologia. 2015. PMID: 25413864
-
Intraspecific variation in tolerance of warming in fishes.J Fish Biol. 2021 Jun;98(6):1536-1555. doi: 10.1111/jfb.14620. Epub 2020 Dec 19. J Fish Biol. 2021. PMID: 33216368 Review.
-
Optimum growth temperature declines with body size within fish species.Glob Chang Biol. 2022 Apr;28(7):2259-2271. doi: 10.1111/gcb.16067. Epub 2022 Jan 21. Glob Chang Biol. 2022. PMID: 35060649
Cited by
-
Ecological consequences of body size reduction under warming.Proc Biol Sci. 2024 Aug;291(2029):20241250. doi: 10.1098/rspb.2024.1250. Epub 2024 Aug 21. Proc Biol Sci. 2024. PMID: 39166384 Review.
-
Distinct impacts of feeding frequency and warming on life history traits affect population fitness in vertebrate ectotherms.Ecol Evol. 2023 Nov 23;13(11):e10770. doi: 10.1002/ece3.10770. eCollection 2023 Nov. Ecol Evol. 2023. PMID: 38020679 Free PMC article.
-
MaxEnt Modeling for Predicting the Potential Geographical Distribution of Hydrocera triflora since the Last Interglacial and under Future Climate Scenarios.Biology (Basel). 2024 Sep 22;13(9):745. doi: 10.3390/biology13090745. Biology (Basel). 2024. PMID: 39336172 Free PMC article.
-
Environmental Change Can Result in Irreversible Biodiversity Loss in Recently Formed Species Flocks.Glob Chang Biol. 2025 May;31(5):e70239. doi: 10.1111/gcb.70239. Glob Chang Biol. 2025. PMID: 40346882 Free PMC article.
-
Differences in Tri-Trophic Community Responses to Temperature-Dependent Vital Rates, Thermal Niche Mismatches and Temperature-Size Rule.Ecol Lett. 2024 Nov;27(11):e70022. doi: 10.1111/ele.70022. Ecol Lett. 2024. PMID: 39623751 Free PMC article.
References
-
- Andersen, K. H. , Berge T., Gonçalves R. J., Hartvig M., Heuschele J., Hylander S., Jacobsen N. S., et al. 2016. “Characteristic Sizes of Life in the Oceans, from Bacteria to Whales.” Annual Review of Marine Science 8: 217–41. - PubMed
-
- Angilletta, M. J., Jr. , and Dunham A. E.. 2003. “The Temperature‐Size Rule in Ectotherms: Simple Evolutionary Explanations May Not Be General.” American Naturalist 162: 332–42. - PubMed
-
- Angilletta, M. J., Jr. , Steury T. D., and Sears M. W.. 2004. “Temperature, Growth Rate, and Body Size in Ectotherms: Fitting Pieces of a Life‐History Puzzle.” Integrative and Comparative Biology 44: 498–509. - PubMed
-
- Atkinson, D. 1994. “Temperature and organism size—A biological law for ectotherms?” Advances in Ecological Research 25: 1–58.
-
- Audzijonyte, A. , Barneche D. R., Baudron A. R., Belmaker J., Clark T. D., Marshall C. T., Morrongiello J. R., and van Rijn I.. 2019. “Is oxygen limitation in warming waters a valid mechanism to explain decreased body sizes in aquatic ectotherms?” Global Ecology and Biogeography 28: 64–77.
Publication types
MeSH terms
LinkOut - more resources
Full Text Sources
Research Materials
Miscellaneous