. 2022 Apr 27;96(8):e0194621.
doi: 10.1128/jvi.01946-21. Epub 2022 Mar 30.

The In Vivo and In Vitro Architecture of the Hepatitis C Virus RNA Genome Uncovers Functional RNA Secondary and Tertiary Structures

Affiliations

The In Vivo and In Vitro Architecture of the Hepatitis C Virus RNA Genome Uncovers Functional RNA Secondary and Tertiary Structures

Han Wan et al. J Virol. .

Abstract

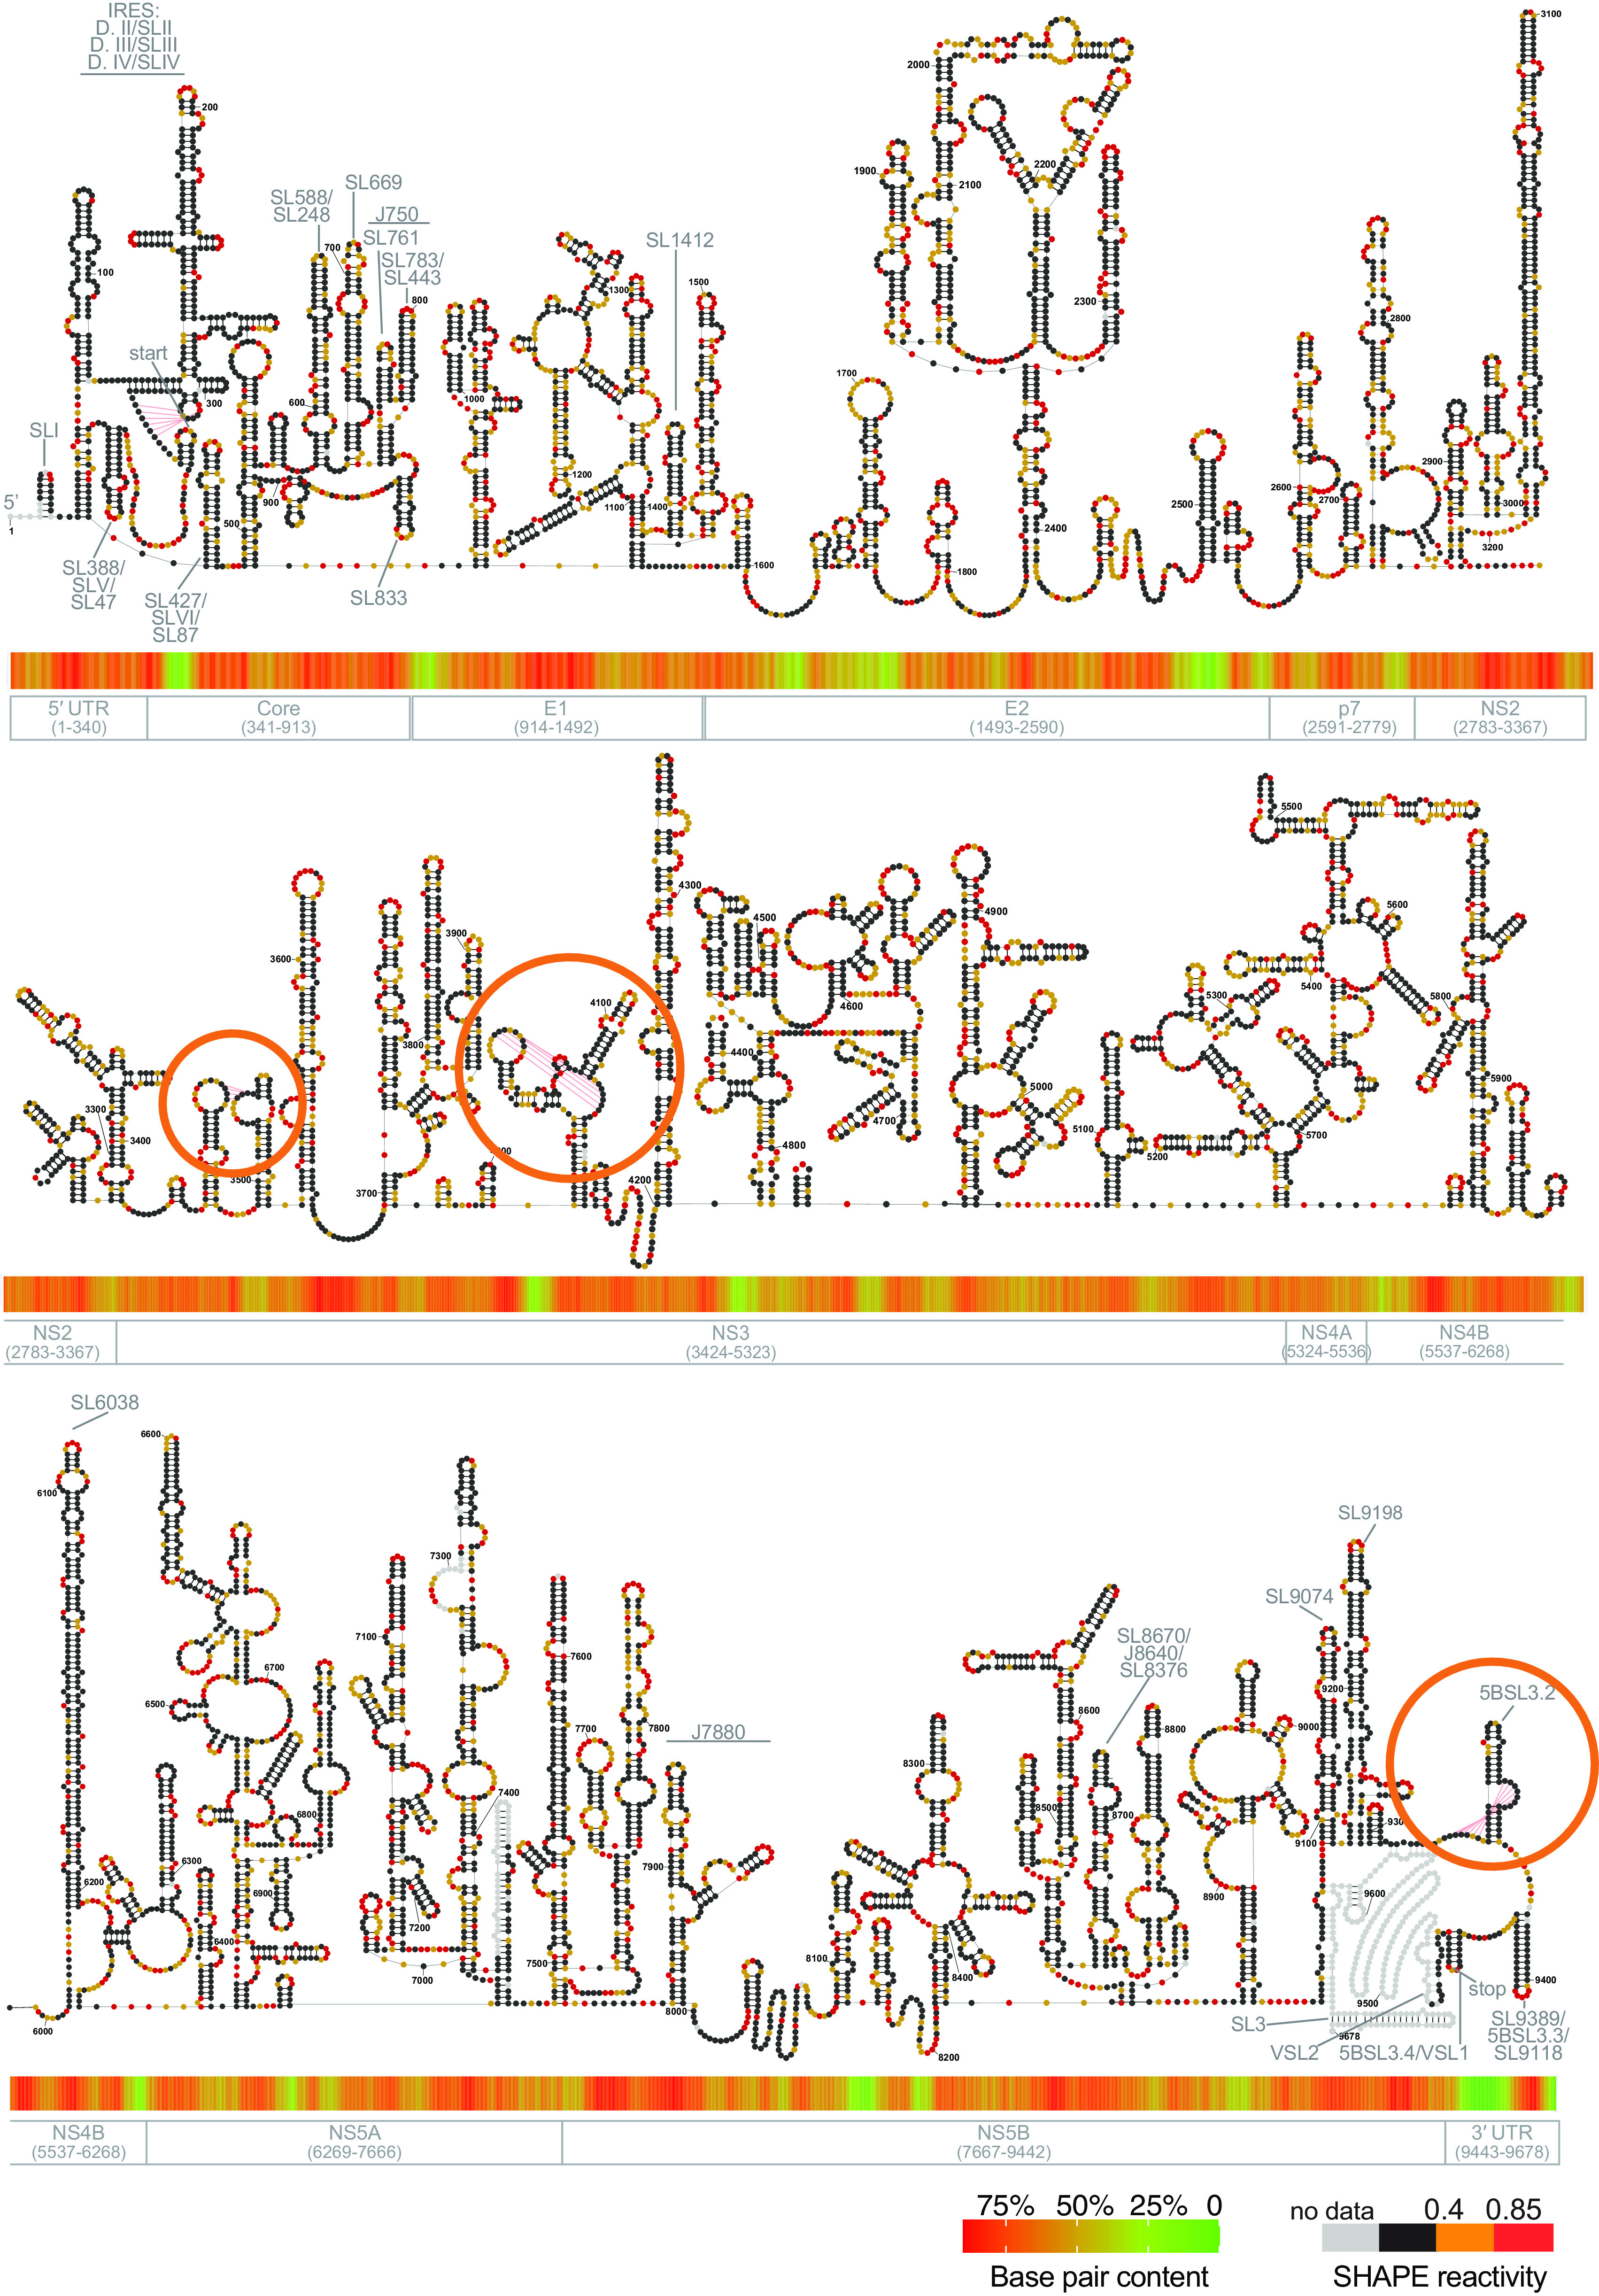
Hepatitis C virus (HCV) is a positive-strand RNA virus that remains one of the main contributors to chronic liver disease worldwide. Studies over the last 30 years have demonstrated that HCV contains a highly structured RNA genome and many of these structures play essential roles in the HCV life cycle. Despite the importance of riboregulation in this virus, most of the HCV RNA genome remains functionally unstudied. Here, we report a complete secondary structure map of the HCV RNA genome in vivo, which was studied in parallel with the secondary structure of the same RNA obtained in vitro. Our results show that HCV is folded extensively in the cellular context. By performing comprehensive structural analyses on both in vivo data and in vitro data, we identify compact and conserved secondary and tertiary structures throughout the genome. Genetic and evolutionary functional analyses demonstrate that many of these elements play important roles in the virus life cycle. In addition to providing a comprehensive map of RNA structures and riboregulatory elements in HCV, this work provides a resource for future studies aimed at identifying therapeutic targets and conducting further mechanistic studies on this important human pathogen. IMPORTANCE HCV has one of the most highly structured RNA genomes studied to date, and it is a valuable model system for studying the role of RNA structure in protein-coding genes. While previous studies have identified individual cases of regulatory RNA structures within the HCV genome, the full-length structure of the HCV genome has not been determined in vivo. Here, we present the complete secondary structure map of HCV determined both in cells and from corresponding transcripts generated in vitro. In addition to providing a comprehensive atlas of functional secondary structural elements throughout the genomic RNA, we identified a novel set of tertiary interactions and demonstrated their functional importance. In terms of broader implications, the pipeline developed in this study can be applied to other long RNAs, such as long noncoding RNAs. In addition, the RNA structural motifs characterized in this study broaden the repertoire of known riboregulatory elements.

Keywords: HCV; RNA folding; SHAPE; pseudoknot; viral replication.


Conflict of interest statement

The authors declare no conflict of interest.

Figures

FIG 1
FIG 1
Semi-native folded HCV RNA is of sufficient quality for structure discovery. (A) Workflow of in vitro SHAPE-MaP and structure prediction. (B) Mutation rate of two biological replicates across the HCV Jc1 genome. The boxes represent interquartile range, the median is indicated by a line, whiskers are drawn in Tukey style, and values outside this range are not shown. (C) Correlation plot of normalized SHAPE reactivities from two biological replicates. The line represents a linear regression fit to the data. (D) Normalized SHAPE reactivity binned by strandedness, as determined by our consensus structural model. (E) Comparison of the SHAPE reactivity distribution of double-stranded regions in our SHAPE data and data that were collected in Mauger et al. SHAPE data (6). Low, reactivity of <0.4; middle, 0.4 ≤ reactivity < 0.85; high, reactivity of ≥0.85; ****, P < 0.0001 by equal variance unpaired Student’s t test.
FIG 2
FIG 2
The in vitro secondary structural map of HCV. The in vitro SHAPE reactivities are color coded, as shown in the legend. A heatmap representing HCV base pair content (BPC) is shown below each section of the structure diagram. The color key to the heatmap is shown on the bottom right corner. Boundaries of HCV coding regions are shown under the heatmap. Gray text (e.g., SL588) indicates regions identified previously. Orange circles indicate the three novel pseudoknots. In vitro replicate 1 data were used to generate this structural map.
FIG 3
FIG 3
Well-folded HCV secondary structures were determined from the in vitro SHAPE-MaP analysis. The local median Shannon entropy (50-nt sliding window) and local median SHAPE reactivity (50-nt sliding window) are plotted along the HCV genome (graph at top). Well-folded regions are shaded in blue. A selection of specific, representative structures is shown at the bottom and labeled with in vitro SHAPE reactivities. Previously characterized structures are labeled in black, while novel substructures are named according to their position and labeled in blue.
FIG 4
FIG 4
The HCV genome is highly structured in a cellular context. (A) Schematic of the HCV subgenomic replicon (SGR), with constituent genes indicated by colored bars. (B) The mutation rate of two biological replicates across the HCV SGR genome. (C) Normalized SHAPE reactivity distribution of in vitro and in vivo purified HCV RNA for region NS3-3′ UTR. (D) Shannon Entropy distribution between the in vitro and in vivo structural models for the NS3-3′ UTR region. (E) The in vivo SHAPE reactivity distribution between the HCV-SGR (except neomycin region) and the neomycin region. For panels B to E, data are plotted as in Fig. 1B. (F) The in vivo structure model of HCV SGR labeled by SHAPE reactivity. Nucleotides were numbered according to their position on the full-length HCV genome (Jc1). Schematic of corresponding HCV domains is shown below the structural map. Gray text (e.g., IRES) indicates a region previously identified. In vivo replicate1 data were used to generate this structure map. The neomycin resistance gene and EMCV IRES were not included in the structure prediction. The full-length structural model, including neomycin resistance gene and EMCV IRES, can be found in the GitHub repository. **, P < 0.01; ***, P < 0.001; ****, P < 0.0001 by equal variance unpaired Student’s t test.
FIG 5
FIG 5
Comparison of in vivo and in vitro SHAPE data sets (A) Top: The local correlation between in vitro SHAPE reactivity and in vivo SHAPE reactivity (200-nt sliding window, dashed line represents Pearson r = 0.75) as a function of genomic position. A schematic of HCV domains is shown below the graph. Middle and bottom panel: The local median Shannon entropy (50-nt sliding window) and local median SHAPE reactivity (50-nt sliding window) along the HCV SGR genome. Well-folded regions are shaded in blue. A low correlation region (r < 0.75, from nucleotides 7877 to 8412 in the HCV genome) is shaded in orange. (B) Structural models for each well-folded region, labeled as in Fig. 3. (C) ΔSHAPE analysis comparing in vivo and in vitro SHAPE reactivities for nucleotides 8086 to 8286. Regions with significant differences are shaded in green. (D) Structural drawing of SL8145, labeled with in vitro SHAPE reactivity (left) and in vivo SHAPE reactivity (right).
FIG 6
FIG 6
Global and local evolutionary analyses suggest a functional role for structures in the HCV ORF. (A) Synonymous mutation rates (dS) calculated for single- and double-stranded nucleotides across all genotypes and within genotype 2 by using the in vitro structural model. (B and C) A comparison of dS for single- and double-stranded nucleotides within individual HCV domains using the pan-genotype and genotype 2-specific alignments, respectively. (A to C) Data were plotted as in Fig. 1B. (D) Synonymous mutation rates calculated for four individually structured domains using the pan-genotype alignment. The line indicates median, and whiskers indicate standard deviation. (E) Four structures supported by dS analysis across all 7 genotypes, color-coded with dS. (F) Synonymous mutation rates calculated for four individual structured domains by using the genotype 2-specific alignment. Data are plotted as in panel D. (G) Four structures supported by dS analysis calculated by using the genotype 2-specific alignment, color-coded by dS. (H) Schematic showing the unzipped synonymous mutation for region SL8431. (I) Schematic of HCV luciferase replicon. Position of SL8431 is indicated. (J) Replication time courses for WT HCV, the replication-defective mutant (GNN), and unzip mutant of SL8431, measured by Gluc activity. Experiments were performed in triplicate; values were normalized to untransfected controls. Inset: Expanded plot for 4 h and 12 h posttransfection. **, P < 0.01; ***, P < 0.001; ****, P < 0.0001 by equal variance unpaired Student’s t test (mutant versus WT-HCV). Insignificant t test results (P > 0.05) are not displayed on the plot.
FIG 7
FIG 7
Mutational analysis supports a functional role for PsK1 and PsK2. (A) Schematic of the HCV Gluc replicon indicating the genomic positions of the three pseudoknots. (B and E) Structural representation of pseudoknot 1 (PsK1) and pseudoknot 2 (Psk2), labeled with in vivo SHAPE reactivity. Pseudoknotted nucleotides are indicated with black lines. Pseudoknot base pairs are labeled with red lines. (C, F, and H) Sequences of the pseudoknotted stems with unzipped and compensatory mutations. (D, G, and I) Replication time courses for WT HCV, the replication-defective mutant (GNN) control, and the unzipped and compensatory mutants of each indicated pseudoknot, measured by Gluc activity. Experiments were performed in triplicate, and values were normalized to untransfected controls. The same controls (WT HCV, GNN) are shown in panels G and I. Inset: Expanded plot for 4 and 12 h posttransfection. *, P < 0.05; **, P < 0.01; ****, P < 0.0001 by equal variance unpaired Student’s t test (mutant versus WT-HCV). Insignificant t test results (P > 0.05) are not displayed on the plot.
FIG 8
FIG 8
Mutational analysis supports a functional role for PsK3. (A) Structural representation of pseudoknot 3 (PsK3), labeled with in vivo SHAPE reactivity. Pseudoknotted nucleotides are indicated with black lines, and pseudoknot base pairs are indicated with red lines. (B, D, and G) Sequences for the unzipped and compensatory mutations in the pseudoknotted stem. (C, E, F, and H) Replication time courses for WT HCV, the replication-defective mutant (GNN), and the unzipped and compensatory mutants of PsK3, by Gluc activity. The experiment was performed in triplicate, with values normalized to untransfected controls. The same controls (WT HCV, GNN) are shown in panels E, F, and H. Inset: Expanded plot for the 4- and 12-h posttransfection time points. *, P < 0.05; **, P < 0.01; ***, P < 0.001; ****, P < 0.0001 by equal variance unpaired Student’s t test (mutant versus WT HCV). Insignificant t test results (P > 0.05) are not displayed on the plot. The t test results for GNN versus WT HCV are not displayed on the plot.

Similar articles

Cited by

References

    1. Bartenschlager R. 2013. Hepatitis C virus: from molecular virology to antiviral therapy preface. Curr Top Microbiol Immunol 369:V–Vi.
    1. Phan T, Beran RK, Peters C, Lorenz IC, Lindenbach BD. 2009. Hepatitis C virus NS2 protein contributes to virus particle assembly via opposing epistatic interactions with the E1-E2 glycoprotein and NS3-NS4A enzyme complexes. J Virol 83:8379–8395. 10.1128/JVI.00891-09. - DOI - PMC - PubMed
    1. Tuplin A, Struthers M, Cook J, Bentley K, Evans DJ. 2015. Inhibition of HCV translation by disrupting the structure and interactions of the viral CRE and 3' X-tail. Nucleic Acids Res 43:2914–2926. 10.1093/nar/gkv142. - DOI - PMC - PubMed
    1. Adams RL, Pirakitikulr N, Pyle AM. 2017. Functional RNA structures throughout the Hepatitis C Virus genome. Curr Opin Virol 24:79–86. 10.1016/j.coviro.2017.04.007. - DOI - PMC - PubMed
    1. Pirakitikulr N, Kohlway A, Lindenbach BD, Pyle AM. 2016. The coding region of the HCV genome contains a network of regulatory RNA structures. Mol Cell 62:111–120. 10.1016/j.molcel.2016.01.024. - DOI - PMC - PubMed

LinkOut - more resources