. 2022 May 15;33(6):ar46.
doi: 10.1091/mbc.E21-10-0521. Epub 2022 Mar 30.

Emergent dynamics of a three-node regulatory network explain phenotypic switching and heterogeneity: a case study of Th1/Th2/Th17 cell differentiation

Affiliations

Emergent dynamics of a three-node regulatory network explain phenotypic switching and heterogeneity: a case study of Th1/Th2/Th17 cell differentiation

Atchuta Srinivas Duddu et al. Mol Biol Cell. .

Abstract

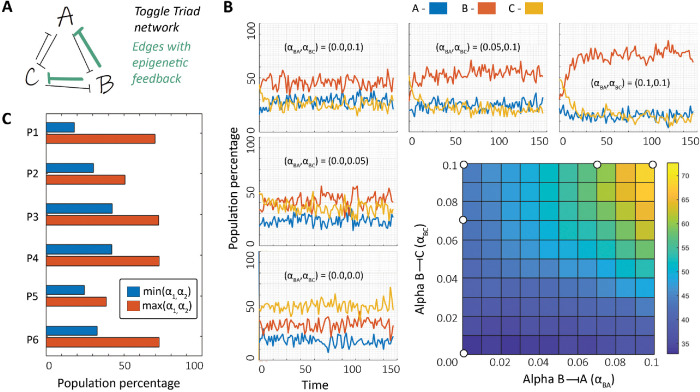
Naïve helper (CD4+) T-cells can differentiate into distinct functional subsets including Th1, Th2, and Th17 phenotypes. Each of these phenotypes has a "master regulator"-T-bet (Th1), GATA3 (Th2), and RORγT (Th17)-that inhibits the other two master regulators. Such mutual repression among them at a transcriptional level can enable multistability, giving rise to six experimentally observed phenotype, Th1, Th2, Th17, hybrid Th/Th2, hybrid Th2/Th17, and hybrid Th1/Th17. However, the dynamics of switching among these phenotypes, particularly in the case of epigenetic influence, remain unclear. Here through mathematical modeling, we investigated the coupled transcription-epigenetic dynamics in a three-node mutually repressing network to elucidate how epigenetic changes mediated by any master regulator can influence the transition rates among different cellular phenotypes. We show that the degree of plasticity exhibited by one phenotype depends on relative strength and duration of mutual epigenetic repression mediated among the master regulators in a three-node network. Further, our model predictions can offer putative mechanisms underlying relatively higher plasticity of Th17 phenotype as observed in vitro and in vivo. Together, our modeling framework characterizes phenotypic plasticity and heterogeneity as an outcome of emergent dynamics of a three-node regulatory network, such as the one mediated by T-bet/GATA3/RORγT.


Figures

FIGURE 1:
FIGURE 1:
Transcriptomic analysis showing enrichment of Th1, Th2, and Th17 signatures specific to corresponding cell types. (A) (i) A 2D scatterplot showing T naïve, Th1, and Th2 cell types on the Th1-Th2 ssGSEA score plane. (ii) Quantification of differences in levels of Th1 and Th2 ssGSEA scores across T naïve, Th1, and Th2 cell types (GSE71645). (B) Quantification of differences in levels of Th1 and Th2 ssGSEA scores across T naïve, activated T naïve, induced Th1, and induced Th2 cell types (GSE71566). (C) Quantification of differences in levels of Th1 and Th2 ssGSEA scores across T naïve, activated Th1, and activated Th2 cell types (GSE62484). (D) Quantification of differences in levels of Th1 and Th2 ssGSEA scores across T naïve, Th1, and Th2 cell types over the time points 0 h, 6 h, 1 d, 3 d, 6 d, and 8 d (GSE60678). (E) Quantification of Th1 and TH2 ssGSEA scores for differentiating Th1 and Th2 cells over time points 0.5, 1, 2, and 3 d (GSE32959). (F) Quantification of differences in levels of Th17 ssGSEA scores across WT and RORγT knockout Th17 cells (GSE129132). (G) (i) A 3D scatterplot showing T naïve, Th1, Th2, and Th17 cell types on the Th1-Th2-Th17 ssGSEA score space in a nontreatment condition (control set at 0 h) and (ii) its corresponding (same condition) quantification of differences in the levels of Th1, Th2, and Th17 signatures (ssGSEA scores) (GSE54627). *Significantly different level of ssGSEA scores assessed by Students t test; p value < 0.05.
FIGURE 2:
FIGURE 2:
Phenotypic heterogeneity in Th cell population. (A) Toggle Triad network topology underlies the differentiation of naïve CD4+ T-cell into Th cells (Th1, Th2, and Th17). Each master regulator (T-bet, GATA3, and RORγT, respectively) mutually represses the other two. (B) The three states enabled by a toggle triad are listed along with notation used hereafter. A schematic representing a kinetic model with certain parameter set enabling a heterogenous population and noise enabling switching between the states. (C) Stochastic simulations of the network for different parameter sets (P1–P6 [Supplemental Table S1]) showing switching between the three states.
FIGURE 3:
FIGURE 3:
Epigenetic repression mediated by one node in toggle triad on the other two nodes. (A) Toggle triad network topology in which interactions incorporating epigenetic repression are marked in green. (B) Phase plot showing the population percentage of cells in state B (aBc) with bifurcation parameters as the α values corresponding to the epigenetic feedback of B -| A and B -| C, as well as dynamics of distribution of population percentage between states A, B, and C for certain pairs of αBA and αBC values. (C) Population percentage of the node from which interactions with epigenetic repression originate, with pair of α values at corresponding maximum and minimum for six parameter sets (P1–P6 given in SupplementalTable S1). Parameter set P6 used in B. Results for parameter sets P1–P5 shown in Supplemental Figures S2 and S3.
FIGURE 4:
FIGURE 4:
Epigenetic repression on edges originating from more than one node in the toggle triad. (A) (Left) Toggle triad network in which interactions where epigenetic repression is incorporated are marked in green. (Right) Dynamics of distribution of population percentage between states A, B, and C for certain pairs of αBC and αCB values. (B) Phase plot showing the ratio of population percentage of C to that of B with bifurcation parameters as the α values corresponding to the epigenetic feedback of B -| C and C -| B. (C) Ratio of population percentages of the nodes from which interactions with epigenetic feedback originate with pair of α values at combinations of maximum and minimum for three different parameter sets. (D) (Left) Same as A. (Right) Same as A but for certain values of αAC and αBC. (E) Phase plot showing the population percentage of C with bifurcation parameters as the α values corresponding to epigenetic feedback of A -| C and B -| C. (F) Population percentage of C (for parameter set P6), that of corresponding nodes in other parameter sets (P1–P5). Results for P6 are shown in B and E; those for P1-P5 are shown in Supplemental Figures S4–S8.
FIGURE 5:
FIGURE 5:
Epigenetic repression on edges originating from more than one node in the toggle triad. (A) Toggle Triad network topology in which interactions marked in green are being provided with epigenetic feedback. (B) Population percentages of A, B, and C as X, the fraction of time for which the epigenetic feedback for both marked interactions is switched ON and then turned OFF. (C) Phase plot showing population percentage of B (node from which interactions with epigenetic feedback originate) with bifurcation parameters as the α value corresponding to epigenetic feedback of B -| A and B -| C (αBA = αBC) and X. (D) Same as A. (E) Same as B but for two cases where feedback for one of the interactions, B -| C (C -| B) is switched ON with the other one C-|B (B-|C) switched OFF. (F) Phase plot showing ratio of population percentage of C to B (nodes between which interactions with epigenetic feedback are present) with bifurcation parameters as the difference of α values corresponding to the epigenetic feedback of B -| C and C -| B and X. (G) Same as A. (H) Same as B. (I) Phase plot showing population percentage of C (node onto which interactions with epigenetic feedback terminate) with bifurcation parameters as the α value corresponding to the epigenetic feedback of A-|C and B-|C (both same so considered on single axis) and X. Results for parameter set P6 shown here; those for P1–P5 are shown in Supplemental Figures S9–S13.
FIGURE 6:
FIGURE 6:
Varying the epigenetic repression onto the node in toggle triad. (A) (i) Phase plot of population percentage corresponding to node A with variations in two parameters: X and the relative epigenetic influence which is varied from a case of stronger repression from C to B (αBC < αCB) to a stronger repression from B to C (αBC > αCB) (ii) Same as i but for state B. (iii) Same as i but for state C. (B) (i) Same as Ai but for varying relative epigenetic influence in both feedback loops (between A and C and between B and C). Corresponding αBC – αCB and αAC – αCA values are given on the x axis marked by * and **, respectively. (ii) Same as i but for state B. (iii) Same as i but for state C. (C) (i) Phase plot of population percentage corresponding to state A with bifurcation parameters as the difference in α values corresponding to mutual epigenetic repression (αBC – αCB and αAC – αCA), at X = 0.03. (ii) Same as i but for state B. (iii) Same as i but for state C. Results for parameter set P6 are shown here; those for P1–P5 parameter sets are shown in Supplemental Figures S14–S18.
FIGURE 7:
FIGURE 7:
A schematic representing Th1/Th2/Th17 differentiation mediated by a toggle triad.

Similar articles

Cited by

References

    1. Äijö T, Edelman SM, Lönnberg T, Larjo A, Kallionpää H, Tuomela S, Engström E, Lahesmaa R, Lähdesmäki H (2012). An integrative computational systems biology approach identifies differentially regulated dynamic transcriptome signatures which drive the initiation of human T helper cell differentiation. BMC Genomics 13, 572. - PMC - PubMed
    1. Barbie DA, Tamayo P, Boehm JS, Kim SY, Moody SE, Dunn IF, Schinzel AC, Sandy P, Meylan E, Scholl C, et al. (2009). Systematic RNA interference reveals that oncogenic KRAS-driven cancers require TBK1. Nature 462, 108–112. - PMC - PubMed
    1. Bargaje R, Trachana K, Shelton MN, McGinnis CS, Zhou JX, Chadick C, Cook S, Cavanaugh C, Huang S, Hood L (2017). Cell population structure prior to bifurcation predicts efficiency of directed differentiation in human induced pluripotent cells. Proc Natl Acad Sci USA 114, 2271–2276. - PMC - PubMed
    1. Baumann V, Wiesbeck M, Breunig CT, Braun JM, Köferle A, Ninkovic J, Götz M, Stricker SH (2019). Targeted removal of epigenetic barriers during transcriptional reprogramming. Nat Commun 10, 2119. - PMC - PubMed
    1. Becattini S, Latorre D, Mele F, Foglierini M, De Gregorio C, Cassotta A, Fernandez B, Kelderman S, Schumacher TN, Corti D, et al. (2015). T cell immunity. Functional heterogeneity of human memory CD4+ T cell clones primed by pathogens or vaccines. Science 347, 400–406. - PubMed

Publication types

Substances