. 2022 May 2;219(5):e20211830.
doi: 10.1084/jem.20211830. Epub 2022 Mar 30.

Infection-induced lymphatic zippering restricts fluid transport and viral dissemination from skin

Affiliations

Infection-induced lymphatic zippering restricts fluid transport and viral dissemination from skin

Madeline J Churchill et al. J Exp Med. .

Abstract

Lymphatic vessels are often considered passive conduits that flush antigenic material, pathogens, and cells to draining lymph nodes. Recent evidence, however, suggests that lymphatic vessels actively regulate diverse processes from antigen transport to leukocyte trafficking and dietary lipid absorption. Here we tested the hypothesis that infection-induced changes in lymphatic transport actively contribute to innate host defense. We demonstrate that cutaneous vaccinia virus infection by scarification activates dermal lymphatic capillary junction tightening (zippering) and lymph node lymphangiogenesis, which are associated with reduced fluid transport and cutaneous viral sequestration. Lymphatic-specific deletion of VEGFR2 prevented infection-induced lymphatic capillary zippering, increased fluid flux out of tissue, and allowed lymphatic dissemination of virus. Further, a reduction in dendritic cell migration to lymph nodes in the absence of lymphatic VEGFR2 associated with reduced antiviral CD8+ T cell expansion. These data indicate that VEGFR2-driven lymphatic remodeling is a context-dependent, active mechanism of innate host defense that limits viral dissemination and facilitates protective, antiviral CD8+ T cell responses.


Conflict of interest statement

Disclosures: The authors declare no competing financial interests.

Figures

None
Graphical abstract
Figure 1.
Figure 1.
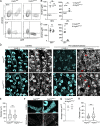
Vaccinia infection induces dermal lymphatic capillary zippering. (A and B) Viral titers in skin and dLNs of WT mice infected with VACV by scarification (A) or intradermal injection (5 × 10⁶; B) 5 dpi. LOD, limit of detection. (C) Skin viral titers over time (scarification). (D) Ear thickness 5 dpi or mock scarification (sterile needle). One-way ANOVA. (E) Representative dermal lymphatic capillaries 5 dpi or after mock scarification. Scale bar = 20 μm. (F) Average junctional area from E. One-way ANOVA. (G) EM of lymphatic junction in intact skin 5 dpi. L, lumen; arrows, interendothelial junctions. Scale bar = 500 nm. (H) Junctional area over time. Each point represents an individual mouse; error bars represent SEM; all experiments performed at least twice. **, P < 0.01; ****, P < 0.0001.
Figure S1.
Figure S1.
Infection-dependent dermal lymphatic capillary zippering. (A) Representative whole-mount images of naive lymphatic capillary in murine dermis. LV, lymphatic vessel; BV, blood vessel; B, button; Z, zipper. Scale bar = 20 μm. (B) Surface area of individual VE-cadherin–positive structures manually classified as either buttons (punctate and LYVE-1) or zippers (lengthened and LYVE-1+). Student’s t test; each point represents a single junction. (C) Quantification of capillary diameter in skin 5 dpi with VACV (5 × 10⁶ PFU, scarification) treated with either αVEGFR2 (αR2) antibody or isotype control (Iso). One-way ANOVA. (D) Ear thickness measurements in ear skin infected with live (scarification, s.s.; intradermal, i.d.) or heat-inactivated (HI) VACV compared with naive (N) 5 dpi. One-way ANOVA. (E) Representative whole-mount images (maximal projection) of dermal lymphatic vessels in HI or live (s.s. and i.d.) VACV-infected skin 5 dpi. Scale bar = 20 μm. (F) Junctional analysis (average surface area) of dermal lymphatic capillaries from E. One-way ANOVA. Each point represents an individual mouse. (G) Representative whole-mount images of dermal lymphatic capillaries of VACV-infected skin over time. Scale bar = 20 μm. (H) Ear thickness over time in WT mice treated with αR2 antibody or isotype control. One-way ANOVA. (I) Skin viral titers (PFU) 5 dpi of mice treated with VEGFA (αVA) blocking antibody or isotype control. (J) Ear thickness 5 dpi from I. Student’s t test. (K) Representative dermal lymphatic capillaries in mice treated with αVA antibody 5 dpi. Scale bar = 20 μm. (L) Average junctional area from K. Student’s t test. Error bars define SEM; all experiments performed at least twice. *, P < 0.05; **, P < 0.01; ***, P < 0.01; ****, P < 0.0001.
Figure 2.
Figure 2.
VEGFA/VEGFR2 signaling regulates dermal lymphatic capillary zippering. (A) VEGFA levels in skin 5 dpi with VACV (5 × 10⁶, scarification). Student’s t test. (B) VEGFA transcripts detected by in situ hybridization 5 dpi. Scale bar = 50 μm. (C) Representative histogram of VEGFR2 in dermal LECs (CD45CD31+gp38+) and blood endothelial cells (BECs; CD45CD31+gp38). (D) Quantification of VEGFR2 expression from C. Student’s t test. (E) Skin viral titers 5 dpi of mice treated with VEGFR2 (αR2) blocking antibody or isotype control. (F) Ear thickness 5 dpi from B. One-way ANOVA. (G) Representative dermal lymphatic capillaries in mice treated with αR2 antibodies. Scale bar = 20 μm. (H) Average junctional area from G. Each point represents an individual mouse; error bars define SEM; all experiments performed at least twice. *, P < 0.05; ***, P < 0.01; ****, P < 0.0001.
Figure S2.
Figure S2.
Lymphatic-specific loss of VEGFR2. Prox1:CreERT2 mice were crossed with Vegfr2fl/fl to generate lymphatic-specific VEGFR2 knockout animals (Vegfr2iΔProx1). (A) Representative flow plots of VEGFR2 expression in blood (CD45CD31+gp38, BECs), lymphatic (CD45CD31+gp38+, LECs), skin, and LN endothelial cells in Vegfr2iΔProx1 and Vegfr2WT littermate controls. (B and C) Quantification of surface expression of VEGFR2 on dermal BECs (left) and LECs (right; B) and LN BECs (left) and LECs (right; C) from Vegfr2iΔProx1 and Vegfr2WT littermate controls 1 wk after tamoxifen induction. Student’s unpaired t test. FMO, fluorescence minus one. (D) Whole-mount images of lymphatic capillaries and precollector and collector vessels in naive mouse dermis of Vegfr2iΔProx1 or Vegfr2WT littermate controls rested for 2 wk after tamoxifen induction. Red arrowheads indicate collecting vessels and presence of valves. Scale bar = 200 μm. (E) Lymphatic capillary diameter in naive Vegfr2iΔProx1 or Vegfr2WT littermate controls. (F) Representative whole-mount images of lymphatic capillaries Vegfr2iΔProx1 or Vegfr2WT littermate controls. Scale bar = 20 μm. (G) Junctional analysis from F. (H) Lymphatic capillary diameter in Vegfr2iΔProx1 or Vegfr2WT littermate controls 5 d after 5 × 10⁶ PFU of VACV scarification. Student’s t test. Each point represents an individual mouse; all experiments performed at least twice. **, P < 0.01; ****, P < 0.0001.
Figure 3.
Figure 3.
VEGFR2-dependent lymphatic capillary zippering restricts fluid and virion transport. (A) Skin viral titers (PFU) over time in Vegfr2WT and Vegfr2iProx1 mice following VACV infection (5 × 10⁶, scarification). Line, geometric mean; LOD, limit of detection. Student’s t test. (B) Ear thickness over time in Vegfr2WT and Vegfr2iProx1 mice. Two-way ANOVA. (C) HE histology 5 dpi. Scale bar = 100 μm. (D) Epidermal and dermal thickness 5 dpi. (E) Representative dermal lymphatic capillaries in Vegfr2WT and Vegfr2iProx1 mice 5 dpi. Scale bar = 20 μm. (F) Average junctional area from E. Student’s t test. (G) Evans blue (EB) transport to dLNs 5 dpi. Student’s t test. (H) LN titers 5 dpi. Student’s t test. (I) LN titers over time in Vegfr2iProx1 mice. (J) LN titers 5 dpi of Ccr7WT and Ccr7iUBC mice treated with αR2 antibodies. Each point represents an individual mouse; error bars represent SEM; all experiments performed at least twice. *, P > 0.05; **, P < 0.01; ***, P < 0.001; ****, P < 0.0001.
Figure S3.
Figure S3.
VEGFR2 blockade impacts transport and T cell priming during VACV infection. C57Bl/6 mice were infected with 5 × 10⁶ PFU of VACV by skin scarification and administered either isotype control or VEGFR2 antibody (αR2) 0 and 3 dpi. (A) Evans blue (EB) transport to dLNs. Student’s unpaired t test. (B) dLN viral titers. Student’s unpaired t test. (C) Flow histogram demonstrating CCR7 loss following tamoxifen induction in UBC:CreERT2;Ccr7fl/fl (Ccr7iUBC) mice relative to Cre littermate controls (Ccr7WT) on peripheral blood naive CD8+ T cells (CD8+CD44). FMO, fluorescence minus one. (D and E) Total lymphocyte count (D) and total number of H2-Kd B8R20-27-specific CD8+CD44+ T cells (E) 5 dpi. (F) Total number of TCR-Tg OT-I Thy1.1+CD8+ T cells (transfer 15,000, day 0) 5 dpi with VACV-expressing OVA257–264 in mice treated with αR2 or isotype control. Student’s t test. Error bars define SEM. One point represents an individual mouse; all experiments performed at least twice. *, P < 0.05; **, P < 0.01.
Figure 4.
Figure 4.
VEGFR2-dependent lymphatic remodeling promotes antiviral CD8+ T cell expansion. (A) Histograms of photoconverted (Kaede red+) migratory DCs (mDCs; CD3εB220CD11cintMHCIIhi) in dLNs 5 dpi with VACV (5 × 10⁶, scarification) with and without VEGFR2 blockade (αR2). (B) Number of Kaede red+ mDCs per LN. Student’s t test. (C) Lymphocyte counts in draining LNs 5 dpi of Vegfr2WT and Vegfr2iProx1 mice. Student’s t test. (D and E) Representative plots (D) and number of H2-Kd B8R20-27-specific CD8+CD44+ T cells (E) in LNs of Vegfr2WT and Vegfr2iProx1 mice 5 dpi. Student’s t test. (F and G) Representative plots (F) and quantification of BrdU+ LN LECs (CD45CD31+gp38+; G). Student’s t test. (H) Lymphocyte counts in dLNs 5 dpi by intradermal injection of Vegfr2WT and Vegfr2iProx1 mice. Student’s t test. (I and J) Representative flow plots (I) and number of H2-Kd B8R20-27-specific CD8+CD44+ T cells in LN of Vegfr2WT and Vegfr2iProx1 mice 5 dpi by intradermal injection (J). Student’s t test. Each point represents an individual mouse; all experiments performed at least twice. *, P > 0.05; **, P < 0.01.

References

    1. Aggio, J.B., Krmeská V., Ferguson B.J., Wowk P.F., and Rothfuchs A.G.. 2021. Vaccinia virus infection inhibits skin dendritic cell migration to the draining lymph node. J. Immunol. 206:776–784. 10.4049/jimmunol.2000928 - DOI - PMC - PubMed
    1. Angeli, V., Ginhoux F., Llodrà J., Quemeneur L., Frenette P.S., Skobe M., Jessberger R., Merad M., and Randolph G.J.. 2006. B cell-driven lymphangiogenesis in inflamed lymph nodes enhances dendritic cell mobilization. Immunity. 24:203–215. 10.1016/j.immuni.2006.01.003 - DOI - PubMed
    1. Baluk, P., Fuxe J., Hashizume H., Romano T., Lashnits E., Butz S., Vestweber D., Corada M., Molendini C., Dejana E., and McDonald D.M.. 2007. Functionally specialized junctions between endothelial cells of lymphatic vessels. J. Exp. Med. 204:2349–2362. 10.1084/jem.20062596 - DOI - PMC - PubMed
    1. Bowlin, A., Roys H., Wanjala H., Bettadapura M., Venugopal G., Surma J., Simon M.C., and Weinkopff T.. 2021. Hypoxia inducible factor signaling in macrophages promotes lymphangiogenesis in Leishmania major infection. Infect. Immun. 89:e0012421. 10.1128/IAI.00124-21 - DOI - PMC - PubMed
    1. Dejana, E., Orsenigo F., Molendini C., Baluk P., and McDonald D.M.. 2009. Organization and signaling of endothelial cell-to-cell junctions in various regions of the blood and lymphatic vascular trees. Cell Tissue Res. 335:17–25. 10.1007/s00441-008-0694-5 - DOI - PMC - PubMed

Publication types