. 2022 May 1;79(5):498-507.
doi: 10.1001/jamapsychiatry.2022.0407.

Inflammation and Brain Structure in Schizophrenia and Other Neuropsychiatric Disorders: A Mendelian Randomization Study

Collaborators, Affiliations

Inflammation and Brain Structure in Schizophrenia and Other Neuropsychiatric Disorders: A Mendelian Randomization Study

John A Williams et al. JAMA Psychiatry. .

Abstract

Importance: Previous in vitro and postmortem research suggests that inflammation may lead to structural brain changes via activation of microglia and/or astrocytic dysfunction in a range of neuropsychiatric disorders.

Objective: To investigate the relationship between inflammation and changes in brain structures in vivo and to explore a transcriptome-driven functional basis with relevance to mental illness.

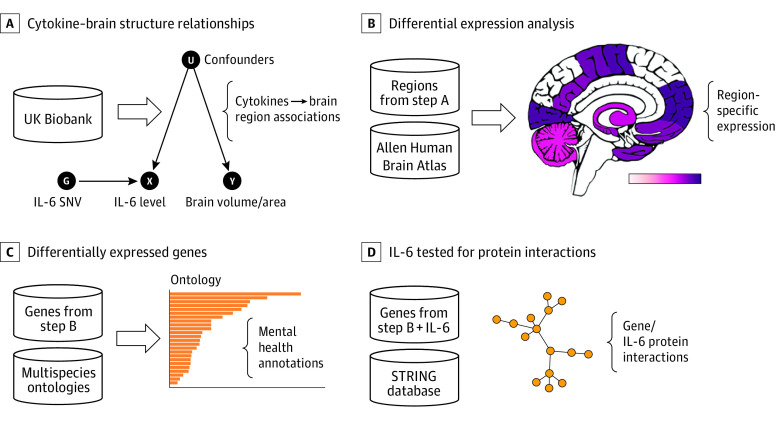
Design, setting, and participants: This study used multistage linked analyses, including mendelian randomization (MR), gene expression correlation, and connectivity analyses. A total of 20 688 participants in the UK Biobank, which includes clinical, genomic, and neuroimaging data, and 6 postmortem brains from neurotypical individuals in the Allen Human Brain Atlas (AHBA), including RNA microarray data. Data were extracted in February 2021 and analyzed between March and October 2021.

Exposures: Genetic variants regulating levels and activity of circulating interleukin 1 (IL-1), IL-2, IL-6, C-reactive protein (CRP), and brain-derived neurotrophic factor (BDNF) were used as exposures in MR analyses.

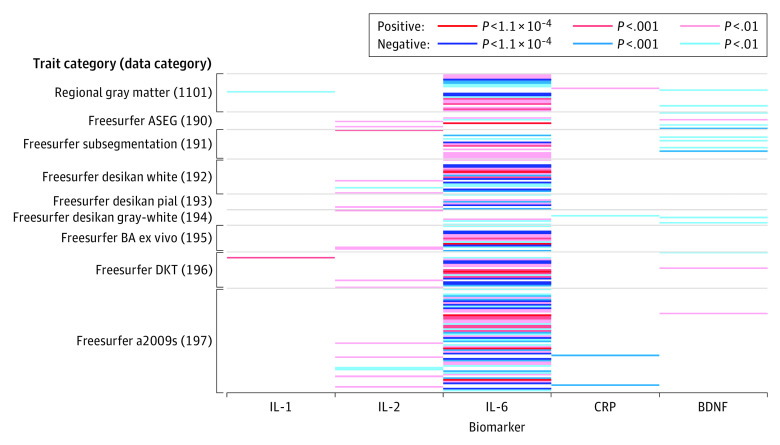
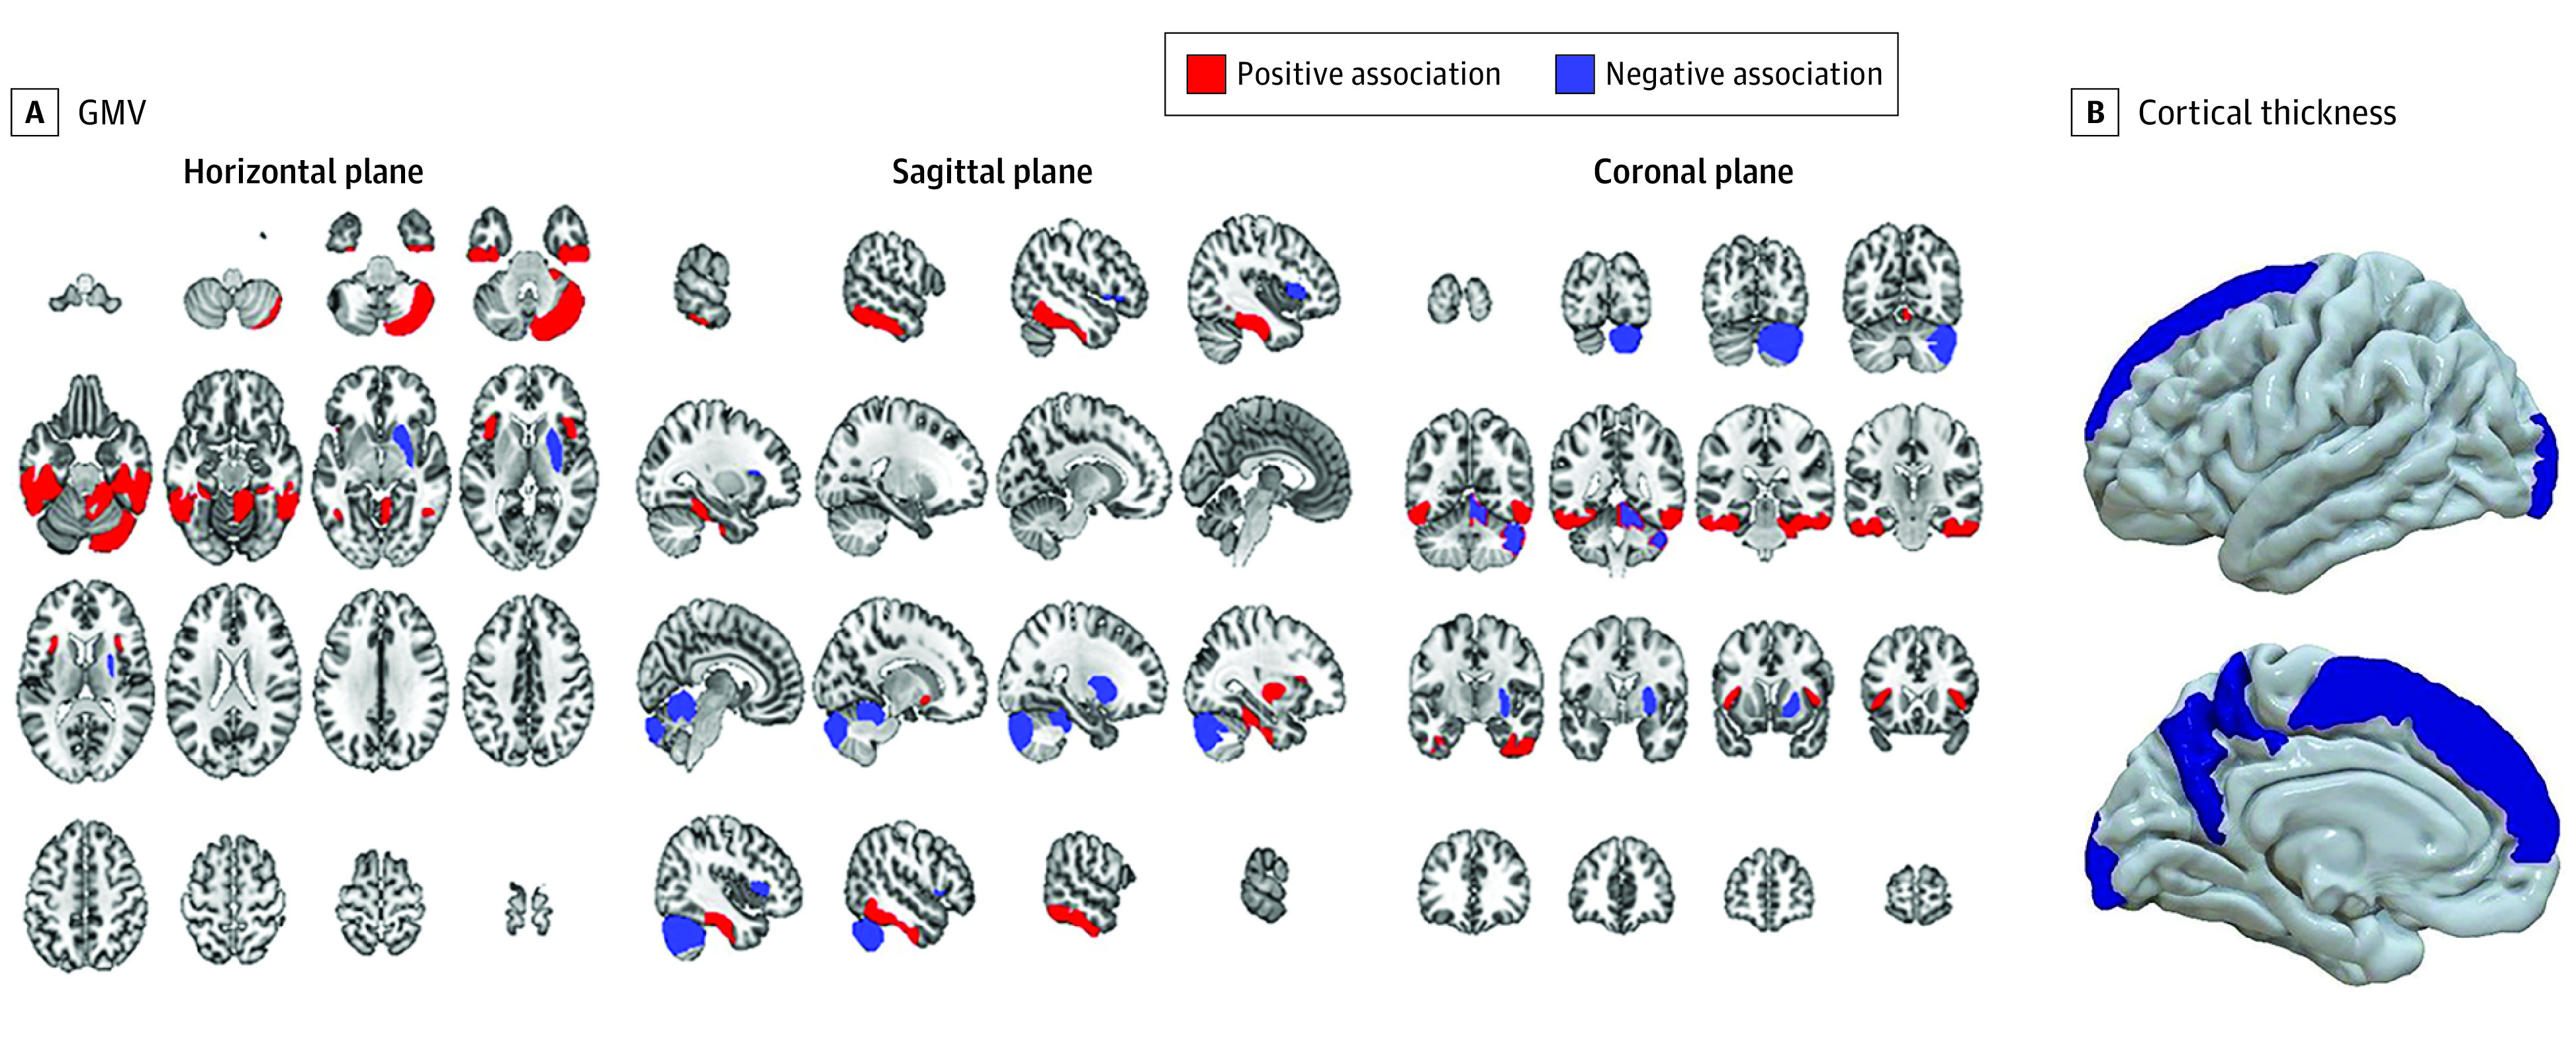
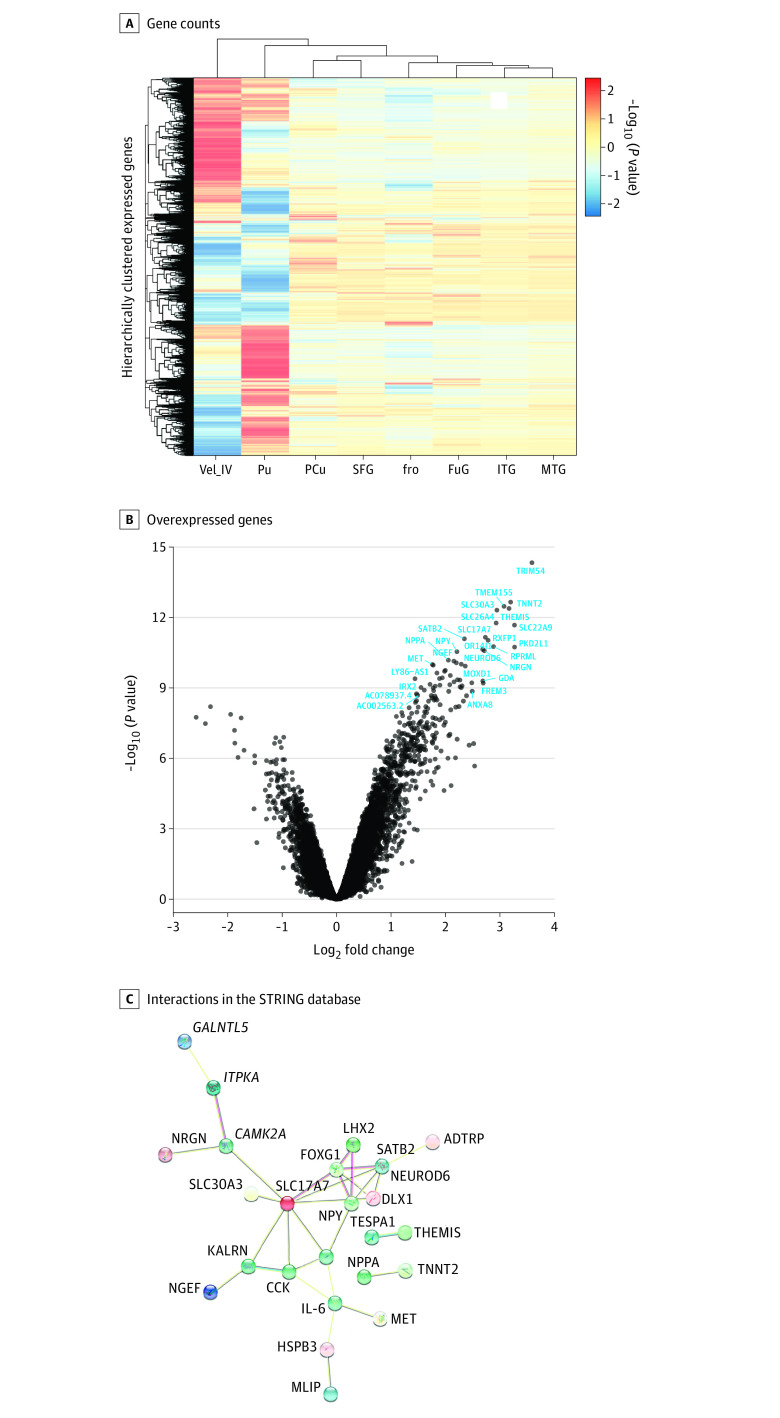
Main outcomes and measures: Brain imaging measures, including gray matter volume (GMV) and cortical thickness (CT), were used as outcomes. Associations were considered significant at a multiple testing-corrected threshold of P < 1.1 × 10⁻⁴. Differential gene expression in AHBA data was modeled in brain regions mapped to areas significant in MR analyses; genes were tested for biological and disease overrepresentation in annotation databases and for connectivity in protein-protein interaction networks.

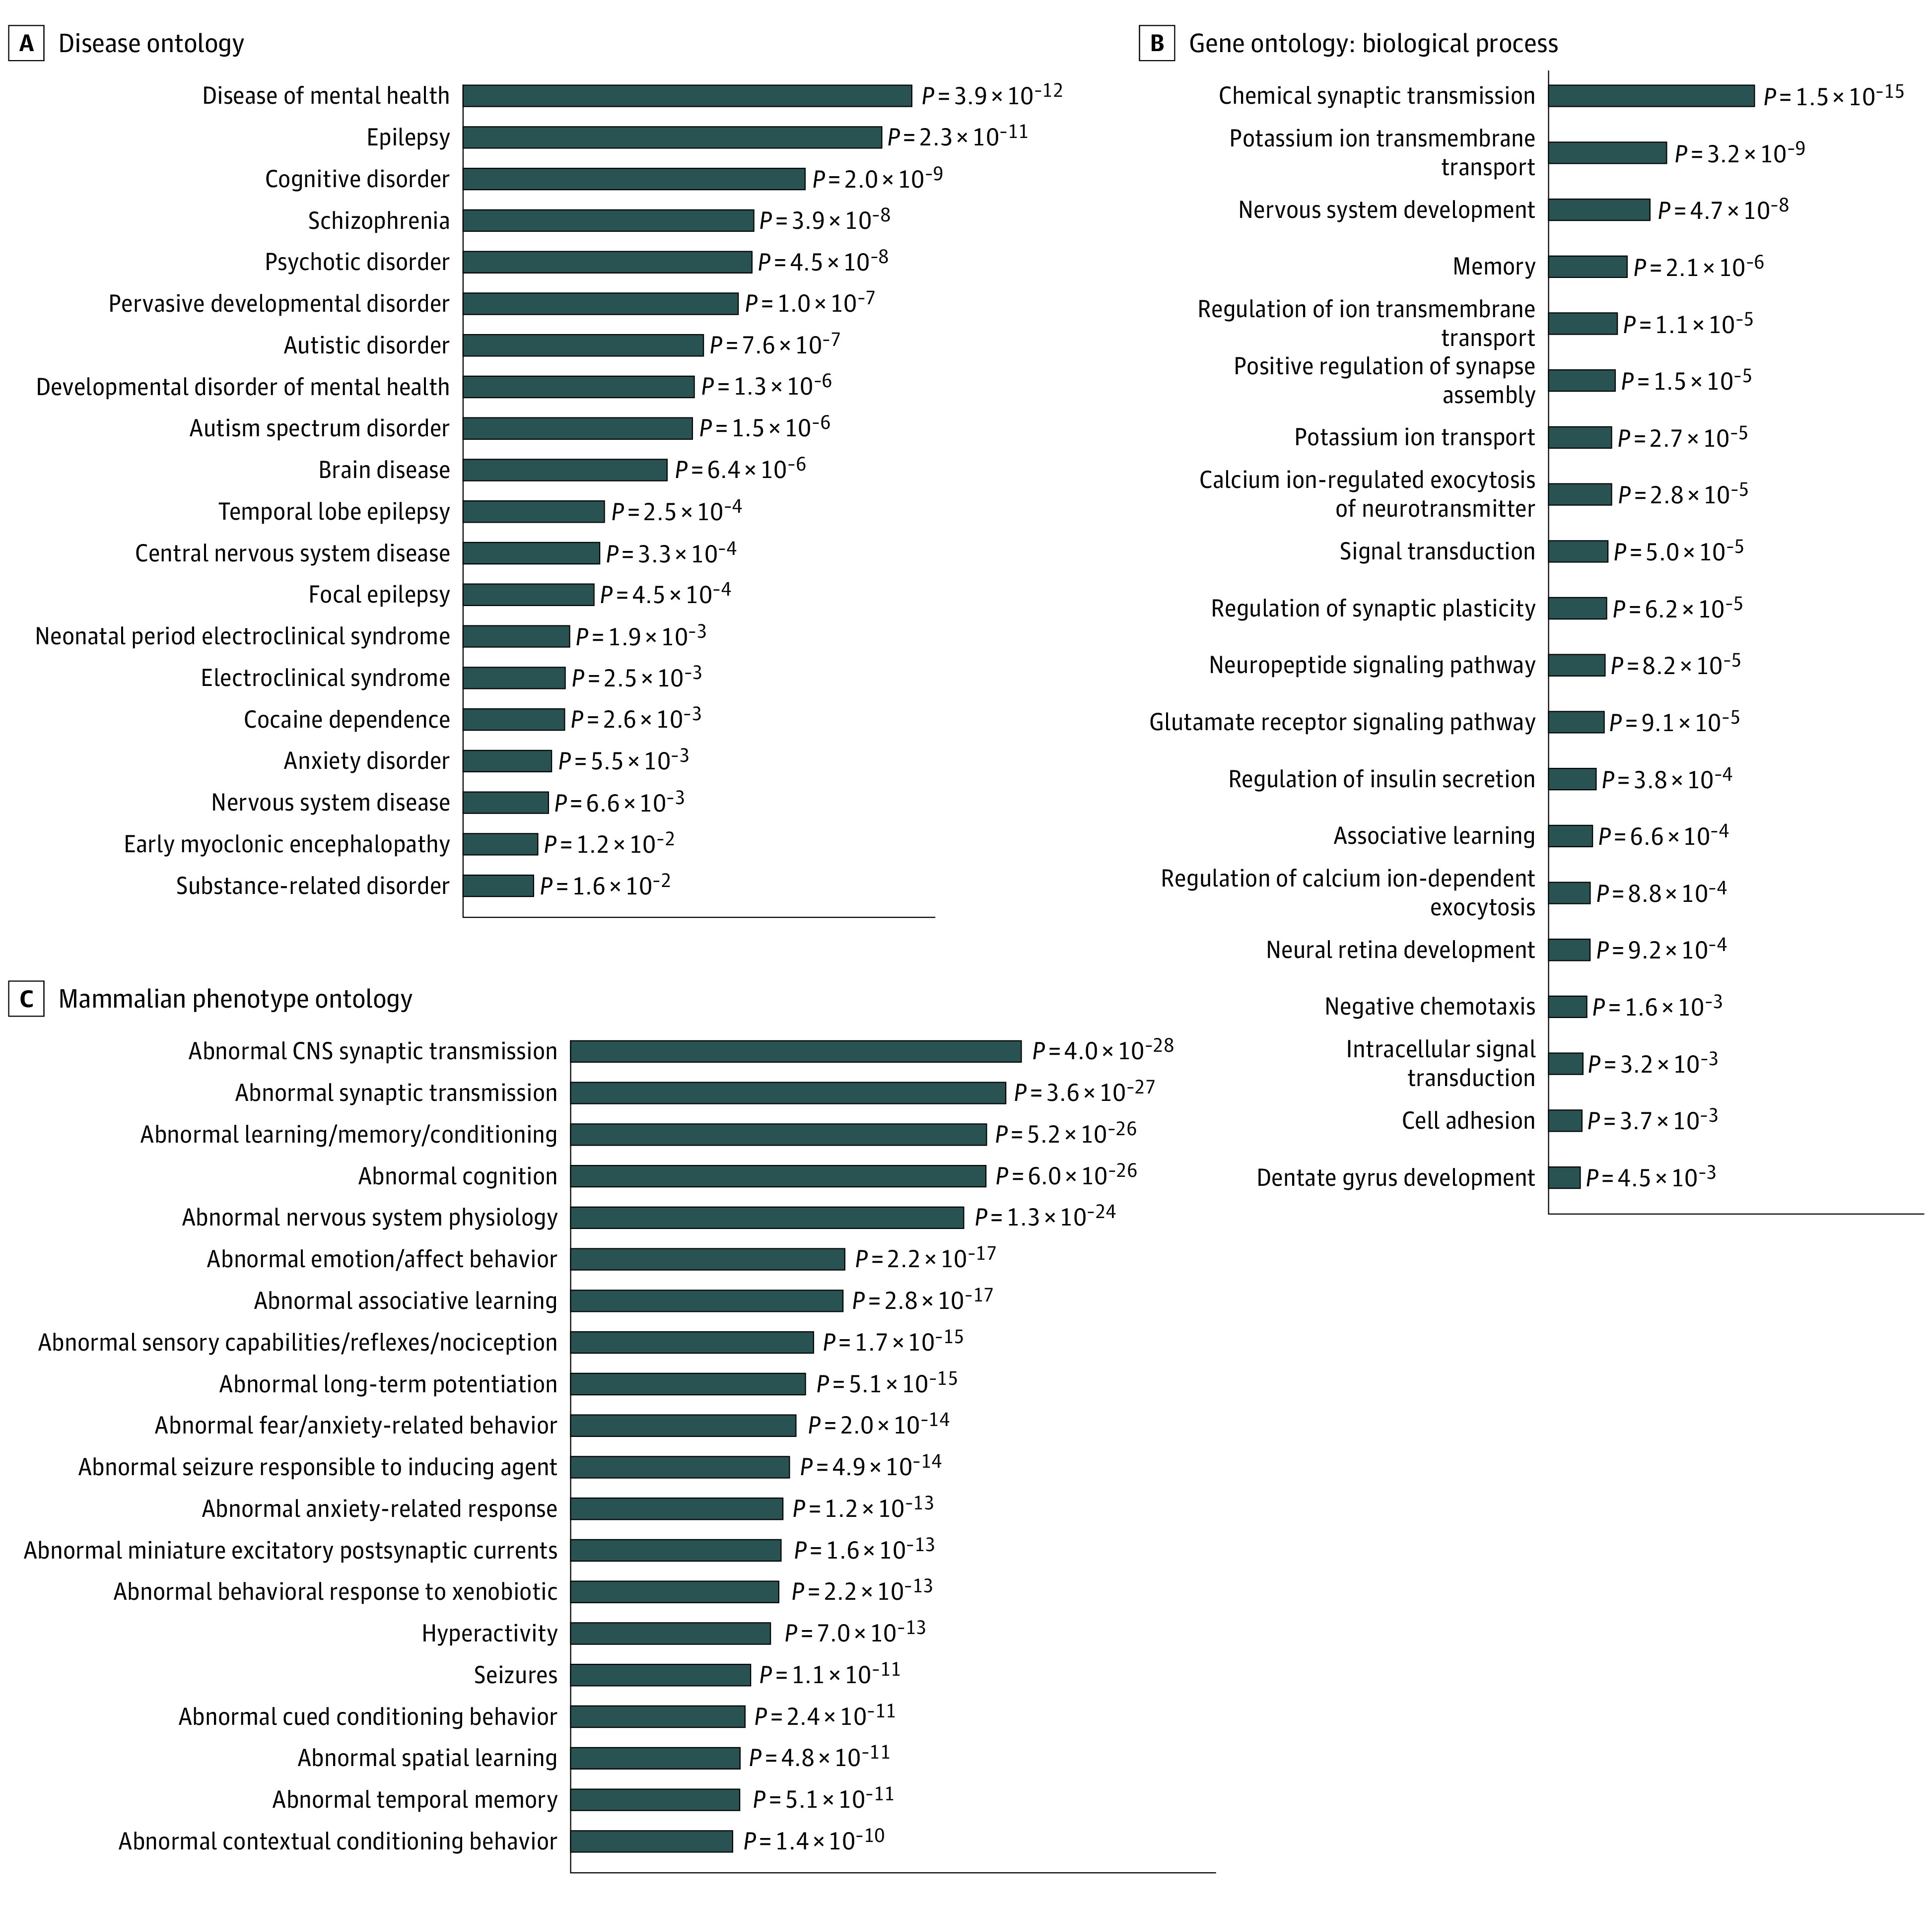
Results: Of 20 688 participants in the UK Biobank sample, 10 828 (52.3%) were female, and the mean (SD) age was 55.5 (7.5) years. In the UK Biobank sample, genetically predicted levels of IL-6 were associated with GMV in the middle temporal cortex (z score, 5.76; P = 8.39 × 10⁻⁹), inferior temporal (z score, 3.38; P = 7.20 × 10⁻⁵), fusiform (z score, 4.70; P = 2.60 × 10⁻⁷), and frontal (z score, -3.59; P = 3.30 × 10⁻⁵) cortex together with CT in the superior frontal region (z score, -5.11; P = 3.22 × 10⁻⁷). No significant associations were found for IL-1, IL-2, CRP, or BDNF after correction for multiple comparison. In the AHBA sample, 5 of 6 participants (83%) were male, and the mean (SD) age was 42.5 (13.4) years. Brain-wide coexpression analysis showed a highly interconnected network of genes preferentially expressed in the middle temporal gyrus (MTG), which further formed a highly connected protein-protein interaction network with IL-6 (enrichment test of expected vs observed network given the prevalence and degree of interactions in the STRING database: 43 nodes/30 edges observed vs 8 edges expected; mean node degree, 1.4; genome-wide significance, P = 4.54 × 10⁻⁹). MTG differentially expressed genes that were functionally enriched for biological processes in schizophrenia, autism spectrum disorder, and epilepsy.

Conclusions and relevance: In this study, genetically determined IL-6 was associated with brain structure and potentially affects areas implicated in developmental neuropsychiatric disorders, including schizophrenia and autism.


Conflict of interest statement

Conflict of Interest Disclosures: Dr Wood has received grants from Medical Research Council during the conduct of the study. Dr Barnes is a director and shareholder of Celentyx Ltd. Dr Neill has received personal fees from Lundbeck outside the submitted work. Dr Deakin has received grants from the Medical Research Council during the conduct of the study as well as personal fees from Autifony Therapeutics and P1Vital outside the submitted work. Dr Upthegrove has received grants from the Medical Research Council during the conduct of the study; grants from the National Institute for Health Research, National Institute for Mental Health, and European Commission Seventh Framework Programme; and personal fees from Vyvalife and Sunovion outside the submitted work. No other disclosures were reported.

Figures

Figure 1.
Figure 1.. Study Workflow
Each panel contains data (cylinders) input into processes, resulting in associations (brackets). A, Cytokine–brain structure associations were investigated with mendelian randomization. B, Differential expression analysis was performed between the whole brain and brain regions with interleukin 6 (IL-6) associations. C, Differentially expressed genes were enriched for functional and disease characteristics. D, IL-6 was tested for protein interactions in the STRING protein-protein interaction database version 11 (STRING Consortium) with differentially expressed genes. SNV indicates single-nucleotide variant.
Figure 2.
Figure 2.. Heat Map of Associations Between Genetically Predicted Inflammatory Biomarkers and Brain Imaging Measures
Brain imaging measures from UK Biobank, with data categories from the UK Biobank Brain Imaging Catalogue, and their association with inflammatory biomarkers are shown. Brain imaging measures having no associated inflammatory biomarkers at P < .01 are omitted from presentation; only the 166 measures with at least 1 associated biomarker are plotted. BDNF indicates brain-derived neurotrophic factor; CRP, C-reactive protein; IL-1, interleukin 1; IL-2, interleukin 2; IL-6, interleukin 6.
Figure 3.
Figure 3.. Brain Imaging Measures Associated With Genetically Predicted Levels of Interleukin 6 and Interleukin 6 Receptor Through Mendelian Randomization
A, Genetic association of interleukin 6 and its receptor with gray matter volume (GMV) (Harvard-Oxford cortical and subcortical atlas and probabilistic mendelian randomization atlas of the human cerebellum): middle temporal gyrus, temporooccipital part (right: z score, 5.76; P = 8.40 × 10−9), and temporal fusiform cortex, posterior division (right: z score, 4.70; P = 2.60 × 10−7; left: z score, 4.20; P = 2.67 × 10−6), at a multiple testing–corrected threshold of P < 1.1 × 10−4. Additional measures with P < .001 include the inferior temporal gyrus, posterior divisions (right: z score, 3.38; P = 7.20 × 10−5; left: z score, 3.73; P = 1.90 × 10−5), frontal operculum cortex (right: z score, −3.59; P = 3.30 × 10−5), putamen (right: z score, −3.78; P = 1.60 × 10−5), and regions I to IV of the cerebellum vermus (right: z score, −3.64; P = 2.70 × 10−5). B, Cortical thickness (Destrieux cortical atlas): frontal superior (left: z score, −5.11; P = 3.22 × 10−7). Additional measures with P < .001 include the G-precuneus (left: z score, −3.59; P = 3.30 × 10−5), pole-occipital (left: z score, −3.61; P = 3.10 × 10−5), S-parieto-occipital (left: z score, −3.34; P = 8.40 × 10−5), and S-pericallosal (right: z score, 3.32; P = 9.00 × 10−5). Estimates are reported as z scores, where a positive z score represents that genetically predicted levels of the biomarker were positively associated with the brain imaging measure. Red color denotes a positive association and blue color denotes a negative association. See the eDiscussion in Supplement 1 for further details.
Figure 4.
Figure 4.. Genes Differentially Overexpressed in the Middle Temporal Gyrus (MTG) and Interleukin 6
A, z Score normalized mean gene counts in each region of interest show little within-region variation within genes expressed in the MTG compared with other regions, particularly compared with the cerebellar regions, which show pronounced variation compared with the whole brain. Each row represents one gene’s expression. B, Compared with the whole brain (mean non-MTG values), 47 genes were highly overexpressed (false discovery rate–corrected P < .05; log-fold change >2) in the MTG specifically. C, Protein products of these genes plus interleukin 6 were highly enriched for interactions (connectivity P = 4.54 × 10−9) compared with the frequency of interactions in the STRING database, as measured in the sum of unweighted degrees in the network. Edge colors represent different evidence underlying predicted protein-protein interactions in the STRING database. Images within spheres represent known protein structures; node color is aesthetic. fro Indicates operculum; FuG, fusiform gyrus; ITG, inferior temporal gyrus; MTG, middle temporal gyrus; PCu, precuneus; Pu, putamen; SFG, superior frontal gyrus; Vel_IV, cerebellar vermis.
Figure 5.
Figure 5.. Association of Genes Overexpressed in the Middle Temporal Gyrus (MTG) and Brain Disorders
A and B, Genes significantly overexpressed in the MTG were enriched for psychiatric diseases and neurological biological processes in annotations to the disease ontology and biological process domain of the gene ontology, respectively. C, Their mammalian orthologs were enriched for neurological and behavioral phenotypes present in the Mouse Genome Database. For each database, hypergeometric tests were performed comparing the frequency of ontology entity annotations for MTG-expressed genes vs genes available in the Allen Human Brain Atlas datasets. All P values are false discovery rate–adjusted. The top 20 most highly enriched results for each ontology are shown.

References

    1. Kappelmann N, Arloth J, Georgakis MK, et al. . Dissecting the association between inflammation, metabolic dysregulation, and specific depressive symptoms: a genetic correlation and 2-sample mendelian randomization study. JAMA Psychiatry. 2021;78(2):161-170. doi:10.1001/jamapsychiatry.2020.3436 - DOI - PMC - PubMed
    1. Corsi-Zuelli F, Deakin B. Impaired regulatory T cell control of astroglial overdrive and microglial pruning in schizophrenia. Neurosci Biobehav Rev. 2021;125:637-653. doi:10.1016/j.neubiorev.2021.03.004 - DOI - PubMed
    1. Khandaker GM, Zimbron J, Dalman C, Lewis G, Jones PB. Childhood infection and adult schizophrenia: a meta-analysis of population-based studies. Schizophr Res. 2012;139(1-3):161-168. doi:10.1016/j.schres.2012.05.023 - DOI - PMC - PubMed
    1. Khandaker GM, Zimbron J, Lewis G, Jones PB. Prenatal maternal infection, neurodevelopment and adult schizophrenia: a systematic review of population-based studies. Psychol Med. 2013;43(2):239-257. doi:10.1017/S0033291712000736 - DOI - PMC - PubMed
    1. Brown AS, Derkits EJ. Prenatal infection and schizophrenia: a review of epidemiologic and translational studies. Am J Psychiatry. 2010;167(3):261-280. doi:10.1176/appi.ajp.2009.09030361 - DOI - PMC - PubMed

Publication types