. 2022 Mar 30;117(1):16.
doi: 10.1007/s00395-022-00927-6.

P2Y12-dependent activation of hematopoietic stem and progenitor cells promotes emergency hematopoiesis after myocardial infarction

Affiliations

P2Y12-dependent activation of hematopoietic stem and progenitor cells promotes emergency hematopoiesis after myocardial infarction

Hana Seung et al. Basic Res Cardiol. .

Abstract

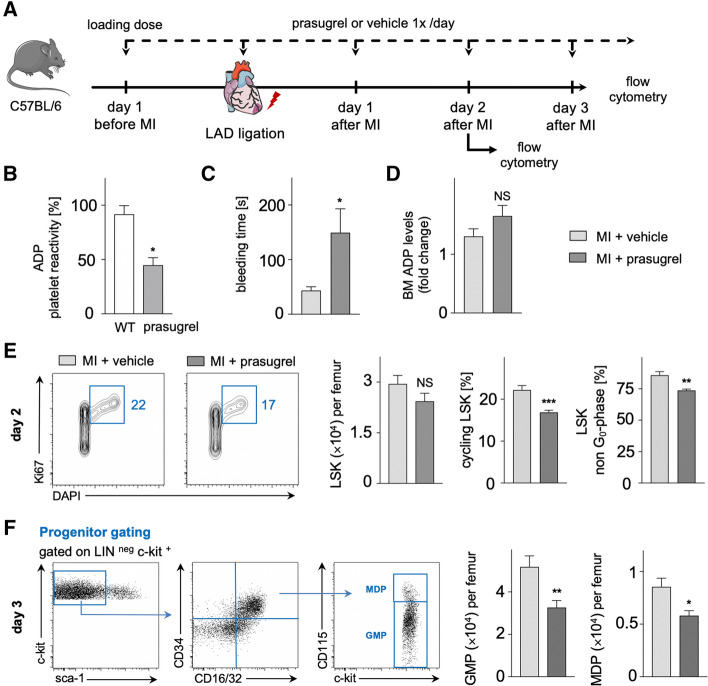
Emergency hematopoiesis is the driving force of the inflammatory response to myocardial infarction (MI). Increased proliferation of hematopoietic stem and progenitor cells (LSK) after MI enhances cell production in the bone marrow (BM) and replenishes leukocyte supply for local cell recruitment to the infarct. Decoding the regulation of the inflammatory cascade after MI may provide new avenues to improve post-MI remodeling. In this study, we describe the influence of adenosine diphosphate (ADP)-dependent P2Y12-mediated signaling on emergency hematopoiesis and cardiac remodeling after MI. Permanent coronary ligation was performed to induce MI in a murine model. BM activation, inflammatory cell composition and cardiac function were assessed using global and platelet-specific gene knockout and pharmacological inhibition models for P2Y12. Complementary in vitro studies allowed for investigation of ADP-dependent effects on LSK cells. We found that ADP acts as a danger signal for the hematopoietic BM and fosters emergency hematopoiesis by promoting Akt phosphorylation and cell cycle progression. We were able to detect P2Y12 in LSK, implicating a direct effect of ADP on LSK via P2Y12 signaling. P2Y12 knockout and P2Y12 inhibitor treatment with prasugrel reduced emergency hematopoiesis and the excessive inflammatory response to MI, translating to lower numbers of downstream progeny and inflammatory cells in the blood and infarct. Ultimately, P2Y12 inhibition preserved cardiac function and reduced chronic adverse cardiac remodeling after MI. P2Y12-dependent signaling is involved in emergency hematopoiesis after MI and fuels post-ischemic inflammation, proposing a novel, non-canonical value for P2Y12 antagonists beyond inhibition of platelet-mediated atherothrombosis.

Keywords: ADP; Hematopoiesis; Inflammation; Myocardial infarction; P2Y12 receptor.


Conflict of interest statement

The authors declare that they have no financial or non-financial interests to disclose.

Figures

Fig. 1
Fig. 1
A Timeline of ADP levels in the bone marrow and plasma, assessed by ELISA on day 1, 2 and 3 after MI in comparison to sham-operated C57BL/6 mice (n = 12–40 per group; Kruskal–Wallis test for BM, one-way ANOVA for plasma). B CFU-assay performed with flushed bone marrow cells from C57BL/6 WT mice after CD41 depletion. Bar graphs illustrate macroscopic colony count (n = 6–8 per group; Mann–Whitney test) and microscopic colony area per field of view (FOV) in % (n = 60–77 per group; Mann–Whitney test). Scale bar indicates 500 µm. C Relative expression of the ADP receptor P2Y12 in different cell types, evaluated by qPCR from bone marrow cell populations sorted by FACS under CD41 exclusion (n = 6 per group; Kruskal–Wallis test). D Platelet-specific markers GPIab, GPV, GPVI and ITGB3 from FACS-sorted LSK cells, evaluated by qPCR and shown as fold change (n = 4 per group; Mann–Whitney test). E CFU-assay performed with FACS-sorted LSK cells after exclusion of CD41+ cells. The bar graph illustrates microscopic colony area per FOV in % (n = 30 per group; student's t test). Scale bar indicates 500 µm. F Timeline of Akt signaling pathway activation in LSK cells in vitro, assessed by flow cytometry 0 min, 30 min, 60 min, 120 min and 240 min after ADP (1 µM) stimulation compared to control (no ADP), shown as fold change of phospho-Akt to pan-Akt ratio (n = 2–3 per group). G Histograms illustrates Akt signaling pathway activation in LSK cells in vitro 60 min after ADP (1 µM) stimulation in C57BL/6 wildtype (WT) (left) and P2Y12−/− mice (right) in comparison to unstained control (light grey). Bar graphs show phospho-Akt to pan-Akt ratio in LSK from WT and P2Y12 −/− mice (n = 5 per group; Mann–Whitney test). Mean ± S.E.M., *p < 0.05, **p < 0.01, ***p < 0.001, ****p < 0.0001
Fig. 2
Fig. 2
A CFU-assay performed with flushed bone marrow cells from C57BL/6 P2Y12−/− mice after CD41 depletion. Bar graphs illustrate macroscopic colony count (n = 8 per group; student’s t test) and microscopic colony area per field of view (FOV) in % (n = 78–80 per group; Mann–Whitney test). Scale bar indicates 500 µm. B Flow cytometric gating for LSK cells. C Cell cycle analysis performed with Ki67 / DAPI assay in C57BL/6 WT and P2Y12−/− mice on day 2 after MI. Bar graphs show absolute numbers of LSK cells per femur, LSK cycling and non G0-phase rates in % on day 2 after MI (n = 7–12 per group; Mann–Whitney test). Mean ± S.E.M., *p < 0.05, **p < 0.01
Fig. 3
Fig. 3
A Schematic illustration of the experimental setup. After establishing P2Y12 receptor inhibition by a loading dose of prasugrel, LAD was ligated for MI and analysis was performed on day 2 and 3 after MI as shown. B Platelet reactivity after 2 days of oral prasugrel treatment in comparison to wildtype, measured by light transmission aggregometry (n = 4 per group; Mann–Whitney test). C Bleeding time under prasugrel treatment versus vehicle control (n = 6 per group; Mann–Whitney test). D ADP levels in the BM on day 2 after MI in prasugrel-treated C57BL/6 mice compared to vehicle control, assessed by ELISA (n = 10 per group; unpaired t test). E Cell cycle analysis of LSK cells performed with Ki67/DAPI assay in prasugrel-treated C57BL/6 mice in comparison to vehicle control. Bar graphs show LSK cell numbers per femur, LSK cycling rates and portion of LSK in G2/S/M phase (non G0) in % on day 2 after MI (n = 7–11 per group; student’s t test for LSK cell numbers per femur and LSK cycling rates, Mann–Whitney test for LSK non G0-phase). F Flow cytometric gating for downstream hematopoietic progenitor populations GMP and MDP. Bar graphs show GMP and MDP numbers per femur in prasugrel-treated C57BL/6 mice in comparison to vehicle control on day 3 after MI (n = 16–19 per group; student’s t test). Mean ± S.E.M., *p < 0.05, **p < 0.01, ***p < 0.001
Fig. 4
Fig. 4
A Flow cytometric gating for B-lymphocytes, myeloids, neutrophils and Ly6C high monocytes in the blood. B Effects of P2Y12 receptor blocker prasugrel on blood leukocytes on day 3 after MI (n = 8–9 per group; unpaired t test). Bar graphs display cell counts per µl blood. C Flow cytometric gating for myeloids, neutrophils, monocytes and macrophages in the infarcted myocardium. D Leukocytes and subsets in the infarcted myocardium on day 7 after MI in prasugrel-treated C57BL/6 mice compared to vehicle control, assessed by flow cytometry (n = 6–7 per group; Mann–Whitney test). Bar graphs show cell counts per g of infarcted myocardium. Mean ± S.E.M., *p < 0.05, **p < 0.01
Fig. 5
Fig. 5
A Schematic illustration of the experimental setup. C57/BL/6-Tg (UBC-GFP) mice were lethally irradiated and reconstituted with PF4(P2Y12fl/fl) BM cells to create P2Y12(plt)−/− GFP chimeras. After 16 weeks, LAD was ligated for MI and analysis was performed on day 3 after MI as shown. B Residual GFP+ platelets in P2Y12(plt)−/− GFP chimeras compared to GFP WT recipients. C Proliferation analysis of LSK cells in prasugrel-treated P2Y12(plt)−/− GFP chimeras in comparison to vehicle control. Bar graphs show the portion of LSK cells in G1/G2/S/M phase (non G0) in % and numbers of LSK cells in non G0 phase per femur on day 3 after MI (n = 5–6 per group; Mann–Whitney test). D Effects of P2Y12 receptor blocker prasugrel on blood leukocytes on day 3 after MI in P2Y12(plt)−/− GFP chimeras (n = 6 per group; Mann–Whitney test). Bar graphs display cell count per µl blood. E Leukocytes and Ly6Chigh monocytes in the infarcted myocardium on day 3 after MI in prasugrel-treated P2Y12(plt)−/− GFP chimeras in comparison to vehicle control, assessed by flow cytometry (n = 6 per group; Mann–Whitney test). Bar graphs show cell counts per g of infarcted myocardium. Mean ± S.E.M., *p < 0.05
Fig. 6
Fig. 6
A Evaluation of cardiac function and volumes by echocardiography day 1 and day 21 after MI in C57BL/6 mice under prasugrel treatment compared to vehicle control until day 7 after MI. Depicted are end-systolic parasternal long axis views in B-mode. Scale bar indicates 1 mm. Bar graphs show troponin I levels in plasma on day 1 after MI, evaluated by ELISA (n = 7–8 per group, Mann–Whitney test), left ventricular ejection fraction (LV-EF in %) on day 1 after MI (n = 7–8 per group, Mann–Whitney test) and delta changes in left ventricular ejection fraction, end-systolic and end-diastolic volumes (∆ LV-EF in %, ∆ ESV and EDV in µl) between day 1 and day 21 after MI (n = 7−8 per group, Mann–Whitney test) in prasugrel-treated C57BL/6 mice compared to vehicle control. B Immunohistochemistry for CD11b of the infarcted myocardium (border zone) on day 7 after MI. Scale bar indicates 50 µm. Bar graphs show percentages of the positive area for CD11b in the infarcted area per field of view in % (n = 6–8 per group; Mann–Whitney test). C TNF α, IL-1β, MMP9 and TIMP in the infarcted myocardium (border zone) on day 7 after MI in C57BL/6 mice under prasugrel treatment compared to vehicle control, evaluated by qPCR (n = 4–16 per group; unpaired t test for TNF α, IL-1β, MMP9, Mann–Whitney test for TIMP). D Immunohistochemistry for CD31 of the infarcted myocardium (border zone) on day 7 after MI. Scale bar indicates 50 µm. Bar graphs show percentages of the positive area for CD31 in the infarcted area per field of view in % (n = 5–8 per group; Mann–Whitney test). E Masson’s Trichrome staining of the infarcted myocardium (border zone) on day 21 after MI. Scale bar indicates 100 µm. Bar graphs show percentages of collagen in the infarcted area per mm2 (n = 7–8 per group; Mann–Whitney test). Mean ± S.E.M., *p < 0.05, **p < 0.01
Fig. 7
Fig. 7
Summary

References

    1. Adamiak M, Bujko K, Thapa A, Pensato V, Brzezniakiewicz-Janus K, Ratajczak J, Davies DL, Ulrich H, Kucia M, Ratajczak MZ. The P2X4 purinergic receptor has emerged as a potent regulator of hematopoietic stem/progenitor cell mobilization and homing-a novel view of P2X4 and P2X7 receptor interaction in orchestrating stem cell trafficking. Leukemia. 2022;36:248–256. doi: 10.1038/s41375-021-01352-9. - DOI - PubMed
    1. Armstrong D, Summers C, Ewart L, Nylander S, Sidaway JE, van Giezen JJ. Characterization of the adenosine pharmacology of ticagrelor reveals therapeutically relevant inhibition of equilibrative nucleoside transporter 1. J Cardiovasc Pharm Ther. 2014;19:209–219. doi: 10.1177/1074248413511693. - DOI - PubMed
    1. Baldridge MT, King KY, Boles NC, Weksberg DC, Goodell MA. Quiescent haematopoietic stem cells are activated by IFN-gamma in response to chronic infection. Nature. 2010;465:793–797. doi: 10.1038/nature09135. - DOI - PMC - PubMed
    1. CAPRIE SC, A randomised, blinded, trial of clopidogrel versus aspirin in patients at risk of ischaemic events (CAPRIE) CAPRIE Steer Comm Lancet. 1996;348:1329–1339. doi: 10.1016/s0140-6736(96)09457-3. - DOI - PubMed
    1. Charo IF, Ransohoff RM. The many roles of chemokines and chemokine receptors in inflammation. N Engl J Med. 2006;354:610–621. doi: 10.1056/NEJMra052723. - DOI - PubMed

Publication types