. 2022 Mar 30;14(638):eabl6328.
doi: 10.1126/scitranslmed.abl6328. Epub 2022 Mar 30.

A PI3Kγ mimetic peptide triggers CFTR gating, bronchodilation, and reduced inflammation in obstructive airway diseases

Affiliations

A PI3Kγ mimetic peptide triggers CFTR gating, bronchodilation, and reduced inflammation in obstructive airway diseases

Alessandra Ghigo et al. Sci Transl Med. .

Abstract

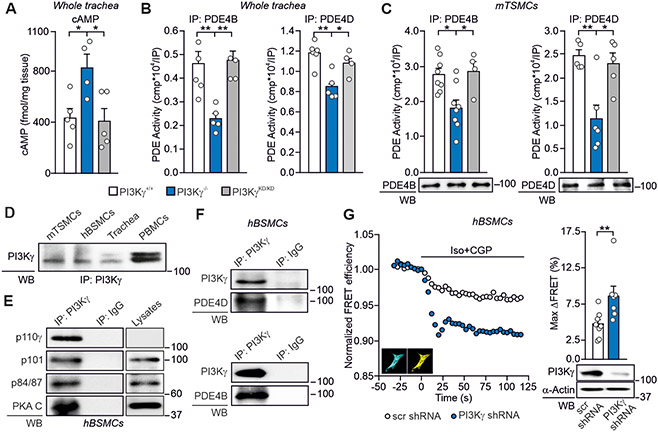
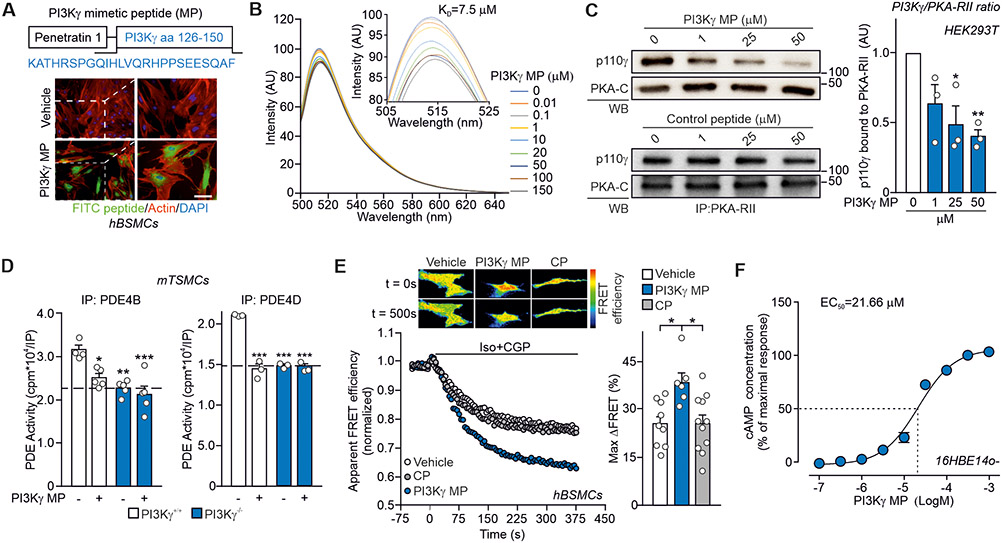
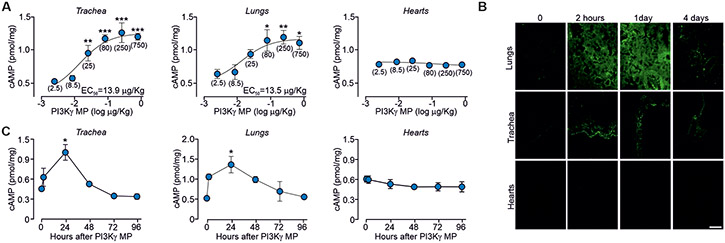
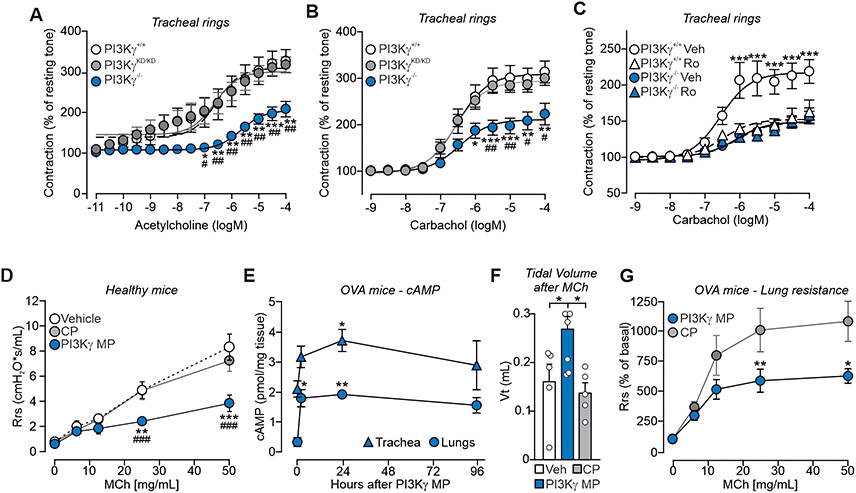
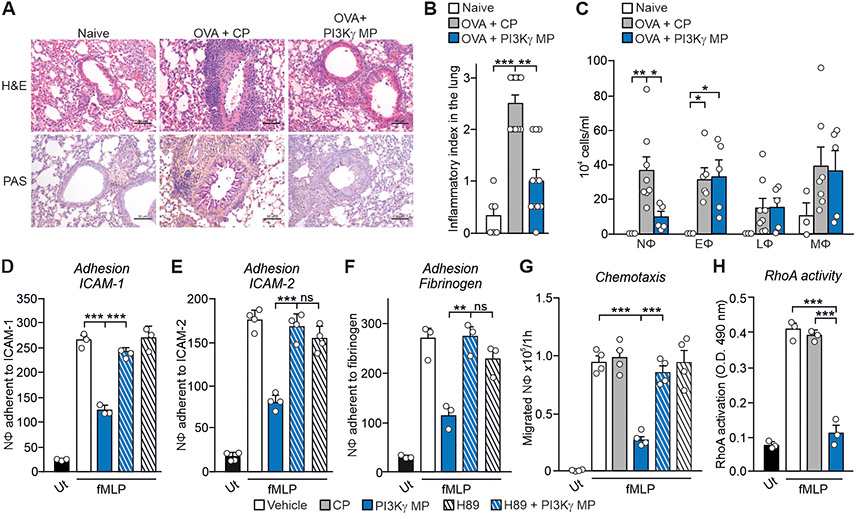
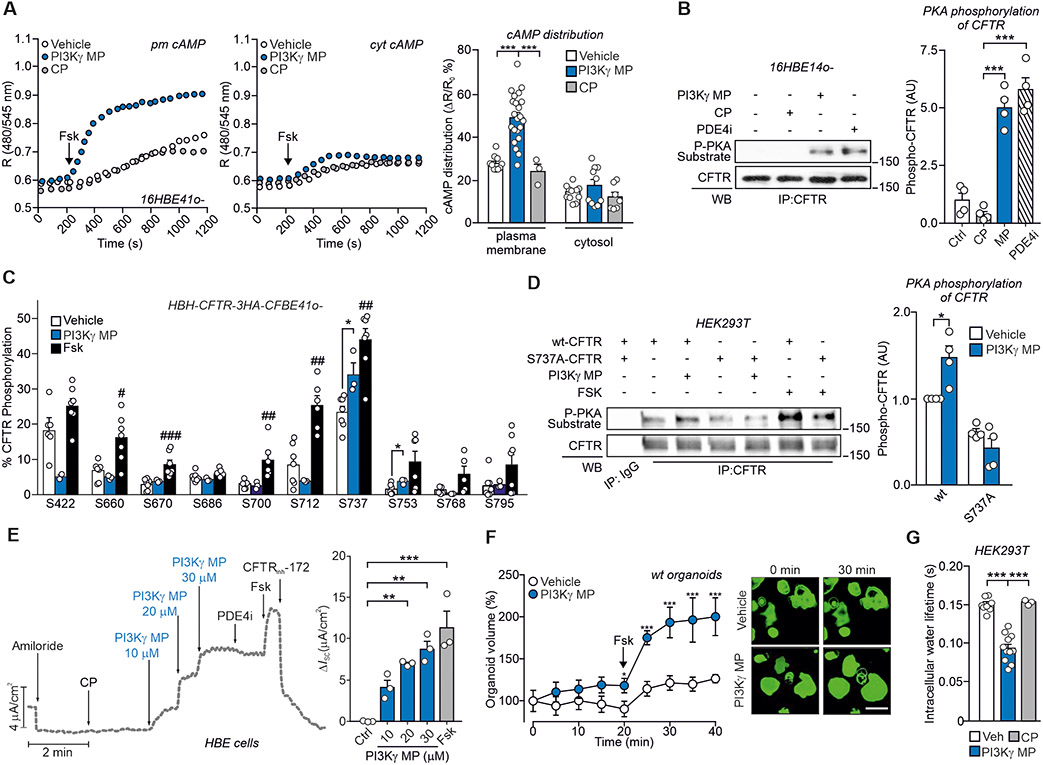
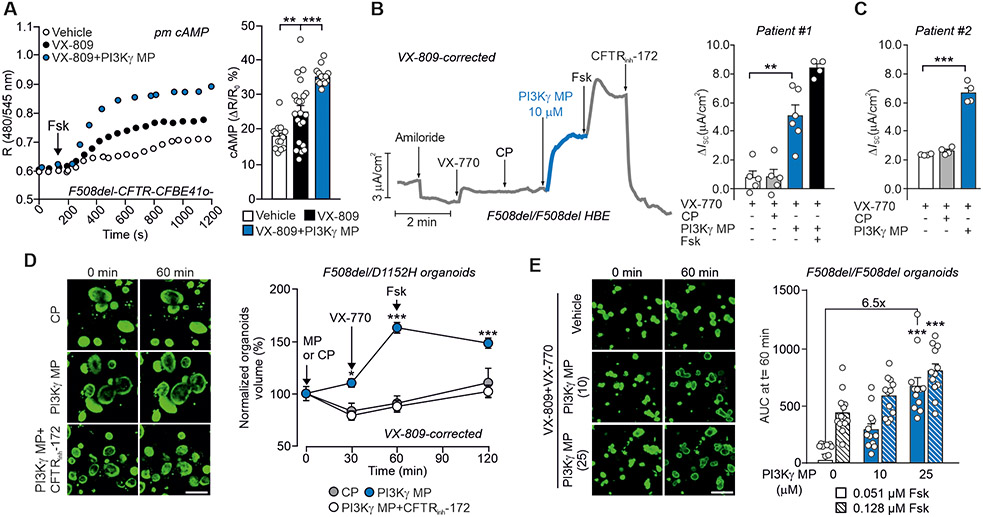
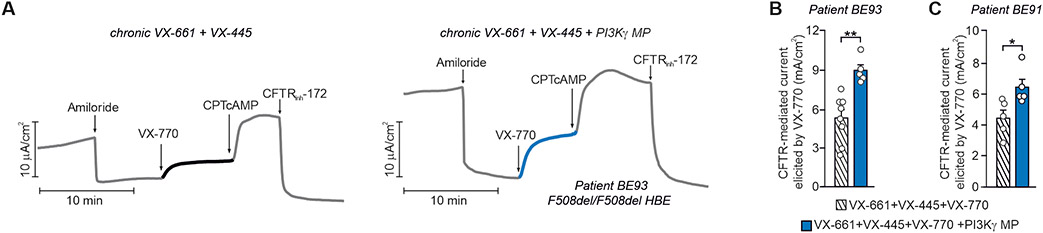
Cyclic adenosine 3',5'-monophosphate (cAMP)-elevating agents, such as β2-adrenergic receptor (β2-AR) agonists and phosphodiesterase (PDE) inhibitors, remain a mainstay in the treatment of obstructive respiratory diseases, conditions characterized by airway constriction, inflammation, and mucus hypersecretion. However, their clinical use is limited by unwanted side effects because of unrestricted cAMP elevation in the airways and in distant organs. Here, we identified the A-kinase anchoring protein phosphoinositide 3-kinase γ (PI3Kγ) as a critical regulator of a discrete cAMP signaling microdomain activated by β2-ARs in airway structural and inflammatory cells. Displacement of the PI3Kγ-anchored pool of protein kinase A (PKA) by an inhaled, cell-permeable, PI3Kγ mimetic peptide (PI3Kγ MP) inhibited a pool of subcortical PDE4B and PDE4D and safely increased cAMP in the lungs, leading to airway smooth muscle relaxation and reduced neutrophil infiltration in a murine model of asthma. In human bronchial epithelial cells, PI3Kγ MP induced unexpected cAMP and PKA elevations restricted to the vicinity of the cystic fibrosis transmembrane conductance regulator (CFTR), the ion channel controlling mucus hydration that is mutated in cystic fibrosis (CF). PI3Kγ MP promoted the phosphorylation of wild-type CFTR on serine-737, triggering channel gating, and rescued the function of F508del-CFTR, the most prevalent CF mutant, by enhancing the effects of existing CFTR modulators. These results unveil PI3Kγ as the regulator of a β2-AR/cAMP microdomain central to smooth muscle contraction, immune cell activation, and epithelial fluid secretion in the airways, suggesting the use of a PI3Kγ MP for compartment-restricted, therapeutic cAMP elevation in chronic obstructive respiratory diseases.


Figures

Fig. 1.
Fig. 1.. PI3Kγ decreases airway cAMP through kinase-dependent activation of PDE4B and PDE4D.
(A) cAMP concentration in tracheas from PI3Kγ+/+ (n=5), PI3KγKD/KD (n=5) and PI3Kγ−/− (n=4) mice. (B) Phosphodiesterase activity in PDE4B and PDE4D immunoprecipitates (IP) from PI3Kγ+/+ (n=5 and n=6), PI3KγKD/KD (n=4 and n=4) and PI3Kγ−/− (n=5 and n=5) tracheas. Western blots of representative IPs are shown. (C) Phosphodiesterase activity in PDE4B and PDE4D IP from PI3Kγ+/+ (n=8 and n=5), PI3KγKD/KD (n=4 and n=5) and PI3Kγ−/− (n=6 and n=5) independent cultures of murine tracheal smooth muscle cells (mTSMCs). Western blots of representative IPs are shown. (D) Western blot of PI3Kγ expression in mTSMCs, human bronchial smooth muscle cells (hBSMCs) and murine trachea. Peripheral blood mononuclear cells (PBMCs) are used as positive control. (E) Co-immunoprecipitation of PI3Kγ catalytic subunit (p110γ) with its relative adaptors (p101 and p84/87) and PKA catalytic subunit (PKA-C) in hBSMCs. (F) Co-immunoprecipitation of PI3Kγ with PDE4B and PDE4D in hBSMCs. IgG immunoprecipitation was used as control. In (D), (E) and (F), representative Western blot images of n=4 independent experiments are shown. (G) (Left) Representative fluorescence resonance energy transfer (FRET) traces and (right) maximal FRET changes (Max ΔFRET) of hBSMCs transfected with a FRET–based sensor for cytosolic cAMP (Epac2-cAMPs), together with either an shRNA against the PIK3CG gene encoding PI3Kγ (PI3Kγ shRNA; n=7) or a scrambled shRNA (scr shRNA; n=9) vector. β2-ARs were selectively activated by isoproterenol (Iso; 100 nmol/L, 15 seconds) and the β1-AR selective antagonist CGP-20712A (CGP; 100 nmol/L). Insets, representative cyan and yellow fluorescence protein images of hBSMCs expressing Epac2-cAMPs. n indicates the number of cells analyzed in n=3 independent experiments. Representative Western blot of PI3Kγ expression in hBSMCs 48 hours after transfection with the PI3Kγ shRNA and scr shRNA is shown below the graph. In (A), (B) and (C), *P<0.05, **P<0.01 and ***P<0.001 by one-way ANOVA followed by Bonferroni’s post-hoc test. In (G), **P<0.01 by Mann-Whitney test. Throughout, data are mean ± SEM.
Fig. 2.
Fig. 2.. PI3Kγ MP enhances airway β2-AR/cAMP signaling in vitro.
(A) Top, schematic representation of the cell-permeable PI3Kγ mimetic peptide (PI3Kγ MP). The 126-150 region of PI3Kγ was fused to the cell-penetrating peptide penetratin 1 (P1). Bottom, intracellular fluorescence of human bronchial smooth muscle cells (hBSMCs) following 1 hour incubation with a FITC-labeled version of PI3Kγ MP (50 μM) or vehicle. Scale bar: 10 μm. (B) Steady-state emission spectra of recombinant fluorescein 5-maleimide-labelled PKA-RII (PKA-F5M) in the presence of increasing concentrations of PI3Kγ MP (0-150 μM), revealing a dissociation constant for PI3Kγ MP/PKA-RII interaction of 7.5 μM. (C) Co-immunoprecipitation of the catalytic subunit of PI3Kγ (p110γ) and PKA-RII from HEK-293T cells expressing p110γ and exposed to increasing doses of PI3Kγ MP for 2 hours. Representative immunoblots (left) and relative quantification (right) of n=3 independent experiments are shown. (D) PDE4B and PDE4D activity in PI3Kγ+/+ and PI3Kγ−/− mouse tracheal smooth muscle cells (mTSMCs) treated with either vehicle (Veh) or PI3Kγ MP (50 μM) for 30 min. For PDE4B IP: PI3Kγ+/++Veh n=4; PI3Kγ+/++PI3Kγ MP n=5; PI3Kγ−/−+Veh n=5 and PI3Kγ−/−+ PI3Kγ MP n=5 independent cultures. For PDE4D IP: n=3 independent cultures in all groups. (E) Representative FRET traces (left) and maximal FRET changes (right) in human tracheal smooth muscle cells (hBSMCs) expressing the ICUE3 cAMP FRET sensor and pre-treated for 30 min with vehicle (n=9), 50 μM PI3Kγ MP (n=6) or equimolar control peptide (CP; n=11) before activation of β2-adrenergic receptors (β2-ARs) with isoproterenol and the β1-AR antagonist CGP-20712A (Iso + CGP; 100 nM each). Insets show representative intensity-modulated pseudocolor images at t = 0 s and 500 s after the addition of Iso+CGP. n indicates the number of cells analysed in n=3 independent experiments. (F) cAMP elevation in human bronchial epithelial cells (16HBE14o-) in response to increasing concentrations of PI3Kγ MP (31.6 nM – 316 μM range) for 30 min. The amount of cAMP was expressed as percentage of cAMP accumulation elicited by 100 μM PI3Kγ MP. N=6 independent experiments. In (C), (D) and €, *P<0.05, **P<0.01, ***P<0.001 by one-way ANOVA followed by Bonferroni’s post-hoc test. In (F), non-linear regression analysis was used. Throughout, data are mean ± SEM.
Fig. 3.
Fig. 3.. PI3Kγ MP elevates airway cAMP abundance in vivo in mice.
(A) cAMP concentrations in tissues from BALB/c mice 24 hours after intratracheal instillation of different doses of PI3Kγ MP (0-750 μg/kg). Values in brackets indicate the dose of PI3Kγ MP expressed as μg/kg. The number of mice (n) ranged from 3 to 9 per group. (B) Tissue distribution of a FITC-labeled version of PI3Kγ MP at indicated time points after intratracheal instillation of 0.08 mg/kg (1.5 μg) in BALB/c mice. Representative images of n=3 experiments are shown. Scale bar: 50 μm. (C) Amount of cAMP in tissues from mice treated as in (B). The number of mice (n) ranged from 3 to 6 per group. In (A), *P<0.05, **P<0.01, ***P<0.001 by one-way ANOVA followed by Bonferroni’s post-hoc test. In (C), *P<0.05 by Kruskal Wallis test followed by Dunn’s multiple comparison test. Throughout, data are mean ± s.e.m.
Fig. 4.
Fig. 4.. PI3Kγ MP promotes airway relaxation ex vivo and in vivo in a mouse model of asthma.
(A and B) Cumulative contractile response of PI3Kγ+/+, PI3KγKD/KD and PI3Kγ−/− tracheal rings to increasing concentrations of acetylcholine (A) and carbachol (B). The developed tension is expressed as a percentage of the resting tone. In (A), PI3Kγ+/+ n=7, PI3KγKD/KD n=6 and PI3Kγ−/− n=5 mice. In (B), PI3Kγ+/+ n=9, PI3KγKD/KD n=6 and PI3Kγ−/− n=5 mice. (C) Cumulative contractile response to carbachol of PI3Kγ+/+ and PI3Kγ−/− tracheal rings pre-treated with either vehicle (Veh) or the PDE4 inhibitor Roflumilast (Ro, 10 μM) for 30 min. PI3Kγ+/++Veh n=10, PI3Kγ+/++Ro n=5, PI3Kγ−/−+Veh n=13, and PI3Kγ−/−+Ro n=9 mice. (D) Average lung resistance in healthy mice treated with vehicle (n=4), 1.5 μg PI3Kγ MP (n=4) or equimolar amount of control peptide (CP; n=5) directly before exposure to increasing doses of the bronchoconstrictor methacholine (MCh). (E) cAMP concentrations in lungs and tracheas of ovalbumin (OVA)-sensitized mice at the indicated time points after intra-tracheal administration of PI3Kγ MP (15 μg). The number of mice (n) ranged from 3 to 8 per group. (F) Tidal volume of ovalbumin (OVA)-sensitized mice pre-treated with vehicle (n=5), PI3Kγ MP (15 μg; n=6) and CP (equimolar amounts; n=5) and exposed to methacholine (MCh; 500 μg/kg). (G) Average lung resistance (expressed as % of basal) in OVA-sensitized mice treated with 15 μg of PI3Kγ MP (n=9) or equimolar amount of CP (n=10) 30 min before methacholine challenge. In (A) and (B), *P<0.05, **P<0.01 and ***P<0.001 versus PI3Kγ+/+ and #P<0.05 and ##P<0.01 versus PI3KγKD/KD by two-way ANOVA followed by Bonferroni’s multiple comparisons test. In (C), **P<0.01 and ***P<0.001 for PI3Kγ+/++Veh versus all other groups by two-way ANOVA followed by Bonferroni’s multiple comparisons test. In (D), **P<0.01 and ***P<0.001 versus vehicle and ### P<0.001 versus CP by two-way ANOVA followed by Bonferroni’s post-hoc test. In (E) and (F), *P<0.05 and **P<0.01 by one-way ANOVA followed by Bonferroni’s post-hoc test. In (G), *P<0.05 and **P<0.01 between groups by two-way ANOVA followed by Bonferroni’s post-hoc test. Throughout, data are mean ± SEM.
Fig. 5.
Fig. 5.. PI3Kγ MP limits neutrophilic lung inflammation in asthmatic mice.
(A) Representative images of hematoxylin-eosin (top) and periodic acid-Schiff’s reagent (bottom) staining of lung sections of naïve and ovalbumin (OVA)-sensitized mice, pre-treated with PI3Kγ MP (25 μg) or CP (equimolar amount), before each intranasal OVA administration (days 14, 25, 26 and 27 of the OVA sensitization protocol). Scale bar: 50 μm. (B) Semi-quantitative analysis of peribronchial inflammation in lung sections as shown in (A). Naïve n=6, OVA+CP n=8 and OVA+PI3Kγ MP n=5 mice. (C) Number of neutrophils (NΦ), eosinophils (EΦ), lymphocytes (LΦ) and macrophages (MΦ) in the bronchoalveolar lavage (BAL) fluid of mice treated as in (A). Naïve n=3, OVA+CP n=8 and OVA+PI3Kγ MP n=5 animals. (D to F) fMLP-induced adhesion to ICAM-1 (D), ICAM-2 (E) and fibrinogen (F) of human neutrophils pre-treated or not with the PKA inhibitor H89 (200 nM, 30 min) before exposure to vehicle or PI3Kγ MP (50 μM, 1 hour). Static adhesion was induced with 25 nM fMLP for 1 min. Average numbers of adherent cells/0.2 mm2 is shown. In (D) and (F), n=3 in all groups; in (E), n=4 in all groups. (G) fMLP-triggered chemotaxis of human neutrophils treated with vehicle, CP (50 μM) or PI3Kγ MP (50 μM) for 1 hour, without or with pre-treatment with the PKA inhibitor H89 (200 nM, 30 min). n=4 in all groups. (G) fMLP-induced RhoA activity in human neutrophils treated with vehicle, CP (50 μM) or PI3Kγ MP (50 μM). n=3 in all groups. In (B), **P<0.01 and ***P <0.001 by Kruskal Wallis test followed by Dunn’s multiple comparison test. In (C), (D), (E), (F), (G) and (H), *P <0.05, **P<0.01 and ***P <0.001 by one-way ANOVA followed by Bonferroni’s post-hoc test.
Fig. 6.
Fig. 6.. PI3Kγ MP promotes cAMP-dependent gating of CFTR.
(A) Representative FRET traces (left) and maximal FRET changes (right) in human bronchial epithelial cells (16HBE14o-) expressing the FRET probe for either plasma membrane (pm cAMP) or cytosolic cAMP (cyt cAMP). Cells were pre-incubated with vehicle (Veh), PI3Kγ MP (25 μM) or control peptide (CP; 25 μM) before treatment with 1 μM forskolin (Fsk). R is the normalized 480 nm/545nm emission ratio calculated at indicated time points. n indicates number of cells from n=3 independent experiments. Veh n=10 and n=12, PI3Kγ MP n=22 and n=11, CP n=3 and n=7, for pm cAMP and cyt cAMP, respectively. (B) Representative Western blot (left) and relative quantification (right) of PKA-mediated phosphorylation of CFTR in 16HBE14o- cells treated with vehicle, CP (25 μM), PI3Kγ MP (25 μM) and the PDE4 inhibitor Rolipram (PDE4i; 10 μM) for 30 min. CFTR was immunoprecipitated (IP) and PKA-dependent phosphorylation was detected in IP pellets by immunoblotting with a PKA substrate antibody. n=4 independent experiments. (C) Relative phosphorylation (%) or phospho-occupancy of identified PKA sites of CFTR in wt-CFTR-CFBE41o- expressing HBH-CFTR-3HA treated with vehicle (DMSO; n=7), PI3Kγ MP (25 μM, 1 hour, n=3) and Fsk (10 μM, 10 min, n=7). n is the number of biological replicates from n=3 independent experiments. The phospho-occupancy or the percent of relative phosphorylation of each site was calculated as a ratio of all phosphorylated and unphosphorylated peptides that contained a given phosphorylation site (% phosphorylation of site A = [area of peptides phosphorylated at site A /sum of areas of all peptides carrying site A] as described in Methods). Representative fragmentation spectra from each identified phosphorylation site and representative chromatograms from S737-containing peptides in their unphosphorylated and phosphorylated form are provided in Fig. S6. (D) Representative Western blot (left) and relative quantification (right) of PKA-mediated phosphorylation of CFTR in HEK293T cells expressing either wt- or S737A-CFTR and exposed to vehicle, PI3Kγ MP (25 μM, 1 hour) or Fsk (10 μM, 10 min). n=4 independent experiments. (E) left, Representative trace of short-circuit currents (ISC) measured in Ussing chambers in primary human normal bronchial epithelial (HBE) cells cultured at the air-liquid interface (ALI). The following treatments were applied at the indicated times: ENaC inhibitor amiloride (10 μM), CP (30 μM), PI3Kγ MP (10-30 μM), PDE4 inhibitor Rolipram (PDE4i; 10 μM), forskolin (Fsk, 10 μM) and CFTR inhibitor 172 (CFTRinh-172; 20 μM). Right, average current variations in response to the indicated treatments. n=3 biological replicates from the same donor. (F) Normalized swelling curves (left) and representative confocal images (right) of Fsk-stimulated calcein green-labeled wild-type (wt) organoids pre-incubated with PI3Kγ MP (25 μM) or vehicle (Veh) for 20 min. Fsk was used at 2 μM. Scale bar: 100 μm. Veh n=25 and PI3Kγ MP n=28 organoids from n=3 independent experiments. (G) Water residence time (τin) determined by 1H NMR relaxometry (as described in Supplementary Material) in HEK293T cells transfected with wt-CFTR and treated with vehicle (DMSO; n=8), CP (25 μM; n=3) and PI3Kγ MP (25 μM; n=11). n indicates the number of biological replicates in n=3 independent experiments. In (A), (B), (D), (E) and (G), *P<0.05, **P <0.01 and ***P <0.001 by one-way ANOVA followed by Bonferroni’s post-hoc test. In (C), unpaired t-tests followed by Holm-Sidak’s multiple comparisons test were performed on each phosphorylation site between two different treatment conditions. #P<0.05, ##P <0.01 and ###P<0.001 Fsk versus vehicle, *P<0,05 PI3Kγ MP versus vehicle. (F) *P<0.05 and ***P<0.001 by two-way ANOVA followed by Bonferroni's multiple comparisons test. Throughout, data are mean ± SEM.
Fig. 7.
Fig. 7.. PI3Kγ MP potentiates the therapeutic effects of CFTR modulators in CF in vitro models.
(A) Representative FRET traces (left) and maximal FRET changes (right) in CFBE41o- cells overexpressing F508del-CFTR and the plasma membrane-targeted FRET probe for cAMP (pm cAMP). Cells were pre-incubated with vehicle (Veh), the CFTR corrector VX-809 (5 μM) alone or together with PI3Kγ MP (25 μM) before treatment with 1 μM Fsk. R is the normalized 480 nm/545nm emission ratio calculated at indicated time points. Veh n=12, VX-809 n=22 and VX-809+PI3Kγ MP n=16 where n is the number of cells from n=3 independent experiments. (B) Left, Representative trace of short-circuit currents (ISC) in primary human bronchial epithelial cells from a donor with CF (Patient #1) homozygous for the F508del mutation (F508del/F508del HBE) and grown at the air-liquid interface (ALI). Cells were corrected with VX-809 for 48 hours (5 μM) and then exposed to the following drugs at the indicated times: Amiloride (Amil, 100 μM), CP (10 μM), PI3Kγ MP (10 μM), forskolin (Fsk, 10 μM), VX-770 (1 μM) and the CFTR inhibitor 172 (CFTRinh-172; 10 μM). Right, Average total current variation in response to VX-770 (1 μM), CP (10 μM), PI3Kγ MP (10 μM) and forskolin (Fsk, 10 μM) of n=4 technical replicates of the same donor. (C) Average total current variation in response to VX-770 (1 μM), CP (25 μM) and PI3Kγ MP (25 μM) in F508del/F508del HBE cells from a second donor with CF (Patient #2) grown at ALI and pre-corrected with VX-809 for 48 hours (5 μM). n=4 technical replicates of the same donor. Representative ISC traces are provided in Fig. S9A-C. (D) Representative confocal images and forskolin-induced swelling (FIS) of calcein green-labeled rectal organoids from a patient carrying compound CF F508del and D1152H mutations (F508del/D1152H). Organoids were corrected with VX-809 (3 μM) for 24 hours, incubated with calcein-green (3 μM) for 30 min and exposed to either PI3Kγ MP or CP (both 25 μM) for 30 min before stimulation with Fsk (2 μM). Organoid response was measured as percentage change in volume at different time points after addition of Fsk (t=30, t=60, and t=120 min) compared to the volume at t=0. n=15-34 organoids from 1 donor in n=2 independent experiments. Scale bar: 200 μm. (E) FIS responses (right) and representative confocal images (left) of calcein green-labeled rectal organoids from a CF patient homozygous for the F508del mutation (F508del/F508del). Organoids were pre-incubated with the CFTR corrector VX-809 (3 μM) and the CFTR potentiator VX-770 (3 μM) for 24 hours before exposure to two different concentrations of Fsk (0.51 μM; 0.128 μM) and PI3Kγ MP (10 μM; 25 μM). The peptide was added to the organoids together with Fsk. Organoid response was measured as area under the curve of relative size increase of organoids after 60 min Fsk stimulation, t = 0 min: baseline of 100%. n=12 organoids/group analyzed in n=2 independent cultures from n=2 different donors. Scale bar: 200 μm. In (A), (B), and (C), **P <0.01 and ***P <0.001 by one-way ANOVA followed by Bonferroni’s post-hoc test. In (D), *P<0.05 and ***P<0.001 by two-way ANOVA followed by Bonferroni’s post-hoc test. In (E), ***P <0.001 by Kruskal Wallis test followed by Dunn’s multiple comparison test. Throughout, data are mean ± SEM
Fig. 8.
Fig. 8.. PI3Kγ MP enhances the effect of elexacaftor/tezacaftor/ivacaftor in primary F508del/F508del HBE cells.
(A) Representative traces of ISC in primary human CF bronchial epithelial cells from a donor with CF (Patient BE93) homozygous for the F508del mutation (F508del/F508del HBE) and grown at the air-liquid interface (ALI). Cells were corrected for 24 hours with VX-661 and VX-445 alone (10μM+3μM) or together with PI3Kγ MP (10 μM), before exposure at the indicated time to the following drugs: Amiloride (100 μM), VX-770 (1 μM), CPT-cAMP (100 μM), and CFTRinh-172 (10 μM). (B) Average total current variation in response to VX-770 (1 μM) from n=5-8 technical replicates of donor BE93. (C) Average total current variation in response to VX-770 (1 μM) from n=5 technical replicates of a second F508del/F508del donor (patient BE91). Representative ISC traces are provided in Fig. S9E. Throughout, *P<0.05 and **P<0.001 and by Student’s t test. Data are mean ± SEM.

References

    1. Celli BR, Wedzicha JA, Update on Clinical Aspects of Chronic Obstructive Pulmonary Disease. N Engl J Med 381, 1257–1266 (2019). - PubMed
    1. Shteinberg M, Haq IJ, Polineni D, Davies JC, Cystic fibrosis. Lancet 397, 2195–2211 (2021). - PubMed
    1. Barnes PJ, New drugs for asthma. Nat Rev Drug Discov 3, 831–844 (2004). - PubMed
    1. Vijftigschild LA, Berkers G, Dekkers JF, Zomer-van Ommen DD, Matthes E, Kruisselbrink E, Vonk A, Hensen CE, Heida-Michel S, Geerdink M, Janssens HM, van de Graaf EA, Bronsveld I, de Winter-de Groot KM, Majoor CJ, Heijerman HG, de Jonge HR, Hanrahan JW, van der Ent CK, Beekman JM, beta2-Adrenergic receptor agonists activate CFTR in intestinal organoids and subjects with cystic fibrosis. Eur Respir J 48, 768–779 (2016). - PubMed
    1. Dunican EM, Elicker BM, Henry T, Gierada DS, Schiebler ML, Anderson W, Barjaktarevic I, Barr RG, Bleecker ER, Boucher RC, Bowler R, Christenson SA, Comellas A, Cooper CB, Couper D, Criner GJ, Dransfield M, Doerschuk CM, Drummond MB, Hansel NN, Han MK, Hastie AT, Hoffman EA, Krishnan JA, Lazarus SC, Martinez FJ, McCulloch CE, O'Neal WK, Ortega VE, Paine R 3rd, Peters S, Schroeder JD, Woodruff PG, Fahy JV, Mucus Plugs and Emphysema in the Pathophysiology of Airflow Obstruction and Hypoxemia in Smokers. Am J Respir Crit Care Med 203, 957–968 (2021). - PMC - PubMed

Publication types

MeSH terms

Substances