. 2022 Mar 30;14(638):eabc7480.
doi: 10.1126/scitranslmed.abc7480. Epub 2022 Mar 30.

Small-molecule targeted therapies induce dependence on DNA double-strand break repair in residual tumor cells

Affiliations

Small-molecule targeted therapies induce dependence on DNA double-strand break repair in residual tumor cells

Moiez Ali et al. Sci Transl Med. .

Abstract

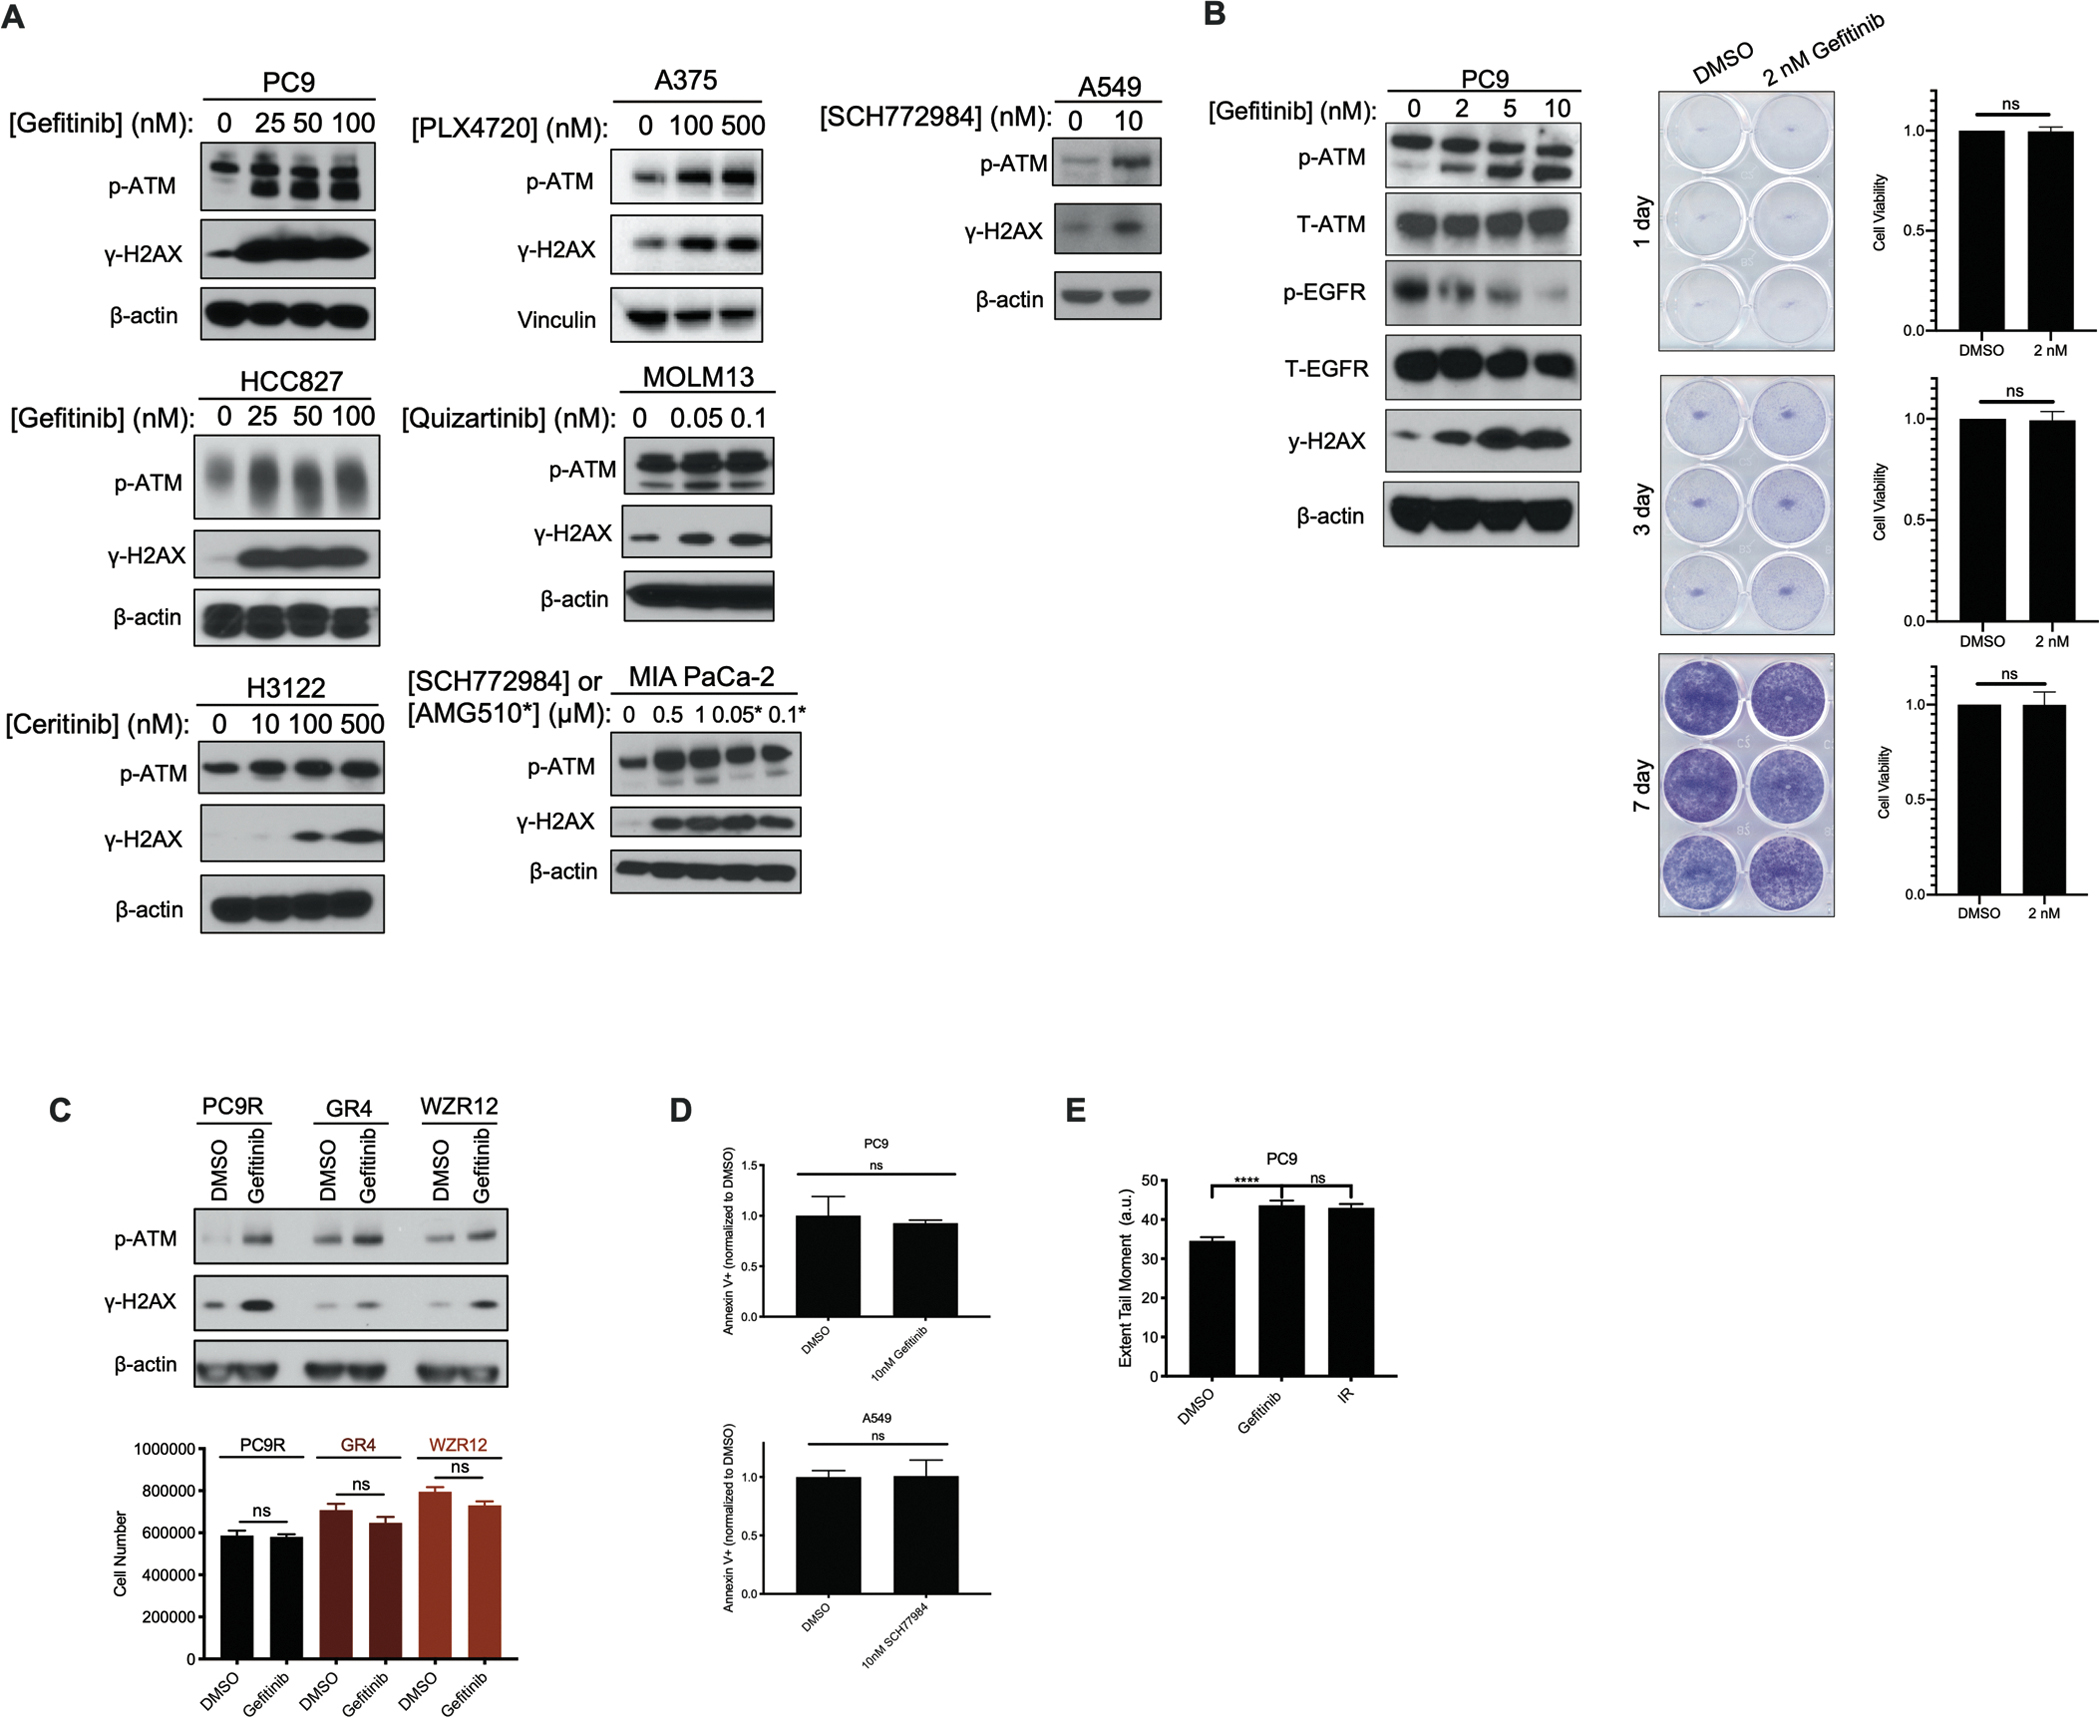
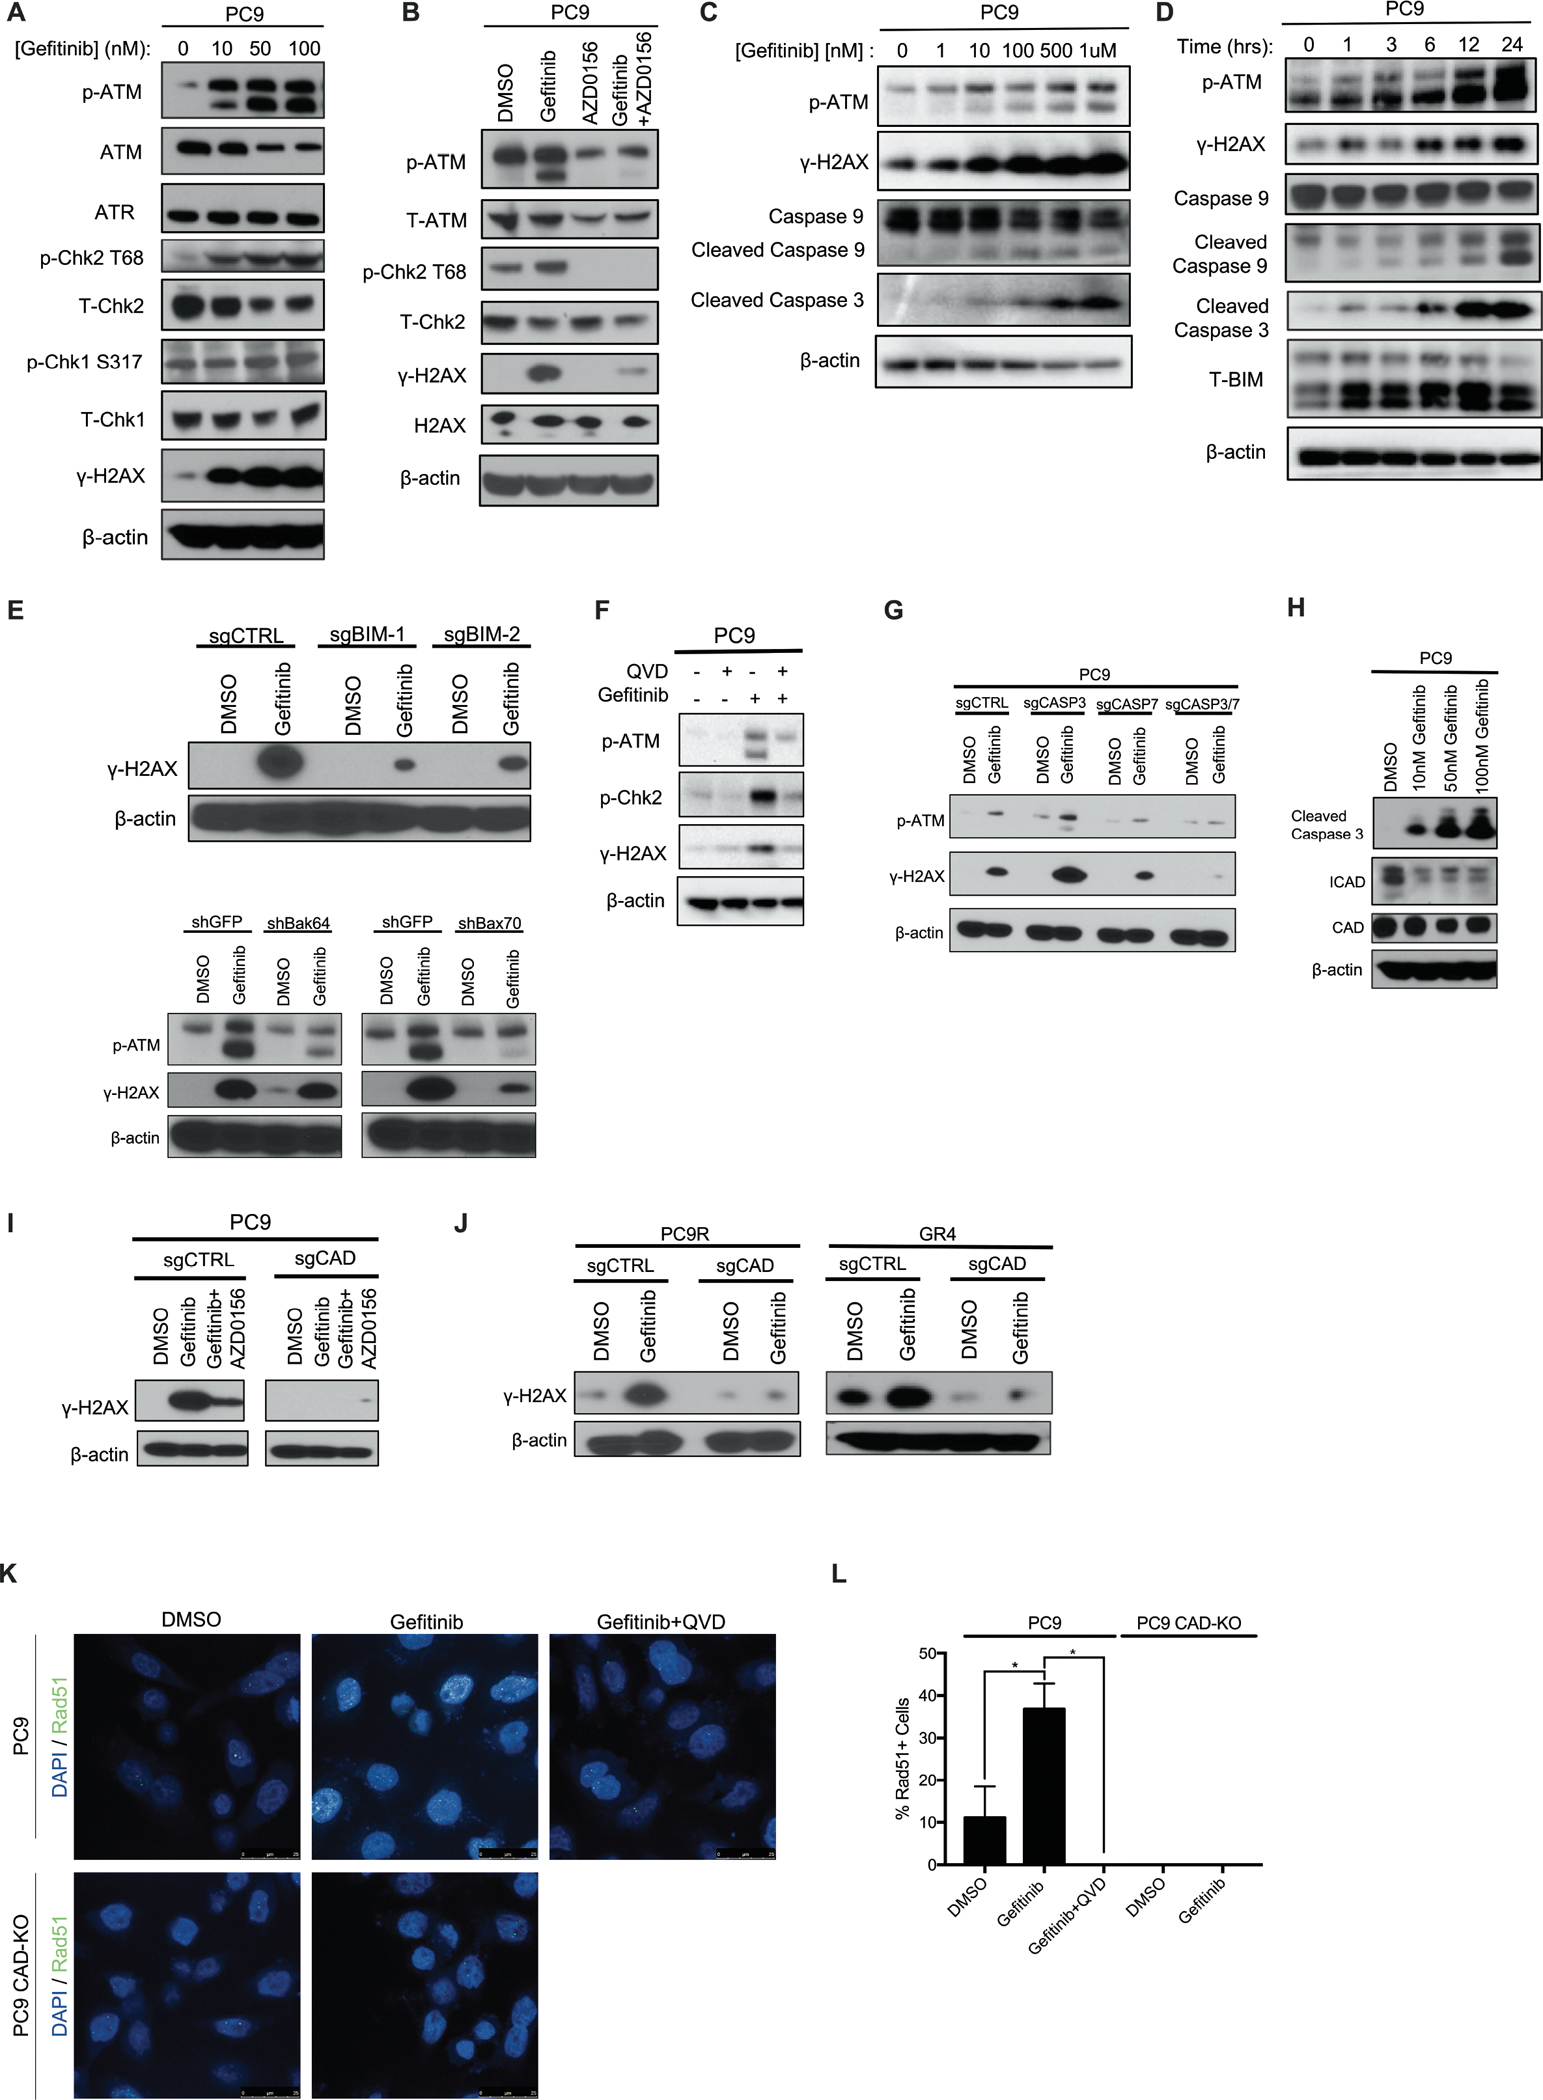
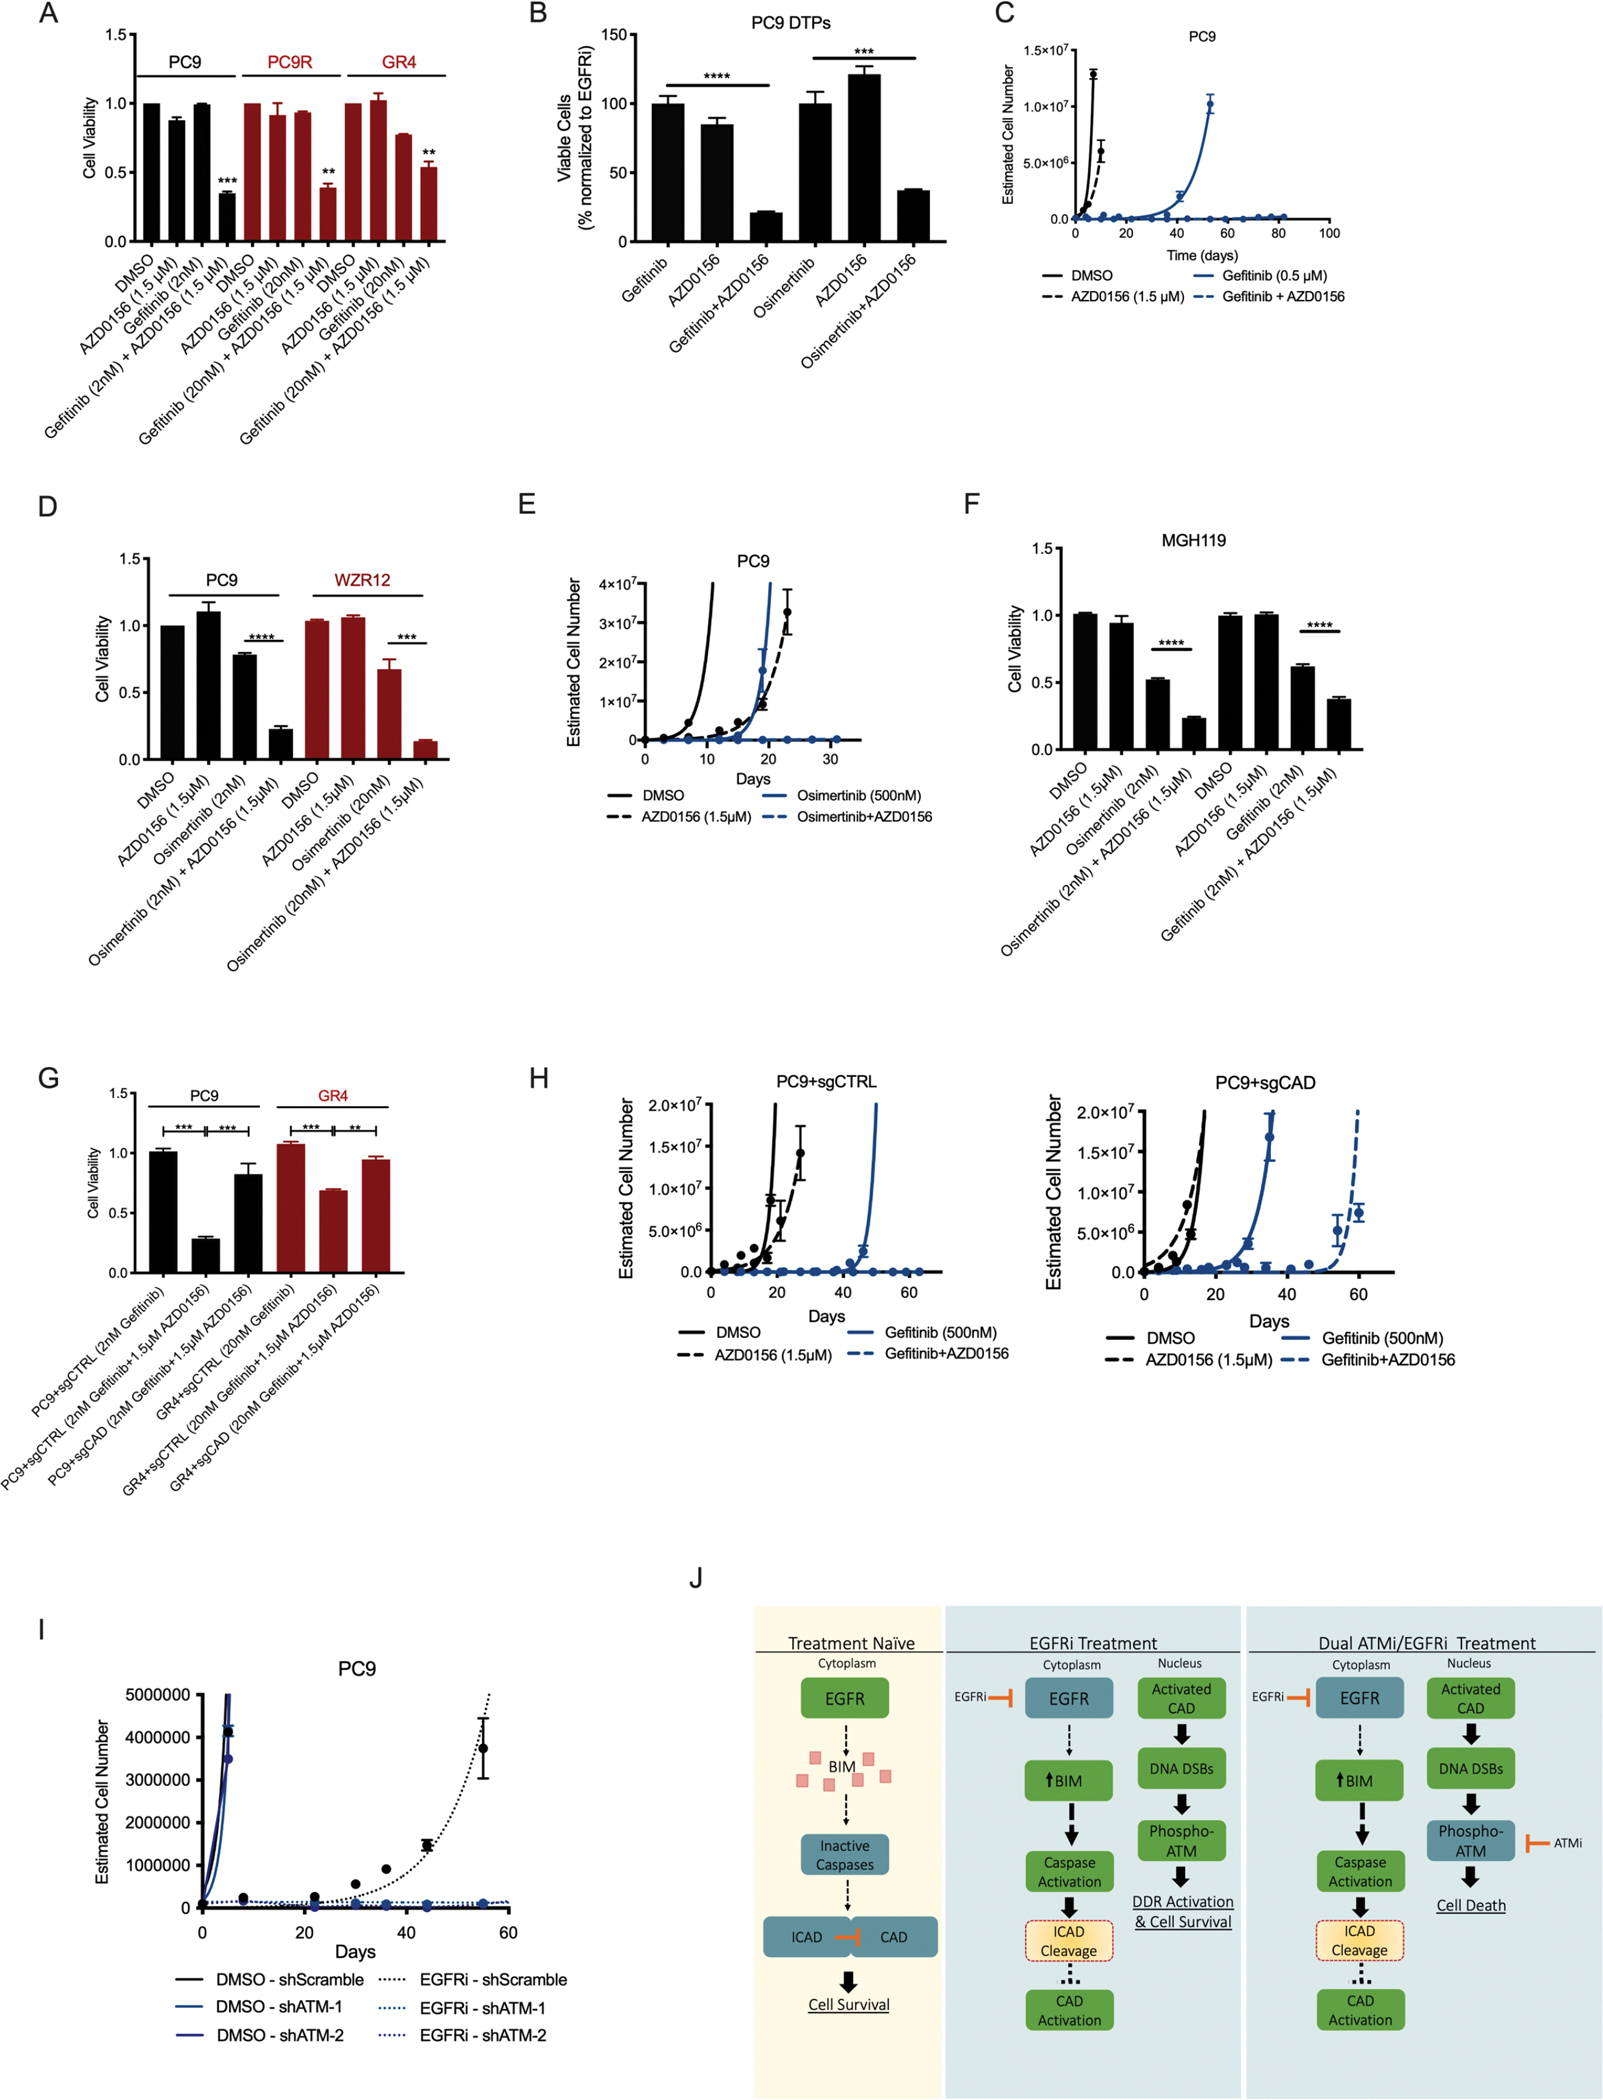
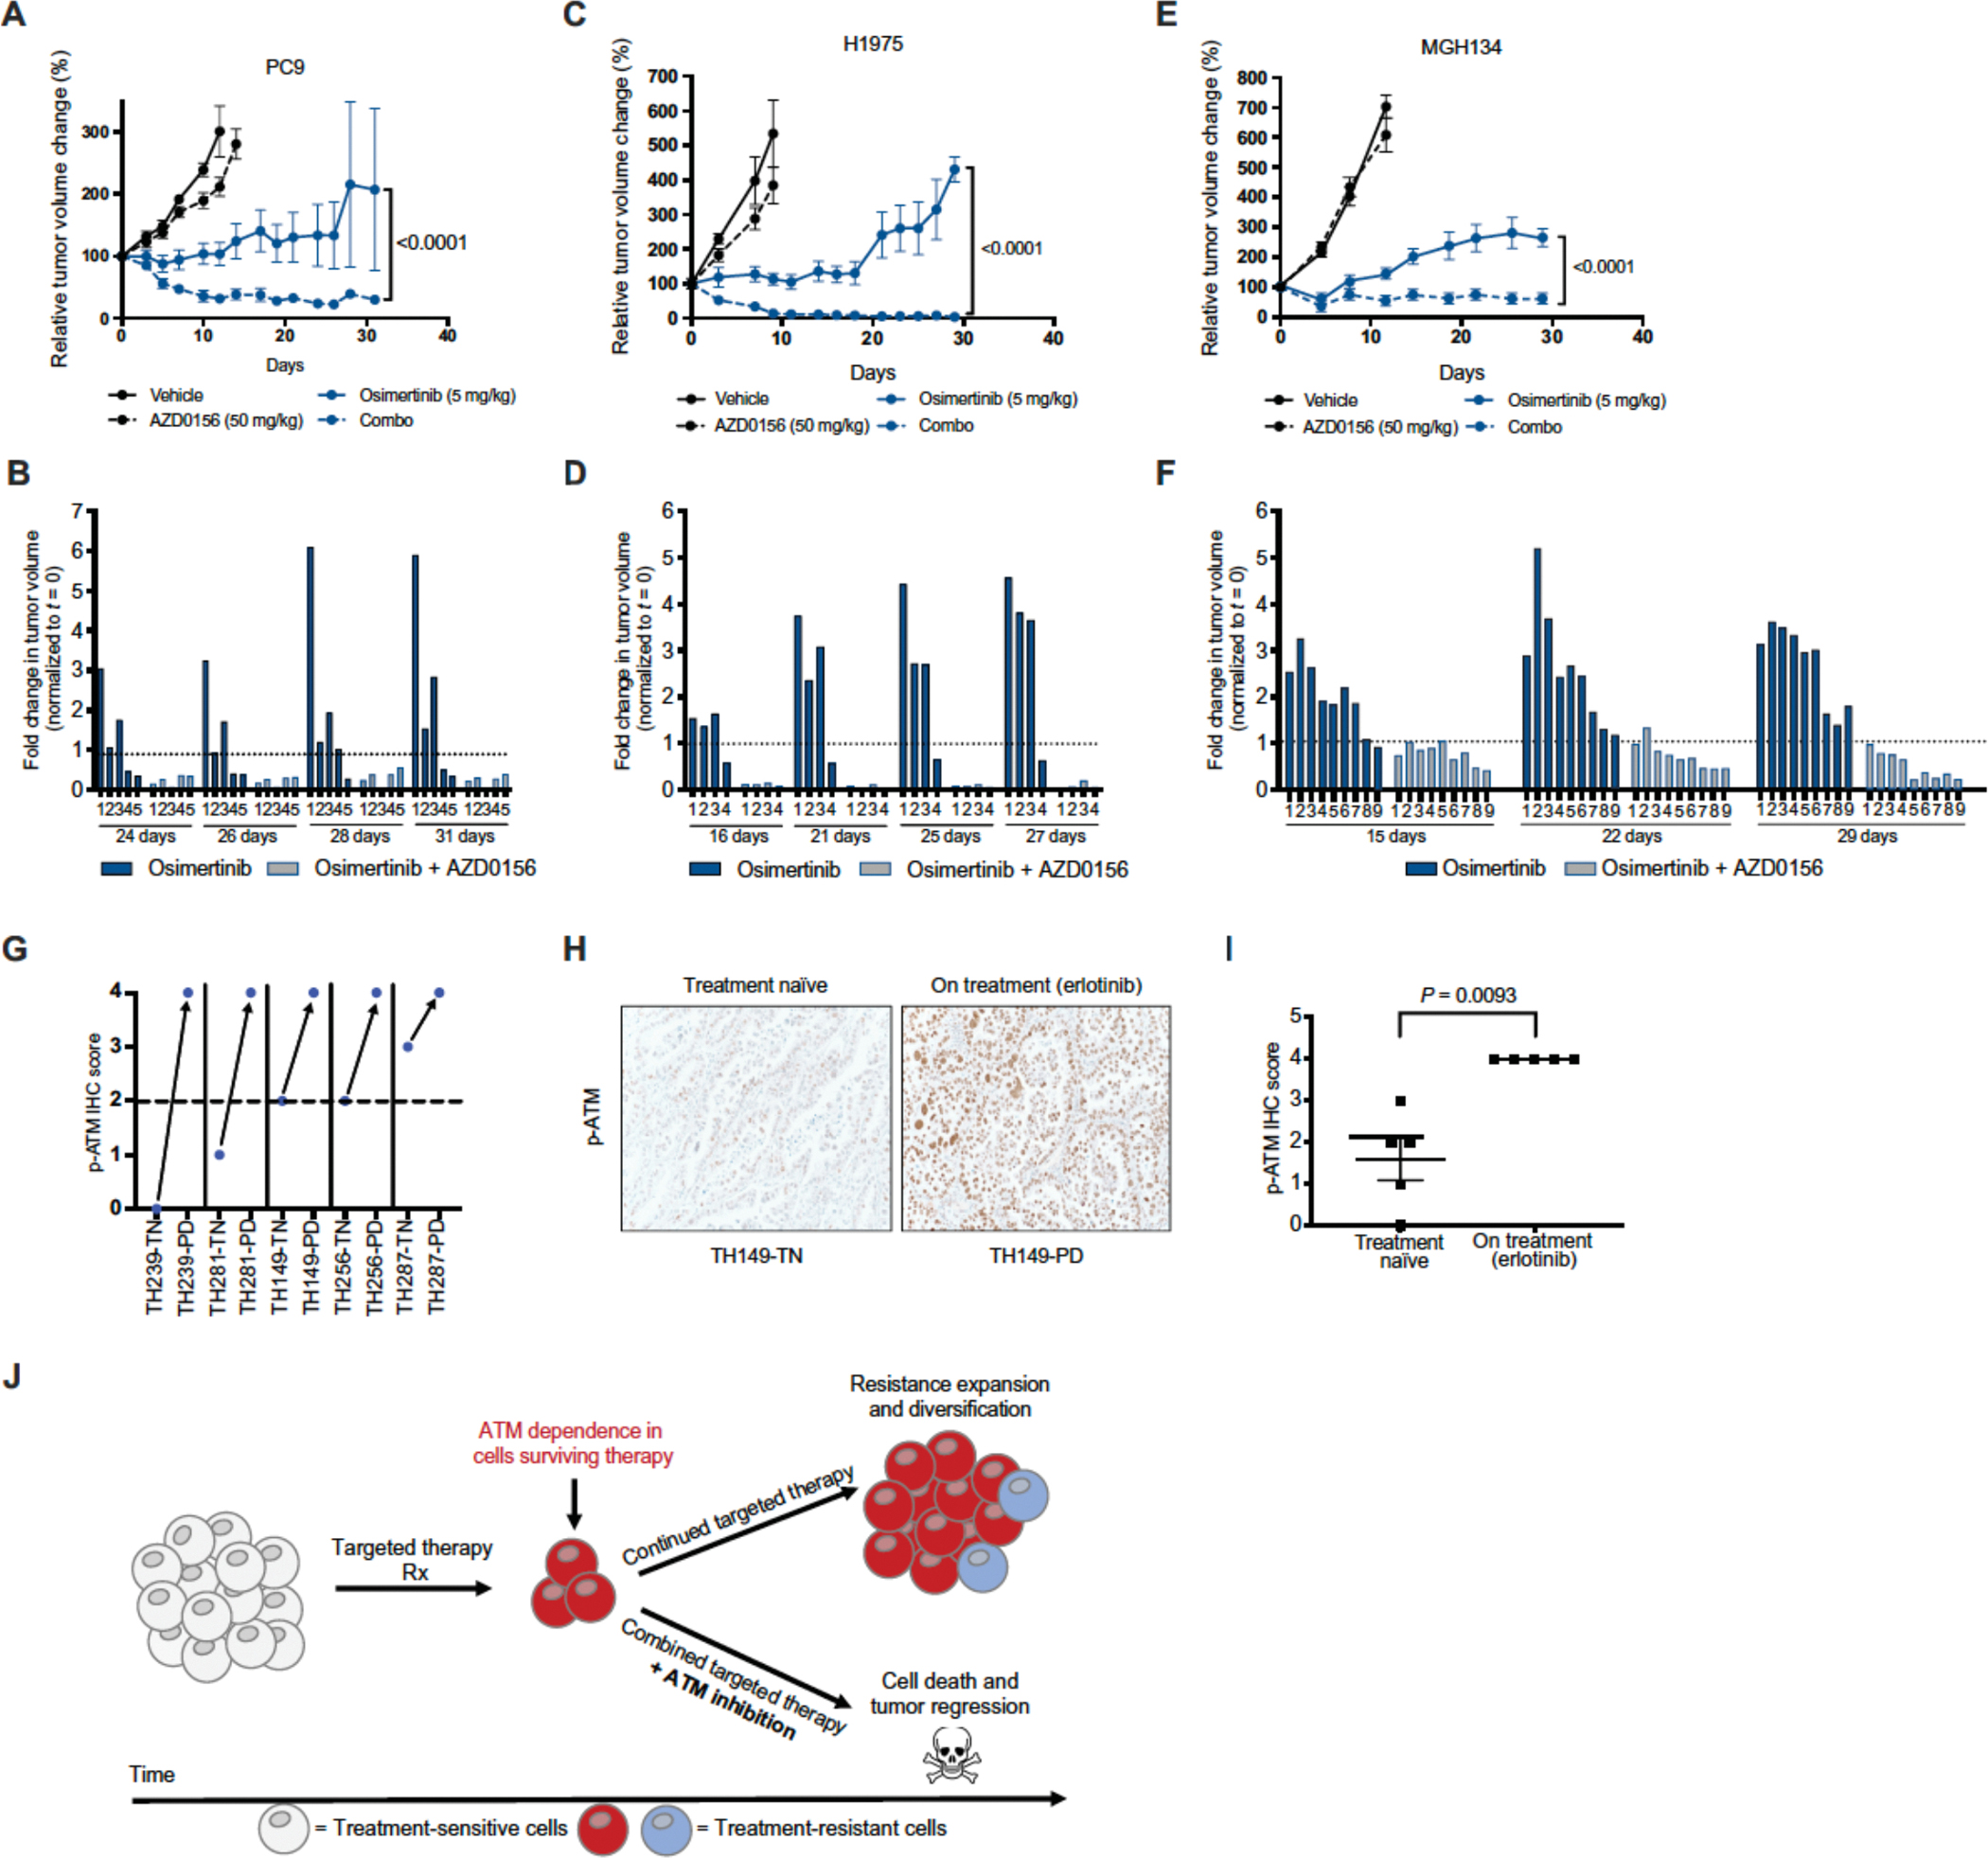
Residual cancer cells that survive drug treatments with targeted therapies act as a reservoir from which eventual resistant disease emerges. Although there is great interest in therapeutically targeting residual cells, efforts are hampered by our limited knowledge of the vulnerabilities existing in this cell state. Here, we report that diverse oncogene-targeted therapies, including inhibitors of epidermal growth factor receptor (EGFR), anaplastic lymphoma kinase (ALK), KRAS, and BRAF, induce DNA double-strand breaks and, consequently, ataxia-telangiectasia mutated (ATM)-dependent DNA repair in oncogene-matched residual tumor cells. This DNA damage response, observed in cell lines, mouse xenograft models, and human patients, is driven by a pathway involving the activation of caspases 3 and 7 and the downstream caspase-activated deoxyribonuclease (CAD). CAD is, in turn, activated through caspase-mediated degradation of its endogenous inhibitor, ICAD. In models of EGFR mutant non-small cell lung cancer (NSCLC), tumor cells that survive treatment with small-molecule EGFR-targeted therapies are thus synthetically dependent on ATM, and combined treatment with an ATM kinase inhibitor eradicates these cells in vivo. This led to more penetrant and durable responses in EGFR mutant NSCLC mouse xenograft models, including those derived from both established cell lines and patient tumors. Last, we found that rare patients with EGFR mutant NSCLC harboring co-occurring, loss-of-function mutations in ATM exhibit extended progression-free survival on first generation EGFR inhibitor therapy relative to patients with EGFR mutant NSCLC lacking deleterious ATM mutations. Together, these findings establish a rationale for the mechanism-based integration of ATM inhibitors alongside existing targeted therapies.


Conflict of interest statement

Competing Interests

K.C.W. is a co-founder and consultant for Element Genomics, Tavros Therapeutics, and Celldom. A.N.H. has served as a consultant for Nuvalent, Inc., and receives research funding from Pfizer, Relay Therapeutics, Roche/Genentech, Eli Lilly, Blueprint Medicines and Amgen. T.G.B. is an advisor to Novartis, Astrazeneca, Revolution Medicines, Array/Pfizer, Springworks, Strategia, Relay, Jazz, Rain, EcoR1 and receives research funding from Novartis and Revolution Medicines and Strategia. C.M.B has performed consulting work for Revolution Medicines, Blueprints Medicine, Amgen, Bayer, and Foundation Medicine. H.A.Y. has performed consulting work for Daiichi, Janssen, Blueprint Medicine and AstraZeneca. C.G. is a scientific advisor for SafineAI, LLC. C.E.M is an employee of Genentech Inc, has performed unpaid consulting for Eli Lilly and Loxo, has received honoraria from Genentech, Astra Zeneca, Takeda, Novartis and Guardant Health, and receives/received research funding from Novartis and Revolution Medicines.

Figures

Figure 1:
Figure 1:. DNA damage responses in cells treated with targeted therapies.
A. Immunoblot of NSCLC, melanoma, AML, and pancreatic cancer cell lines following 24h drug treatment with increasing concentrations of cognate targeted therapies, probing for marks of DSBs, including p-ATM at S1981 and γ-H2AX. PC9 and HCC827 are EGFR mutant NSCLC; H3122 is ALK rearranged NSCLC; A549 is KRAS(G12S) mutant NSCLC; A375 is BRAF mutant melanoma; MOLM13 is FLT-3 mutant AML; and MIA PaCa-2 is KRAS(G12C) mutant pancreatic cancer. Gefitinib is an inhibitor of EGFR; ceritinib is an inhibitor of ALK; SCH772984 is an inhibitor of ERK1/2; PLX4720 is an inhibitor of BRAF; quizartinib is an inhibitor of FLT-3; and AMG510 is an inhibitor of KRAS(G12C). B. Immunoblot of PC9 cells treated with the indicated doses of gefitinib for 24h, alongside cell viability measures as assessed by crystal violet staining of cells in clonogenic assay plates or Cell Titer Glo (CTG) following treatment with vehicle (DMSO) or gefitinib for the indicated periods of time. N=3 for all cell viability experiments, where the mean ± S.E.M is plotted. P values were determined using unpaired, two-tailed Student’s t-tests. C. Cell counts following 24h of 100nM gefitinib drug exposure in drug-resistant NSCLC cells, alongside immunoblots of the corresponding drug-treated populations of cells. N=3 for cell count experiments, where the mean ± S.E.M is plotted. P values were determined using unpaired, two-tailed Student’s t-tests. D. Annexin V+ staining (normalized to DMSO vehicle control) in drug treated populations of NSCLC cell lines. N=3 for the Annexin V+ staining experiments, where the mean ± S.E.M is plotted. P values were determined using unpaired, two-tailed Student’s t-tests. E. Bar graph quantification of extent tail moment (a.u.) from neutral comet assay performed in PC9 cells, following treatment with 100 nM gefitinib for 24h (IR dose: 10 Gy). N=503 for DMSO treatment, N=704 for gefitinib treatment and N=645 for IR treatment. The mean ± S.E.M is plotted. P values were determined using one-way ANOVA with Tukey’s post hoc test. **** refers to P<0.0001.
Figure 2:
Figure 2:. Characterization of EGFR inhibitor-induced ATM pathway activation.
A. Immunoblotting of various DNA damage response markers in PC9 cells following 24h treatment with gefitinib at the indicated doses. B. Immunoblot of PC9 cells following treatment with the EGFR inhibitor gefitinib (100 nM), AZD0156 (pharmacological inhibitor of ATM, 1.5 μM), or the combination of both EGFRi and ATMi for 24h. C. Immunoblot of PC9 cells treated with increasing concentrations of gefitinib for 24h. D. Immunoblot following treatment of PC9 cells with 100nM gefitinib for the indicated lengths of time. E. Immunoblot of 24h, 100 nM gefitinib-treated cells following CRISPR/Cas9-mediated knockout of BIM or RNAi-mediated short hairpin (shRNA) knockdown of BAK/BAX in PC9 cells. F. Immunoblot of PC9 cells treated with pan-caspase inhibitor Q-VD-OPh (2 μM), gefitinib (500 nM), or the combination for 24h. G. Immunoblot of PC9 cells following CRISPR/Cas9-mediated knockout of caspase 3, 7, or 3+7, post 24h, 100 nM gefitinib treatment. H. Immunoblot of 24h gefitinib-treated PC9 cells, revealing ICAD loss. I. Immunoblot of 24h, 100 nM gefitinib-treated cells following CRISPR/Cas9-mediated knockdown of CAD in PC9 cells. J. Immunoblot of 24h, 100 nM gefitinib-treated cells following CRISPR/Cas9-mediated knockout of CAD in EGFR inhibitor-resistant cells. K. Confocal microscopy images of Rad51 loading assay in PC9 cells following treatment with 100 nM gefitinib, Q-VD-OPh (2 μM) or the combination for 24h with and without the presence of CAD. L. Bar graph quantification of images in (K). N=3 for all groups presented, where the mean ± S.E.M is plotted. P values were determined using one-way ANOVA with Tukey’s post hoc test. * refers to P<0.05.
Figure 3:
Figure 3:. Effect of ATM inhibition on survival and growth of EGFR inhibitor-resistant cells.
A. Cell viability in the indicated drug treatment conditions in EGFR inhibitor-sensitive (PC9) and -resistant (PC9R, GR4) cells. B. Cell viability, as assessed through the percentage of surviving cells (normalized to gefitinib-only treated), of PC9 drug-tolerant persisters (DTPs) following 4-day treatment with single-agent gefitinib (100 nM), AZD0156 (1.5 μM), or combination. C. Estimated cell number during long-term time-to-progression (TTP) assay of PC9 cells treated with gefitinib, AZD0156 or the combination. D. Cell viability in the indicated drug-treatment conditions in EGFR inhibitor-sensitive (PC9) and -resistant (WZR12) cells. E. Estimated cell number during long-term time-to-progression (TTP) assay of PC9 cells treated with osimertinib, AZD0156, or the combination. F. Cell viability in the indicated drug treatment conditions in EGFR inhibitor-sensitive MGH119 cells. G. Cell viability in the indicated drug treatment conditions in EGFR inhibitor-sensitive (PC9) and -resistant (GR4) cells with or without CAD presence (sgCTRL or sgCAD, respectively). H. Estimated cell number during long-term time-to-progression (TTP) assay of PC9 cells treated with gefitinib, AZD0156, or the combination, with or without CAD presence (sgCTRL or sgCAD, respectively). I. Estimated cell number during long-term time-to-progression (TTP) assay of PC9 cells treated with vehicle or gefitinib, with or without ATM presence (shScramble or shATM, respectively). J. Conceptual diagram linking EGFR inhibition to ATM activation and dependence. N=3 for all cell viability assays and estimated cell number during long-term time-to-progression assays presented, where the mean ± S.E.M is plotted. P values were determined using unpaired, two-tailed Student’s t-tests. ** refers to P<0.01, *** refers to P<0.001, and **** refers to P<0.0001.
Figure 4:
Figure 4:. Targeted therapy-induced ATM activation and targeting in vivo.
A. Tumor volume (normalized to t=0, %) of PC9 cell line xenografts in nude mice following treatment with vehicle, osimertinib, AZD0156, or the combination for indicated time points (n=5 mice in each treatment arm). P values were determined using unpaired, two-tailed Student’s t-test. B. Fold change in individual tumor volume (normalized to t=0) for PC9 tumors treated with osimertinib or the combination of osimertinib and AZD0156. C. Tumor volume (normalized to t=0, %) of H1975 cell line xenografts in nude mice following treatment with vehicle, osimertinib, AZD0156, or the combination for indicated time points (n=4–5 mice in each treatment arm). P values were determined using unpaired, two-tailed Student’s t-tests. D. Fold change in individual tumor volume (normalized to t=0) for H1975 tumors treated with osimertinib or the combination of osimertinib and AZD0156. E. Tumor volume (normalized to t=0, %) of MGH134 patient-derived cell line xenografts in nude mice following treatment with vehicle, osimertinib, AZD0156, or the combination for indicated time points (n=9–10 mice in each treatment arm). P values were determined using unpaired, two-tailed Student’s t-tests. F. Fold change in individual tumor volume (normalized to t=0) for MGH134 tumors treated with osimertinib or the combination of osimertinib and AZD0156. G. p-ATM IHC score of patient tumor tissue obtained before (treatment naïve, TN) or during treatment with erlotinib (progressive disease, PD). Same numbers indicate tumors longitudinally sampled from the same patient. H. Representative image of p-ATM IHC from patient tumors before treatment (treatment naïve) or during treatment (progressive disease). Images taken at 20x magnification. I. p-ATM IHC scores from 5 matched tumor samples from patients with EGFR mutant lung adenocarcinoma taken at the time of diagnosis and at the time of relapse to EGFR inhibitor erlotinib. P values were determined using unpaired, two-tailed Student’s t-tests. J. Proposed model of ATM dependence in targeted therapy treated tumors, leading to rational combination of targeted therapies and ATM inhibitors.

References

    1. Haber DA, Gray NS, Baselga J, The evolving war on cancer. Cell 145, 19–24 (2011). - PubMed
    1. Padma VV, An overview of targeted cancer therapy. Biomedicine (Taipei) 5, 19 (2015). - PMC - PubMed
    1. Chae YK, Pan AP, Davis AA, Patel SP, Carneiro BA, Kurzrock R, Giles FJ, Path toward Precision Oncology: Review of Targeted Therapy Studies and Tools to Aid in Defining “Actionability” of a Molecular Lesion and Patient Management Support. Mol. Cancer Ther. 16, 2645–2655 (2017). - PubMed
    1. Amirouchene-Angelozzi N, Swanton C, Bardelli A, Tumor Evolution as a Therapeutic Target. Cancer Discov. 7, 805–817 (2017). - PubMed
    1. McCoach CE, Bivona TG, Engineering Multidimensional Evolutionary Forces to Combat Cancer. Cancer Discov. 9, 587–604 (2019). - PMC - PubMed

Publication types