. 2022 Apr;8(13):eabk0011.
doi: 10.1126/sciadv.abk0011. Epub 2022 Mar 30.

Stem cell-homing hydrogel-based miR-29b-5p delivery promotes cartilage regeneration by suppressing senescence in an osteoarthritis rat model

Affiliations

Stem cell-homing hydrogel-based miR-29b-5p delivery promotes cartilage regeneration by suppressing senescence in an osteoarthritis rat model

Jinjin Zhu et al. Sci Adv. 2022 Apr.

Abstract

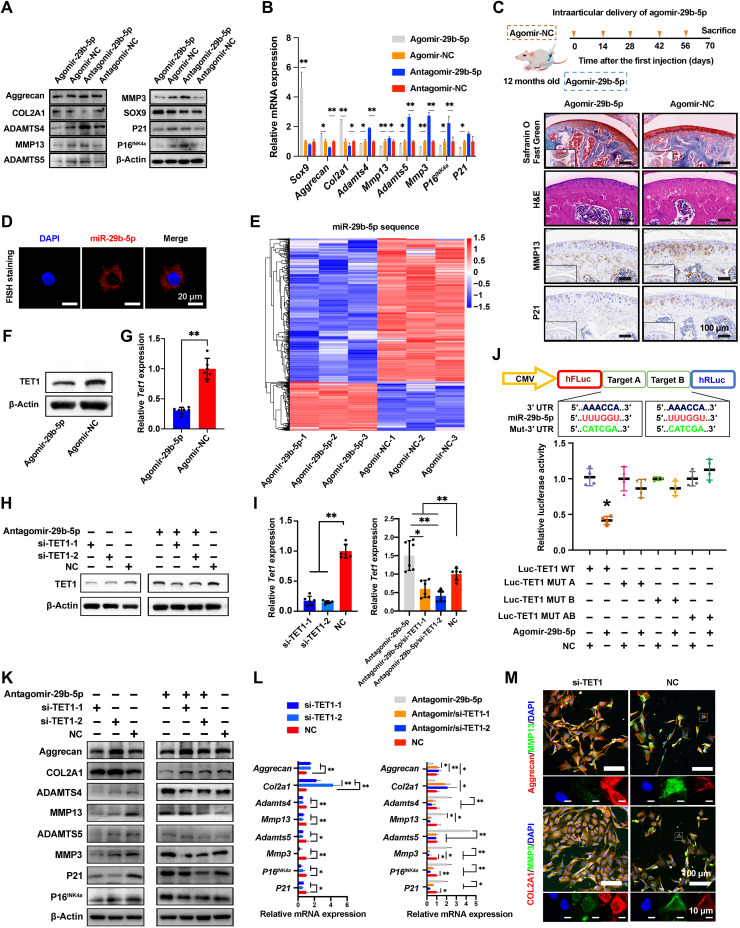
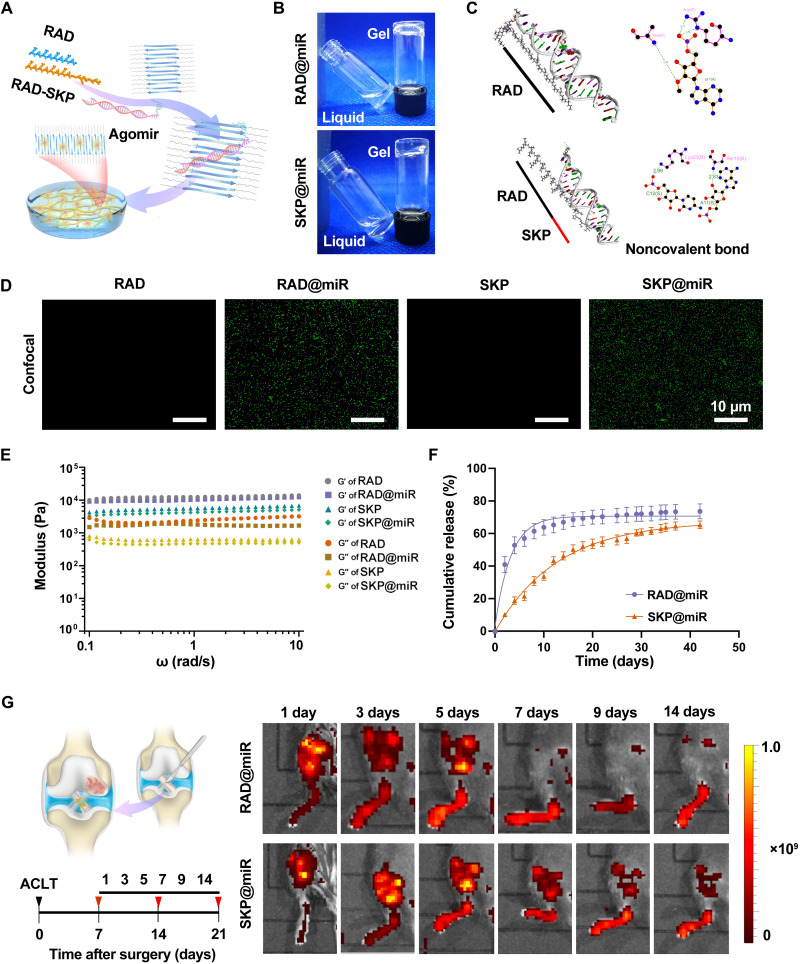
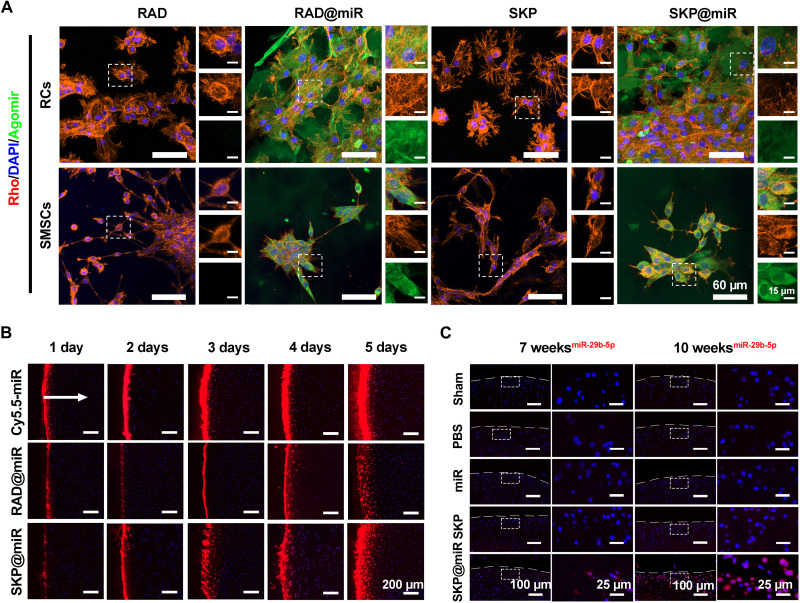
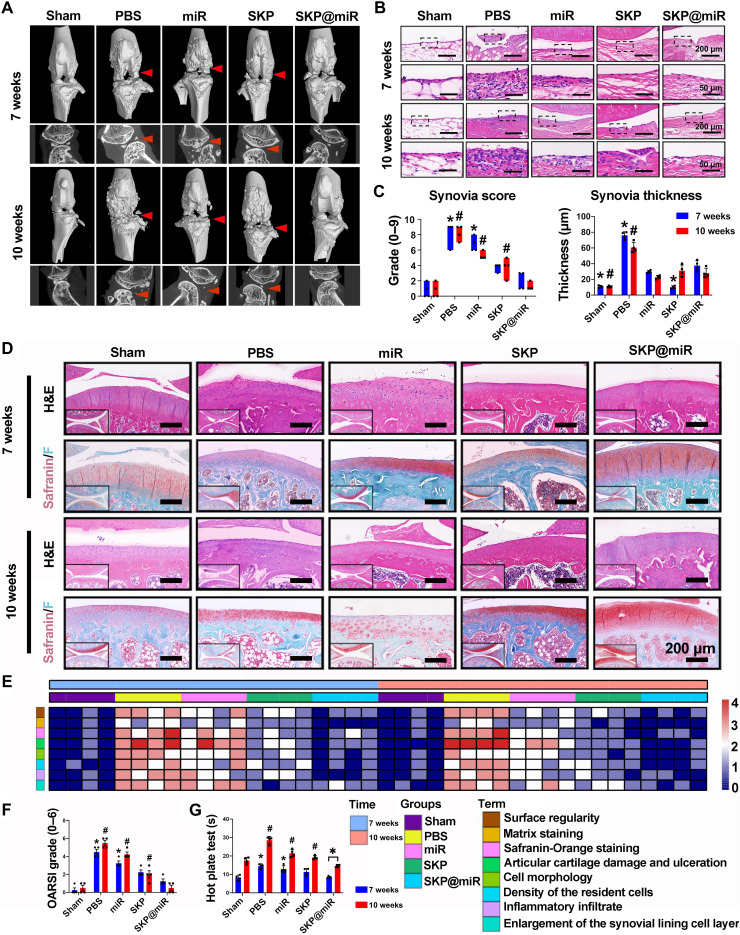
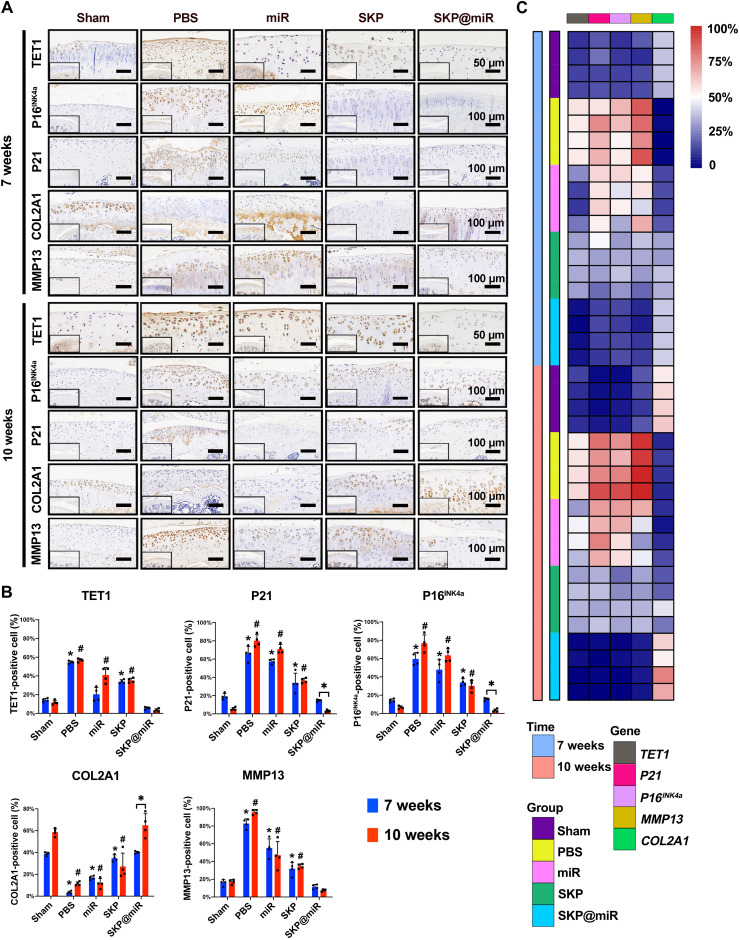
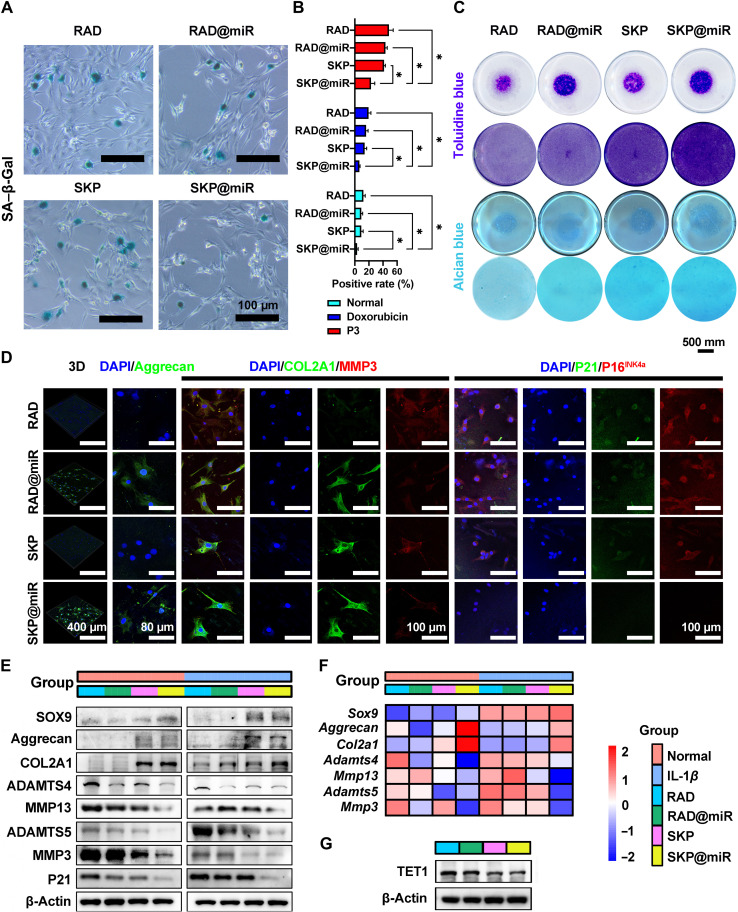
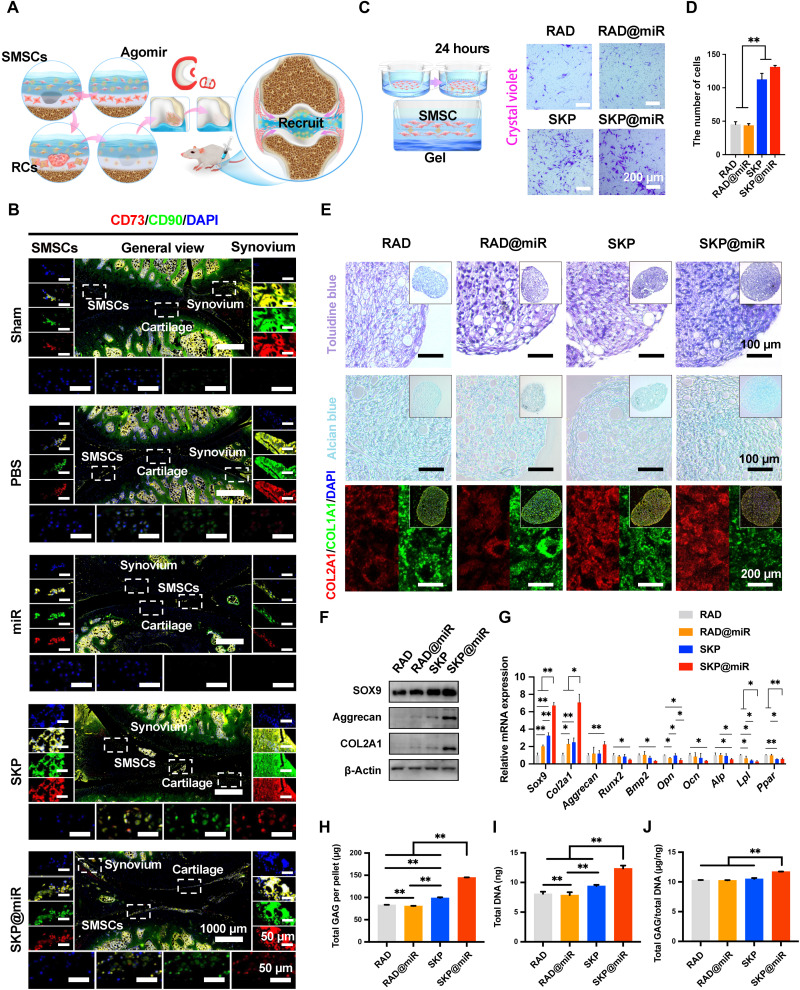
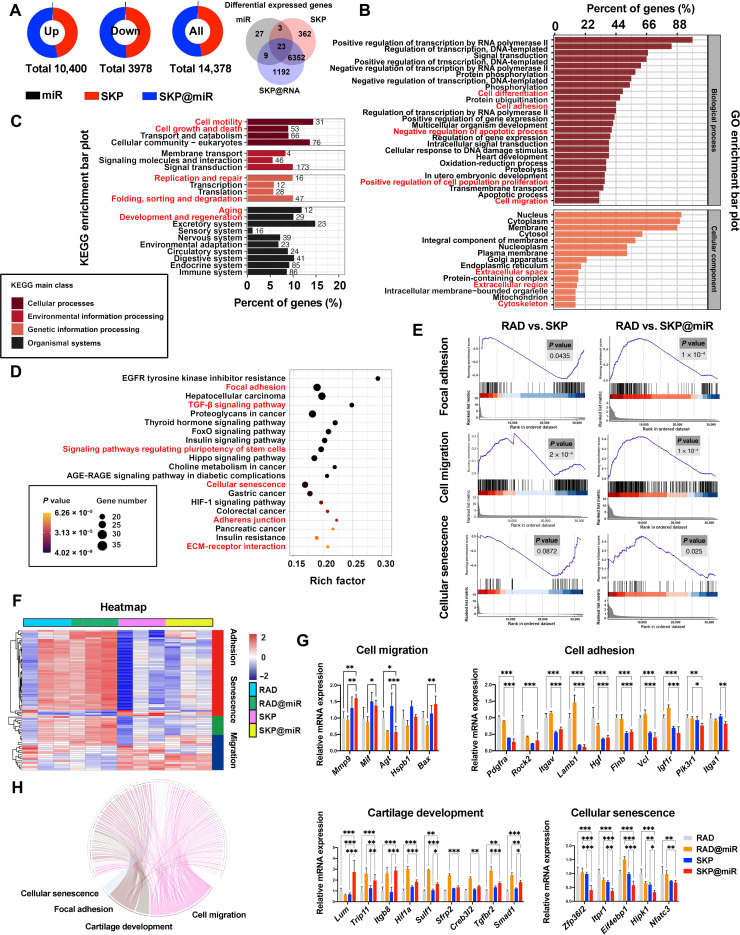
Osteoarthritis (OA) is a common joint disease characterized by progressive loss of cartilage and reduction in lubricating synovial fluid, which lacks effective treatments currently. Here, we propose a hydrogel-based miRNA delivery strategy to rejuvenate impaired cartilage by creating a regenerative microenvironment to mitigate chondrocyte senescence that mainly contributes to cartilage breakdown during OA development. An aging-related miRNA, miR-29b-5p, was first found to be markedly down-regulated in OA cartilage, and their up-regulation suppressed the expression of matrix metalloproteinases and senescence-associated genes (P16INK4a/P21) via ten-eleven-translocation enzyme 1 (TET1). An injectable bioactive self-assembling peptide nanofiber hydrogel was applied to deliver agomir-29b-5p, which was functionalized by conjugating a stem cell-homing peptide SKPPGTSS for endogenous synovial stem cell recruitment simultaneously. Sustained miR-29b-5p delivery and recruitment of synovial stem cells and their subsequent differentiation into chondrocytes led to successful cartilage repair and chondrocyte rejuvenation. This strategy enables miRNA-based therapeutic modality to become a viable alternative for surgery in OA treatment.


Figures

Fig. 1.
Fig. 1.. Identification of functions and targets of miR-29b-5p.
(A and B) Expression of COL2A1, aggrecan, SOX9, MMP3, MMP13, ADAMTS4, ADAMTS5, P16INK4a, and P21 at 2 days after transfection of agomir-29b-5p, agomir-NC, antagomir-29b-5p, and antagomir-NC to rat chondrocytes determined by WB (A) and qRT-PCR (B) (n = 4). (C) Schematic illustration of agomir-29b-5p delivery schedules in aging mice. Representative images of knee cartilage stained with Safranin O/Fast Green and hematoxylin and eosin (H&E) and immunostained with MMP13 and P21. n = 5 mice per group. (D) FISH analysis of miR-29b-5p in rat chondrocytes. (E) Sequencing results of rat chondrocytes transfected with agomir-29b-5p and agomir-NC. n = 3. (F to I) TET1 expression at 2 days after transfection of agomir-29b-5p (F and G), si-TET1, and/or antagomir-29b-5p (H and I) to rat chondrocytes determined by WB (F and H) and qRT-PCR (G and I) (n = 6). (J) Luciferase reporter assay of Tet1 in human embryonic kidney (HEK) 293T cells after transfection with agomir-29b-5p or NC. n = 4. (K and L) Expression of COL2A1, aggrecan, MMP3, MMP13, ADAMTS4, ADAMTS5, P16INK4a, and P21 at 2 days after transfection of si-TET1 and/or antagomir-29b-5p to rat chondrocytes determined by WB (K) and qRT-PCR (L) (n = 4). (M) Immunofluorescence staining of rat chondrocytes at 2 days after si-TET1 transfection. Data are presented as means ± SD. Statistical analysis was performed using two-tailed Student’s t test for (B) and (G) and one-way analysis of variance (ANOVA) for (I), (J), and (L). *P < 0.05 and **P < 0.01. DAPI, 4′,6-diamidino-2-phenylindole.
Fig. 2.
Fig. 2.. Characterization of hydrogel-based miR-29b-5p delivery system.
(A) Schematic illustration of SKP@miR. RAD and SKP peptides self-assemble to form a nanofiber hydrogel with agomir-29b-5p distributed inside. (B) RAD and SKP peptides with agomir-29b-5p form stable hydrogels by adjusting the pH value to neutral. (C) Molecular docking analysis of RAD or SKP peptide interacted with agomir-29b-5p. (D) FITC-labeled agomir-29b-5p in RAD, RAD@miR, SKP, and SKP@miR. (E) Rheological measurements of storage (G′) and loss (G″) moduli of RAD, RAD@miR, SKP, and SKP@miR (0.1 to 10 rad/s at 0.5% strain). (F) Cumulative release of agomir-29b-5p in RAD@miR and SKP@miR in a 37°C incubator. n = 3. (G) Schematic illustration of ACLT-induced OA model and in vivo imaging of Cy5.5-labeled agomir-29b-5p in mice joints at 1, 3, 5, 7, 9, and 14 days after intra-articular injection of hydrogels. Color represents radiant efficiency [(p s−1 cm−2 sr−1)/(μW cm−2)]. n = 3 mice per group. Data are presented as means ± SD.
Fig. 3.
Fig. 3.. Uptake and penetration of agomirs released from hydrogels in vitro and extended effect in vivo.
(A) Representative confocal images of rat chondrocytes (RCs) and SMSCs after being cultured on RAD, RAD@miR, SKP, and SKP@miR for 2 days. Agomir-29b-5p were labeled with FITC. F-actin was stained with rhodamine phalloidin (Rho), and nuclei were stained with DAPI. (B) Representative confocal microscopy images of cross sections of porcine cartilage explants incubated with free Cy5.5-labeled agomir-29b-5p, RAD@miR, and SKP@miR for 1, 2, 3, 4, and 5 days. The arrow indicates the diffusion direction. (C) FISH analysis of miR-29b-5p in rat knee cartilage at 7 and 10 weeks after surgery. Nuclei were stained with DAPI in (B) and (C).
Fig. 4.
Fig. 4.. SKP@miR rescues OA cartilage degeneration after ACLT surgery in rats.
(A) Three-dimensional and planar view reconstruction images of rat knee joints showing the abnormal growth of osteophytes (indicated by arrow) in sham, PBS, miR, SKP, and SKP@miR groups at 7 and 10 weeks. (B) Morphological analysis of the synovium at 7 and 10 weeks indicated by H&E staining. (C) Synovia thickness and total synovia scores of enlargement of the synovial lining cell layer, inflammatory infiltrates, and density of the resident cells. (D) Representative rat knee joint images stained with Safranin O/Fast Green and H&E at 7 and 10 weeks. (E) Heatmap of variables of histological scoring at 7 and 10 weeks. (F) OARSI grades of rat joints at 7 and 10 weeks. (G) Hot plate test of rats at 7 and 10 weeks. n = 4 rats per group. Data are presented as means ± SD. Statistical analysis was performed using one-way ANOVA for intergroup comparison with SKP@miR at 7 or 10 weeks (*P < 0.05 versus SKP@miR group at 7 weeks and #P < 0.05 versus SKP@miR group at 10 weeks) and two-tailed Student’s t test for comparing data at 7 and 10 weeks in SKP@miR group (*P < 0.05) in (C), (F), and (G).
Fig. 5.
Fig. 5.. SKP@miR effectively attenuates senescence of rat joints.
(A) Representative immunohistochemistry staining images of TET1, P16INK4a, P21, COL2A1, and MMP13 of rat knee joints from sham, PBS, miR, SKP, and SKP@miR groups at 7 and 10 weeks. (B) Quantification of histology positive cells of TET1, P21, P16INK4a, COL2A1, and MMP13. (C) Heatmap of positive cell rate of TET1, P21, P16INK4a, MMP13 and COL2A1. n = 4 rats per group. Data are presented as means ± SD. Statistical analysis was performed using one-way ANOVA for intergroup comparison with SKP@miR at 7 or 10 weeks (*P < 0.05 versus SKP@miR group at 7 weeks and #P < 0.05 versus SKP@miR group at 10 weeks) and two-tailed Student’s t test for comparing data at 7 and 10 weeks in SKP@miR group (*P < 0.05) in (B).
Fig. 6.
Fig. 6.. SKP@miR alleviates senescence and maintains catabolic balance in rat chondrocytes.
(A) SA–β-Gal staining images of rat chondrocytes cultured on RAD, RAD@miR, SKP, and SKP@miR for 7 days. (B) Quantification of SA–β-Gal positivity in normal chondrocytes, doxorubicin-treated chondrocytes, and chondrocytes at passage 3 (P3). n = 3. (C) Toluidine blue and Alcian blue staining of chondrocyte micromasses and monolayer chondrocytes cultured with hydrogels for 3 days. (D) Immunofluorescence staining of aggrecan, COL2A1, MMP3, P21, and P16INK4a of rat chondrocytes cultured on hydrogels for 7 days. (E) WB analysis of protein levels of SOX9, aggrecan, COL2A1, ADAMTS4, MMP13, ADAMTS5, MMP3, and P21 in normal and IL-1β–treated chondrocytes cultured on hydrogels for 7 days. (F) qRT-PCR analysis of gene expression of Sox9, Aggrecan, Col2a1, Adamts4, Mmp13, Adamts5, and Mmp3 in normal chondrocytes and IL-1β–treated chondrocytes cultured on hydrogels for 7 days. IL-1β treatment was performed every 2 days. (G) WB analysis of TET1 in normal chondrocytes cultured on hydrogels for 7 days. Data are presented as means ± SD. Statistical analysis was performed using one-way ANOVA. *P < 0.05.
Fig. 7.
Fig. 7.. SKP@miR induces SMSC recruitment and promotes chondrogenic differentiation.
(A) Schematic illustration of the recruitment process pattern of SMSCs during cartilage repair. (B) Immunofluorescence staining of CD90 and CD73 in rat knee joints at 7 weeks after ACLT surgery. SMSCs (left), synovium (right), and chondrocytes (bottom) were shown. Nuclei were stained with DAPI. n = 4 rats per group. (C) Schematic illustration of Transwell assay to monitor SMSC recruitment in vitro. Representative images of Transwell bottom membrane stained with crystal violet after 24-hour culture. (D) Quantification of cells observed at the bottom of the membrane. n = 3. (E) Toluidine blue staining, Alcian blue staining, and immunofluorescence staining of COL2A1 and COL1A1 in SMSC pellets after 14-day culture on RAD, RAD@miR, SKP, and SKP@miR. (F) WB analysis of protein levels of SOX9, aggrecan, and COL2A1 in SMSC pellets. (G) qRT-PCR analysis of gene expression of Sox9, Col2a1, Aggrecan, Runx2, Bmp2, Opn, Ocn, Alp, Lpl, and Ppar in SMSC pellets. n = 3. Values were normalized to β-actin levels, and RAD group was used as the control group. (H to J) Quantification of total GAG content per pellet (H), total DNA content per pellet (I), and GAG/DNA content (J) of SMSC pellets. Data are presented as means ± SD. Statistical analysis was performed using one-way ANOVA. *P < 0.05 and **P < 0.01.
Fig. 8.
Fig. 8.. Intrinsic mechanisms of SKP@miR on SMSC behavior.
(A) Differentially expressed mRNA in miR, SKP, and SKP@miR groups [*P < 0.05, |log2(fold change)| > 1]. (B) GO enrichment bar plots (cell differentiation, cell adhesion, negative regulation apoptotic process, positive regulation of cell population proliferation, and cell migration). (C) KEGG enrichment bar plots (cell motility, cell growth and death, replication and repair, folding, sorting and degradation, aging, and development and regeneration). (D) KEGG enrichment analysis (focal adhesion, TGF-β signaling pathway, signaling pathways regulating pluripotency of stem cells, cellular senescence, adherens junction, and ECM-receptor interaction). AGE-RAGE, age range; HIF-1, hypoxia inducible factor-1. (E) GSEA enrichment analysis of focal adhesion between RAD and SKP (P = 0.0435) and between RAD and SKP@miR (P < 0.0001), cellular senescence between RAD and SKP (P = 0.0872) and between RAD and SKP@miR (P = 0.025), and cell migration between RAD and SKP (P < 0.0002) and between RAD and SKP@miR (P < 0.0001). (F) Heatmap of genes related to cell adhesion, senescence, and migration in RAD, RAD@miR, SKP, and SKP@miR groups. n = 3. (G) qRT-PCR analysis of genes associated with cell migration, cell adhesion, cartilage development, and cellular senescence. n = 3. (H) Expression and crossover of each gene of cellular senescence, focal adhesion, cartilage development, and cell migration. Data are presented as means ± SD. Statistical analysis was performed using one-way ANOVA. *P < 0.05, **P < 0.01, and ***P < 0.001.

Comment in

  • Targeting senescence in OA.
    Attwaters M. Attwaters M. Nat Rev Rheumatol. 2022 Jun;18(6):305. doi: 10.1038/s41584-022-00788-2. Nat Rev Rheumatol. 2022. PMID: 35505106 No abstract available.

Similar articles

Cited by

References

    1. Hootman J. M., Helmick C. G., Projections of US prevalence of arthritis and associated activity limitations. Arthritis Rheum. 54, 226–229 (2006). - PubMed
    1. Loeser R. F., Goldring S. R., Scanzello C. R., Goldring M. B., Osteoarthritis: A disease of the joint as an organ. Arthritis Rheum. 64, 1697–1707 (2012). - PMC - PubMed
    1. Hunter D. J., Bierma-Zeinstra S., Osteoarthritis. Lancet 393, 1745–1759 (2019). - PubMed
    1. Prieto-Alhambra D., Judge A., Javaid M. K., Cooper C., Diez-Perez A., Arden N. K., Incidence and risk factors for clinically diagnosed knee, hip and hand osteoarthritis: Influences of age, gender and osteoarthritis affecting other joints. Ann. Rheum. Dis. 73, 1659–1664 (2014). - PMC - PubMed
    1. Stanton H., Rogerson F. M., East C. J., Golub S. B., Lawlor K. E., Meeker C. T., Little C. B., Last K., Farmer P. J., Campbell I. K., Fourie A. M., Fosang A. J., ADAMTS5 is the major aggrecanase in mouse cartilage in vivo and in vitro. Nature 434, 648–652 (2005). - PubMed