. 2022 Apr;8(13):eabj5362.
doi: 10.1126/sciadv.abj5362. Epub 2022 Mar 30.

Asynchronous nuclear cycles in multinucleated Plasmodium falciparum facilitate rapid proliferation

Affiliations

Asynchronous nuclear cycles in multinucleated Plasmodium falciparum facilitate rapid proliferation

Severina Klaus et al. Sci Adv. 2022 Apr.

Abstract

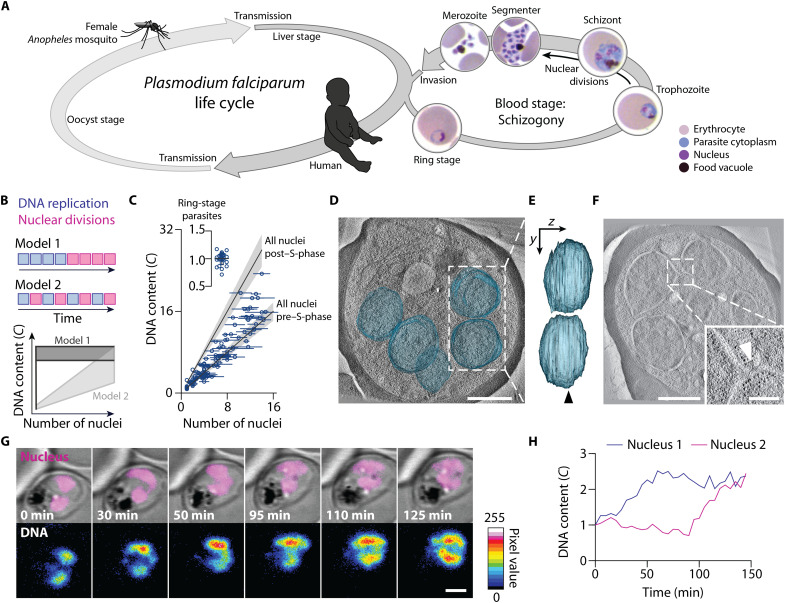
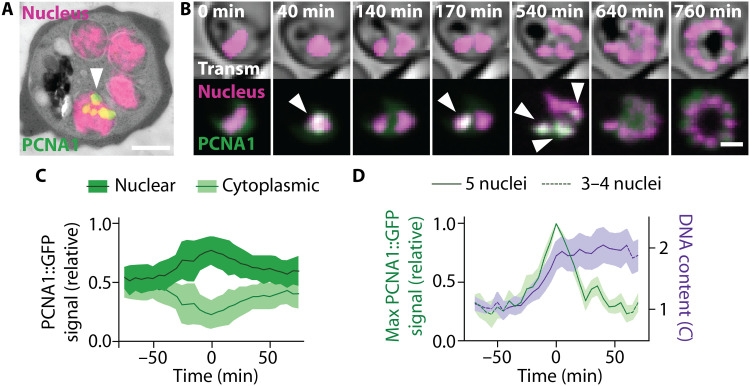
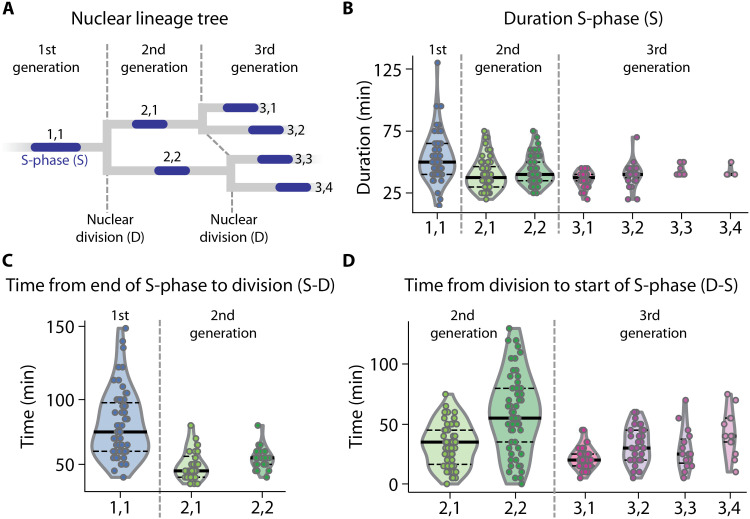
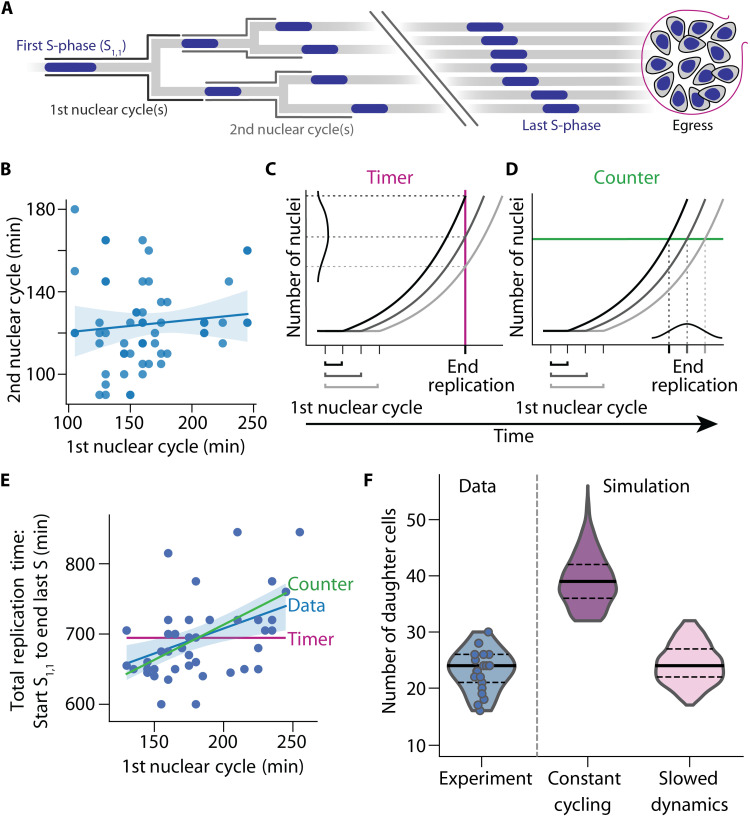
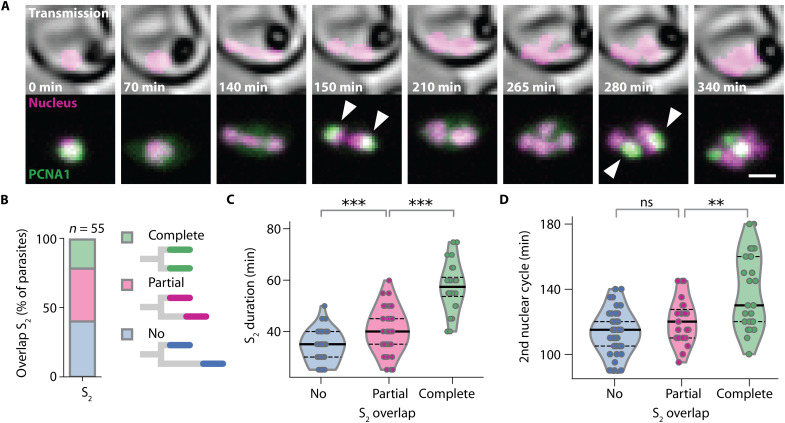
Malaria-causing parasites proliferate within erythrocytes through schizogony, forming multinucleated stages before cellularization. Nuclear multiplication does not follow a strict geometric 2n progression, and each proliferative cycle produces a variable number of progeny. Here, by tracking nuclei and DNA replication, we show that individual nuclei replicate their DNA at different times, despite residing in a shared cytoplasm. Extrapolating from experimental data using mathematical modeling, we provide strong indication that a limiting factor exists, which slows down the nuclear multiplication rate. Consistent with this prediction, our data show that temporally overlapping DNA replication events were significantly slower than partially overlapping or nonoverlapping events. Our findings suggest the existence of evolutionary pressure that selects for asynchronous DNA replication, balancing available resources with rapid pathogen proliferation.


Figures

Fig. 1.
Fig. 1.. P. falciparum proliferates through consecutive rounds of asynchronous DNA replications and nuclear divisions.
(A) Scheme of the P. falciparum life cycle, alternating between female Anopheles mosquitoes and humans. Multinucleation occurs in the oocyst, liver, and blood stage. Blood-stage development starts with the ring stage, followed by the trophozoite. Asynchronous nuclear divisions occur in the subsequent schizont stage. At the end of this stage, cellularization occurs and the segmenter is formed, containing nascent daughter cells called merozoites. Egress releases the merozoites that can then infect another erythrocyte. (B) Schematic and predictions of two models proposing the mode of P. falciparum proliferation in the blood stage of infection. (C) Gradual increase of the total DNA content and the number of nuclei of P. falciparum supports model 2. The DNA content was normalized to haploid ring-stage parasites (insert), defined as 1C. Horizontal bars, SD; gray lines, expected DNA contents of parasites with all nuclei before or after S-phase; gray bands, propagated error (SD) of ring-stage measurements. (D) Electron tomogram, overlayed with 3D-segmented inner nuclear membranes (blue); scale bar, 1 μm; see movie S1. (E) Side view of nuclear volumes showed no connection (90° rotation around the y axis); arrowhead, tomogram plane shown in (D). (F) Electron tomogram of connected nuclei; scale bar, 1 μm; inset highlights the connection (arrowhead); scale bar, 250 nm. (G) Time-lapse microscopy of a reporter parasite stained with the DNA dye 5-SiR-Hoechst showed asynchronous DNA replication in sister nuclei; scale bar, 2 μm; see movie S3. (H) Quantification of the DNA content of the nuclei shown in (G).
Fig. 2.
Fig. 2.. Heterogeneous accumulation of PCNA1::GFP among nuclei permits development of a nuclear cycle sensor system.
(A) Correlative light and electron microscopy showed heterogeneous accumulation of PCNA1::GFP among P. falciparum nuclei; scale bar, 1 μm; arrowhead, PCNA1::GFP focus. (B) Time-lapse microscopy showed dynamic and transient accumulation of PCNA1::GFP; scale bar 2 μm; arrowheads, nuclear PCNA1::GFP accumulation; see movies S4 and S5. (C) Nuclear accumulation of PCNA1::GFP coincided with a depletion of the cytosolic pool; lines, average (n = 4); bands, SD. (D) Nuclear PCNA1::GFP accumulation caused a peak in the maximal pixel intensity, coinciding with DNA content duplication. DNA content was normalized to the average of 10 or all available values before the nuclear accumulation of PCNA1::GFP, defined as 1C; solid lines, average; bands, SD.
Fig. 3.
Fig. 3.. Single-cell dynamics of nuclear multiplication.
(A) Nuclear lineage tree illustrating the three consecutive generations of nuclei quantified in (B) to (D). Dashed lines, nuclear divisions D demarcating generations and defined as the first time point where two separate daughter nuclei were observed; blue, S-phases S defined as the interval during which PCNA1::GFP accumulation was observed in a nucleus; nuclei are numbered by generation and in order of S-phase occurrence (e.g., 2,1: second generation, first S-phase). (B) S-phase durations of three generations of nuclei. S1,1 phases were longer than the pooled second-generation S-phases S2,1/2 (two-sided Mann-Whitney U test effect size f = 0.72, n1 = 54, n2 = 117, P = 3.2 × 10⁻⁶), and S2,1/2 was the same as S3,1/2/3/4 (f = 0.51, n1 = 117, n2 = 75, P = 0.85). (C) Time from end of S-phase to nuclear division (S-D) of two generations of nuclei. (S-D)1,1 was longer than (S-D)2,1/2 (f = 0.87, n1 = 63, n2 = 60, P = 8.1 × 10⁻¹³). (D) Time from nuclear division to start of S-phase (D-S) of two generations of nuclei. (D-S)2,1/2 was longer than (D-S)3,1/2/3/4 (f = 0.66, n1 = 119, n2 = 91, P = 4.2 × 10⁻⁵). Numbering of events in (B) to (D) as indicated in (A); each dot represents an event occurring in a single nucleus of a single parasite of 70 parasites analyzed; solid lines, median; horizontal dashed lines, quartiles.
Fig. 4.
Fig. 4.. Simulation of P. falciparum proliferation predicts slowing nuclear cycle dynamics.
(A) Nuclear lineage tree illustrating events of P. falciparum proliferation that were quantified in single parasites. S-phases depicted blue; nuclear cycles are defined as the total time from the start of an S-phase until the start of ensuing S-phases. Break indicates events that could not be individually resolved in the experiments. (B) The duration of the first and second nuclear cycles showed no correlation (Spearman’s ρ = 0.14, n = 58, P = 0.28); solid line, linear regression; band, bootstrapped 95% confidence interval. (C and D) Schematic illustrating how the duration of the first nuclear cycle affects the time needed to complete nuclear multiplication. (C) Timer mechanism with a set total time (red line) predicts no correlation. (D) Counter mechanism with a set total number of nuclei (green line) predicts a positive correlation. (E) Time-lapse imaging data showed a positive correlation between duration of first nuclear cycle and total time needed, i.e., time from start S1,1 to end of last S-phase (ρ = 0.42, n = 46, P = 0.0034), supporting a counter mechanism and contradicting a timer mechanism; blue solid line and band, linear regression and bootstrapped 95% confidence interval; red solid line, timer prediction; green solid line, counter prediction if all events were synchronous. (F) Mathematical model with slowing nuclear cycling dynamics (17% per cycle) fitted the experimental data best; solid lines, median; dashed lines, quartiles.
Fig. 5.
Fig. 5.. Asynchronous nuclear cycles facilitate rapid parasite proliferation.
(A) Time-lapse microscopy of a parasite with synchronous DNA replication events (arrowheads); scale bar, 2 μm; see movie S6. (B) Fraction of parasites with completely, partially, and not overlapping S2,1 and S2,2. (C) Durations of S-phases increased with the degree of temporal overlap; solid lines, median; dashed lines, quartiles; two-sided Mann-Whitney U test, no versus partial overlap, f = 0.28, n1 = 44, n2 = 42, P = 2.7 × 10⁻⁴; partial versus complete overlap, f = 0.10, n1 = 42, n2 = 24, P = 5.9 × 10⁻⁸. (D) Nuclear cycles containing synchronous S-phases were longer; solid lines, median; dashed lines, quartiles; no versus partial overlap, f = 0.36, n1 = 41, n2 = 23, P = 0.07; partial versus complete overlap, f = 0 .27, n1 = 23, n2 = 26, P = 0.0067. ns, not significant; **P < 0.01; ***P < 0.001.

Comment in

Similar articles

Cited by

References

    1. Adl S. M., Bass D., Lane C. E., Lukeš J., Schoch C. L., Smirnov A., Agatha S., Berney C., Brown M. W., Burki F., Cárdenas P., Čepička I., Chistyakova L., Campo J., Dunthorn M., Edvardsen B., Eglit Y., Guillou L., Hampl V., Heiss A. A., Hoppenrath M., James T. Y., Karnkowska A., Karpov S., Kim E., Kolisko M., Kudryavtsev A., Lahr D. J. G., Lara E., Gall L. L., Lynn D. H., Mann D. G., Massana R., Mitchell E. A. D., Morrow C., Park J. S., Pawlowski J. W., Powell M. J., Richter D. J., Rueckert S., Shadwick L., Shimano S., Spiegel F. W., Torruella G., Youssef N., Zlatogursky V., Zhang Q., Revisions to the classification, nomenclature, and diversity of eukaryotes. J. Eukaryot. Microbiol. 66, 4–119 (2019). - PMC - PubMed
    1. Mitchison-Field L. M. Y., Vargas-Muñiz J. M., Stormo B. M., Vogt E. J. D., Dierdonck S. V., Pelletier J. F., Ehrlich C., Lew D. J., Field C. M., Gladfelter A. S., Unconventional cell division cycles from marine-derived yeasts. Curr. Biol. 29, 3439–3456.e5 (2019). - PMC - PubMed
    1. Farrell J. A., O’Farrell P. H., From egg to gastrula: How the cell cycle is remodeled during the Drosophila mid-blastula transition. Annu. Rev. Genet. 48, 1–26 (2014). - PMC - PubMed
    1. Berger F., Endosperm development. Curr. Opin. Plant Biol. 2, 28–32 (1999). - PubMed
    1. Boyle W. J., Simonet W. S., Lacey D. L., Osteoclast differentiation and activation. Nature 423, 337–342 (2003). - PubMed