Structure-to-process design framework for developing safer pesticides
- PMID: 35353571
- PMCID: PMC8967227
- DOI: 10.1126/sciadv.abn2058
Structure-to-process design framework for developing safer pesticides
Abstract
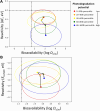
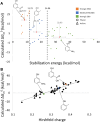
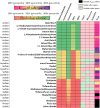
Rational design of pesticides with tunable degradation properties and minimal ecotoxicity is among the grand challenges of green chemistry. While computational approaches have gained traction in predictive toxicology, current methods lack the necessary multifaceted approach and design-vectoring tools needed for system-based chemical development. Here, we report a tiered computational framework, which integrates kinetics and thermodynamics of indirect photodegradation with predictions of ecotoxicity and performance, based on cutoff values in mechanistically derived physicochemical properties and electronic parameters. Extensively validated against experimental data and applied to 700 pesticides on the U.S. Environmental Protection Agency's registry, our simple yet powerful approach can be used to screen existing molecules to identify application-ready candidates with desirable characteristics. By linking structural attributes to process-based outcomes and by quantifying trade-offs in safety, depletion, and performance, our method offers a user-friendly roadmap to rational design of novel pesticides.
Figures


Similar articles
-
Structure-Energetics-Property Relationships Support Computational Design of Photodegradable Pesticides.Environ Sci Technol. 2021 Sep 7;55(17):11713-11722. doi: 10.1021/acs.est.1c02556. Epub 2021 Aug 24. Environ Sci Technol. 2021. PMID: 34428037
-
Computational toxicology as implemented by the U.S. EPA: providing high throughput decision support tools for screening and assessing chemical exposure, hazard and risk.J Toxicol Environ Health B Crit Rev. 2010 Feb;13(2-4):197-217. doi: 10.1080/10937404.2010.483935. J Toxicol Environ Health B Crit Rev. 2010. PMID: 20574897
-
Revised framework for pesticide aquatic environmental exposure assessment that accounts for vegetative filter strips.Environ Sci Technol. 2010 May 15;44(10):3839-45. doi: 10.1021/es100506s. Environ Sci Technol. 2010. PMID: 20394426
-
Photodegradation of pesticides on plant and soil surfaces.Rev Environ Contam Toxicol. 2004;182:1-189. doi: 10.1007/978-1-4419-9098-3_1. Rev Environ Contam Toxicol. 2004. PMID: 15217019 Review.
-
The U.S. experience in promoting sustainable chemistry.Environ Sci Pollut Res Int. 2005;12(2):115-23. doi: 10.1065/espr2005.02.235. Environ Sci Pollut Res Int. 2005. PMID: 15859119 Review.
Cited by
-
Stability Study and Handling Recommendations for Multiresidue Pesticide Mixes under Diverse Storage Conditions for LC-MS/MS and GC-MS/MS.J AOAC Int. 2023 Nov 2;106(6):1550-1563. doi: 10.1093/jaoacint/qsad096. J AOAC Int. 2023. PMID: 37701991 Free PMC article.
-
Cheminformatics and artificial intelligence for accelerating agrochemical discovery.Front Chem. 2023 Nov 29;11:1292027. doi: 10.3389/fchem.2023.1292027. eCollection 2023. Front Chem. 2023. PMID: 38093816 Free PMC article. Review.
-
Mimicking reductive dehalogenases for efficient electrocatalytic water dechlorination.Nat Commun. 2023 Aug 23;14(1):5134. doi: 10.1038/s41467-023-40906-6. Nat Commun. 2023. PMID: 37612275 Free PMC article.
References
-
- P. Anastas, J. Warner, Green chemistry: Theory and practice (Oxford Univ. Press, 1998), pp. 29–56.
-
- Hamilton A., Industrial poisons in the united states. Nature 116, 604 (1925).
-
- Coish P., Brooks B. W., Gallagher E. P., Kavanagh T. J., Voutchkova-Kostal A., Zimmerman J. B., Anastas P. T., Current status and future challenges in molecular design for reduced hazard. Sustainable Chem. Eng. 4, 5900–5906 (2016).
-
- Clymer T., Vargas V., Corcoran E., Kleinberg R., Kostal J., Redesigning hazardous chemicals by learning from structure-based drug discovery. Green Chem. 21, 1935–1946 (2019).
LinkOut - more resources
Full Text Sources

