. 2022 Apr;8(13):eabj3995.
doi: 10.1126/sciadv.abj3995. Epub 2022 Mar 30.

Formation of cellular close-ended tunneling nanotubes through mechanical deformation

Affiliations

Formation of cellular close-ended tunneling nanotubes through mechanical deformation

Minhyeok Chang et al. Sci Adv. 2022 Apr.

Abstract

Membrane nanotubes or tunneling nanotubes (TNTs) that connect cells have been recognized as a previously unidentified pathway for intercellular transport between distant cells. However, it is unknown how this delicate structure, which extends over tens of micrometers and remains robust for hours, is formed. Here, we found that a TNT develops from a double filopodial bridge (DFB) created by the physical contact of two filopodia through helical deformation of the DFB. The transition of a DFB to a close-ended TNT is most likely triggered by disruption of the adhesion of two filopodia by mechanical energy accumulated in a twisted DFB when one of the DFB ends is firmly attached through intercellular cadherin-cadherin interactions. These studies pinpoint the mechanistic questions about TNTs and elucidate a formation mechanism.


Figures

Fig. 1.
Fig. 1.. SFB formation from DFB.
(A) Colocalization of F-actin in each HeLa cell transfected to contain Lifeact-EGFP or Lifeact-mCherry in each HeLa cell. The HeLa cells were cultured together in a 1:1 ratio (Methods). The triangles indicate the end of each actin protrusion (filopodium) that consists of intercellular connections. (B) Frequencies of DFBs and SFBs in cells fixed at different times showing a significant increase in the frequency of SFBs from 33 to 50% (n = 242 and 158 SFBs obtained from Ncell = 116 and 60 cell pairs in Nexp = 4 independent experiments). The P = 0.008 (DFB) and P = 0.010 (SFB) by two-sided Student’s t test (degrees of freedom = 6 , ** for P ≤ 0.01). The error bars indicate the SD. (C) Dynamics of the transition of DFBs to SFBs during real-time imaging of live HeLa cells. Yellow lines indicate the overlap of two filopodia. (D) During a 1-hour-long time-lapse imaging, some newly formed (n = 11) or preexisting (n = 33) DFBs developed into new SFBs (n = 6, 13%) or were disrupted (n = 14, 31%), while others remained in the DFB states (n = 25, 56%). The number of cells Ncell = 17 and time-lapse experiments were performed by recording every 5 or 10 s with a 100-ms exposure time.
Fig. 2.
Fig. 2.. N-cadherin clusters on DFBs/TNTs.
(A) DFB or SFB occurrence in N-cadherin down-regulated cells 72 hours after 60 nM siRNA transfection (n = 222, Ncell = 538 for control RNA and n = 147, Ncell = 741 for siRNA, normalized by control). *P = 0.019 by one-sided Student’s t test. (B) N-cadherin molecules on DFBs and SFBs colocalized in live HeLa cells expressing N-cadherin–EGFP or N-cadherin–mScarlet-I. The images were obtained by averaging the intensity of each pixel in 91 consecutive frames. (C) Local correlation between EGFP and mScarlet-I labeled on N-cadherin in two-color imaging (Methods). The local correlations were normalized with the maximum local correlation of each DFB or SFB, and the negative local correlation was set to 0.
Fig. 3.
Fig. 3.. Intercellular calcium transfer through HeLa SFB.
Following selective uncaging of caged calcium (DMNPE-4) in a single cell by UV exposure (365 nm), calcium transfer to the connected cell through DFBs or SFBs was imaged by monitoring the intensity change of calcium indicator dye (Cal-520) in each cell (fig. S7 and Methods). (A and B) Representative intensity traces. While calcium indicator intensity increases markedly in the target cells by uncaging (40 s), the connected cell through DFB shows no intensity change, but correlated intensity increase was observed in the partner cell connected through SFB. Follow-up uncaging in the partner cell shows the directionality of Ca2+ transfer through DFBs. DFBs or SFBs were classified by N-cadherin distribution along their lengths. AU, arbitrary units. (C) Calcium transfer probability to partner cells at the first uncaging on target cells represent that most SFBs deliver calcium signal in contrast to DFBs (Ncell pairs = 60 from three independent experiments). (D) Direction of Ca2+ transfer invested at the second uncaging was unidirectional mostly on DFBs or SFBs (Ncell pairs = 20 from three independent experiments). (E) When only SFBs with confirmed terminal N-cadherin clusters were counted, they all transferred calcium unidirectionally.
Fig. 4.
Fig. 4.. Helical twisting of DFB in super-resolution microscopy.
(A) Helical structures of DFBs were resolved in fixed HeLa, U2OS, and HEK-293 cells (fixed between 36 and 60 hour from seeding) by STORM using Alexa Fluor 647-phalloidin. DFB0 and DFB1 were imaged in living HeLa cells using a two-color SRRF microscopy. Lifeact-EGFP or Lifeact-mCherry was transfected into HeLa cells for F-actin staining. Images of living cells were taken 48 hours after cell seeding. (B) Helical structures were characterized by determining the half-pitch (the lengthwise interval between two intersections of protrusions: n = 86). The peak and width of each quantity were determined by Gaussian fitting. (C) Occurrence of DFB with or without the helical structure and TNT in living cells (HeLa: n = 227, Ncell pair = 121, U2OS: n = 180, Ncell pair = 68, and HEK-293: n = 95, Ncell pair = 69). “Unresolved” indicates that it is not clear whether the structure is twisted (see the top-left image). (D) Proportion of helical DFBs to DFBs was normalized and compared to investigate the contribution of myosin motors to twisting by knocking down the proteins with 60 nM siRNA (NDFB = 32 for control, NDFB = 31 for myosin Va, NDFB = 34 for myosin Vb, NDFB = 75 for myosin Va and Vb, NDFB = 68 for myosin IIa, NDFB = 73 for myosin IIb, and NDFB = 242 for myosin IIa and IIb). P = 0.00674 for myosin Va, P = 0.00084 for myosin Vb, P = 0.00674 for myosin Va and Vb, P = 0.00952 for myosin IIa, P = 0.00326 for myosin IIb, and P = 0.00538 for myosin IIa and IIb by one-sided Student’s t test. **P ≤ 0.01, ***P ≤ 0.005. DFBs were imaged by SRRF microscopy of live HeLa cells expressing Lifeact-mNeonGreen and Lifeact–mScarlet-I.
Fig. 5.
Fig. 5.. Elastic properties of DFB/TNT.
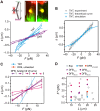
(A) Representative force extension curves of DFBs (n = 3 and L = 9.4, 15.6, and 20.8 μm) and TNTs (n = 5 and L = 12.5, 12.8, 14.7, 15.2, and 15.5 μm) using optical tweezers. +s, pulling to the right; −s: pulling to the left. Inset: Representative images of DFB/TNT in the pulling experiment. (B) The experimental force extension curve of TNTs (seven trajectory average) compared to the simulated extension curve (blue dots) and the theoretical response of a semiflexible filament subject to a force F (solid line; see Supplementary Text). The equation of motion was solved in units of the integration time step of 10 ns, with the bending modulus kb = 1.5 × 10² kBT ∙ μm, the stretching modulus ks = 3 × 10⁴ kBT/μm2, and the shear modulus ksh = 3 × 10⁴ kBT in Heff. (C) Simulation results present the force extension relation of a TNT and DFBs with the helical turns from zero to five. (D) Force F* to deform DFBs or TNTs by s = 0.01 L (L: the contour length at F = 0) in the experiment and simulations. The experimental data are plotted for DFBs of various L ranging from ~10 to ~25 μm. The simulation data show F* for DFBs (or TNTs) of L = 10, 15, and 20 μm at zero to four helical turns.
Fig. 6.
Fig. 6.. The DFB-to-TNT transition in the simulation.
(A) A DFB with a contact length of 10 μm was constructed with two opposing filopodia with randomly distributed binding sites, with an average separation of 1.4 ± 0.9 μm (fig. S13). The filopodia of a DFB0 were pulled and twisted by a retractile force (f) and a torque (τ), respectively. The plotted heatmap shows the number of helical turns in the DFB0 as a function of the applied f and τ. The disruption point makes a phase boundary line starting from (f, τ) = (0 pN, 1.25 pN·μm) to (7.3 pN, 0 pN·μm). The gray region (τ > 1.25 pN·μm or f > 7.3 pN) indicates the phase in which the DFB0 was disrupted into two separate filopodia upon the applied force and torque. (B) Phase diagram showing the DFB-to-TNT transition in two distinct situations. The red curve corresponds to the disruption line for a DFB1 in which one of the filopodia is anchored in the opposite cell body and a rotationally fixed state. The black curve is for DFB0 in (A), where the growing ends of both filopodia were rotationally free. DFB1 with a fixed end can be more easily disrupted into a TNT with a lower retractile force, especially in the small torque regime. The shaded region indicates the enhanced TNT-driven mechanical condition due to rotation fixation. It can be inferred that DFB can mechanically transform into TNT at retractile cytoskeletal forces of <8 pN. The phase diagram was obtained from the simulation data of >200 at every grid point of (f, τ).

References

    1. Rustom A., Saffrich R., Markovic I., Walther P., Gerdes H. H., Nanotubular highways for intercellular organelle transport. Science 303, 1007–1010 (2004). - PubMed
    1. Önfelt B., Nedvetzki S., Benninger R. K. P., Purbhoo M. A., Sowinski S., Hume A. N., Seabra M. C., Neil M. A. A., French P. M. W., Davis D. M., Structurally distinct membrane nanotubes between human macrophages support long-distance vesicular traffic or surfing of bacteria. J. Immunol. 177, 8476–8483 (2006). - PubMed
    1. Veranic P., Lokar M., Schutz G. J., Weghuber J., Wieser S., Hagerstrand H., Kralj-Iglic V., Iglic A., Different types of cell-to-cell connections mediated by nanotubular structures. Biophys. J. 95, 4416–4425 (2008). - PMC - PubMed
    1. Önfelt B., Nedvetzki S., Yanagi K., Davis D. M., Cutting edge: Membrane nanotubes connect immune cells. J. Immunol. 173, 1511–1513 (2004). - PubMed
    1. Sherer N. M., Lehmann M. J., Jimenez-Soto L. F., Horensavitz C., Pypaert M., Mothes W., Retroviruses can establish filopodial bridges for efficient cell-to-cell transmission. Nat. Cell Biol. 9, 310–315 (2007). - PMC - PubMed