. 2022 Mar;103(3):10.1099/jgv.0.001724.
doi: 10.1099/jgv.0.001724.

Differential gene expression reveals host factors for viral shedding variation in mallards (Anas platyrhynchos) infected with low-pathogenic avian influenza virus

Affiliations

Differential gene expression reveals host factors for viral shedding variation in mallards (Anas platyrhynchos) infected with low-pathogenic avian influenza virus

Amanda C Dolinski et al. J Gen Virol. 2022 Mar.

Abstract

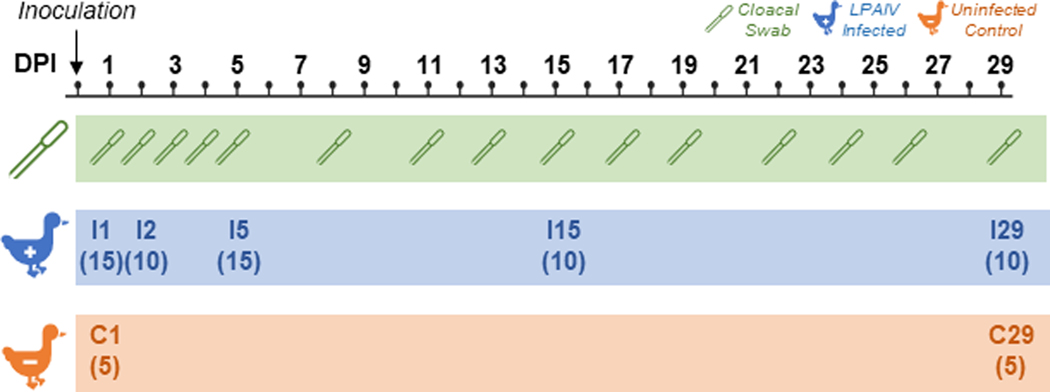
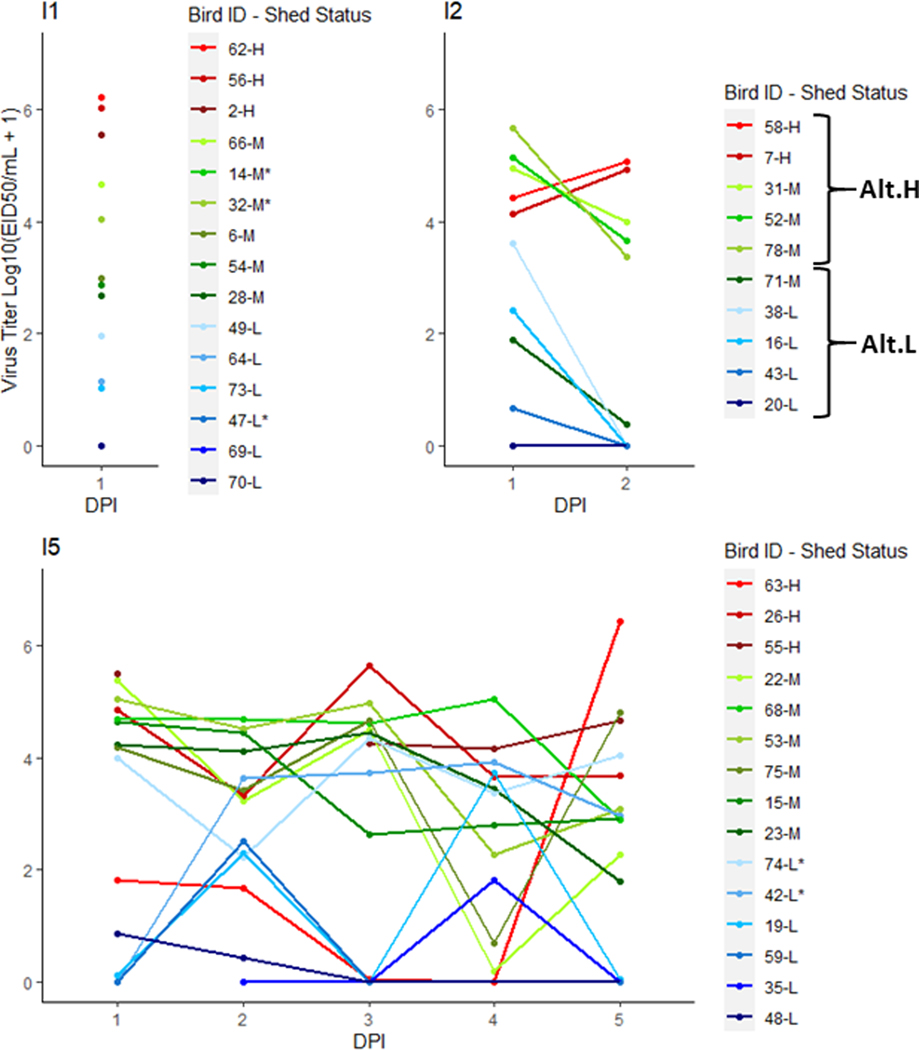
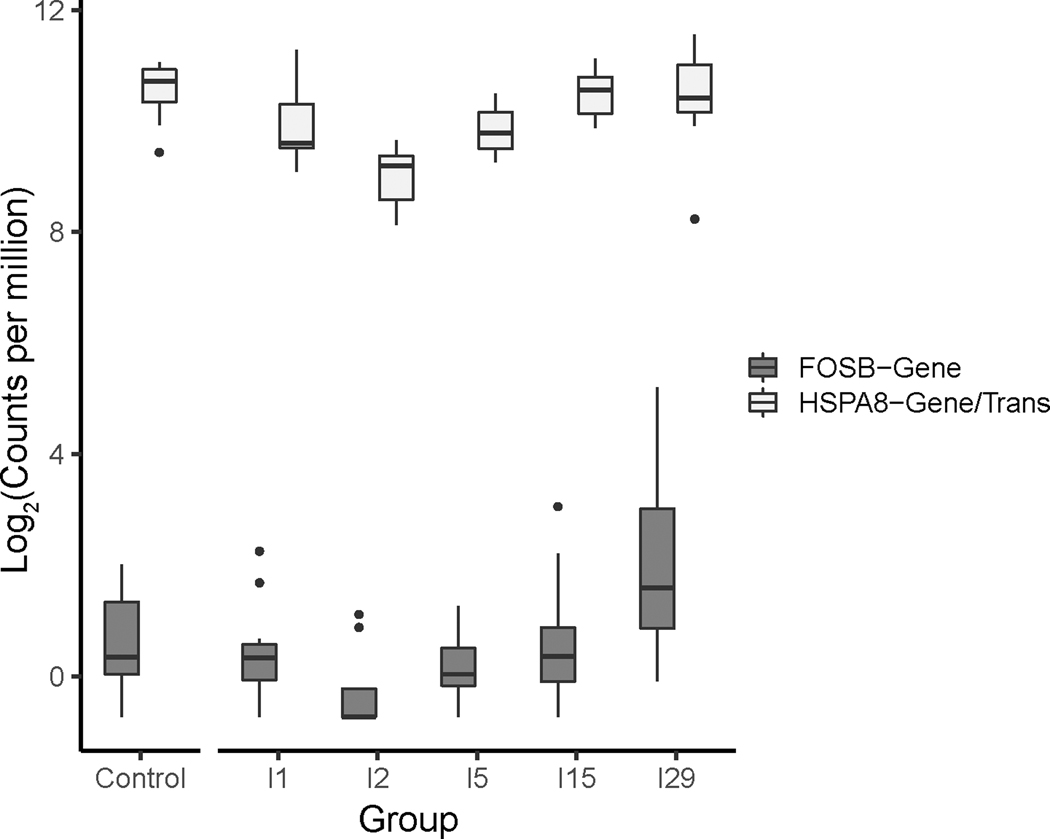
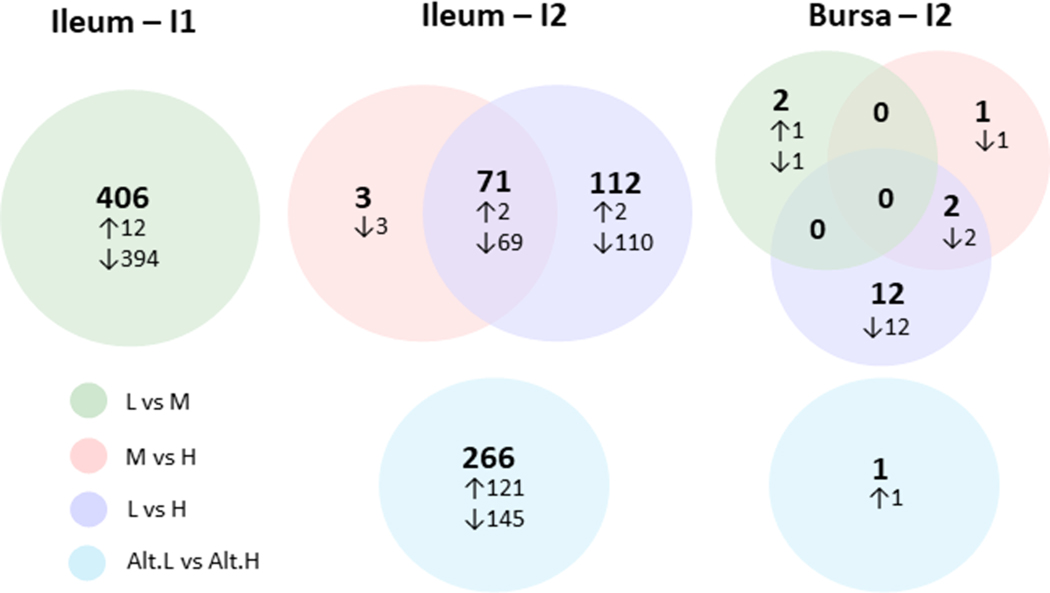
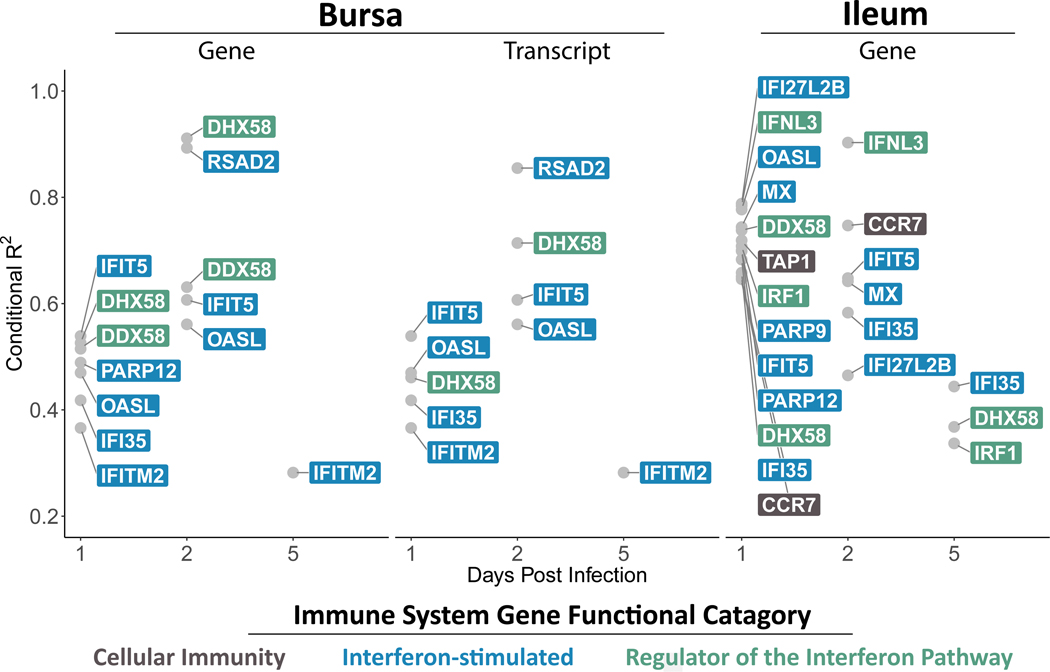
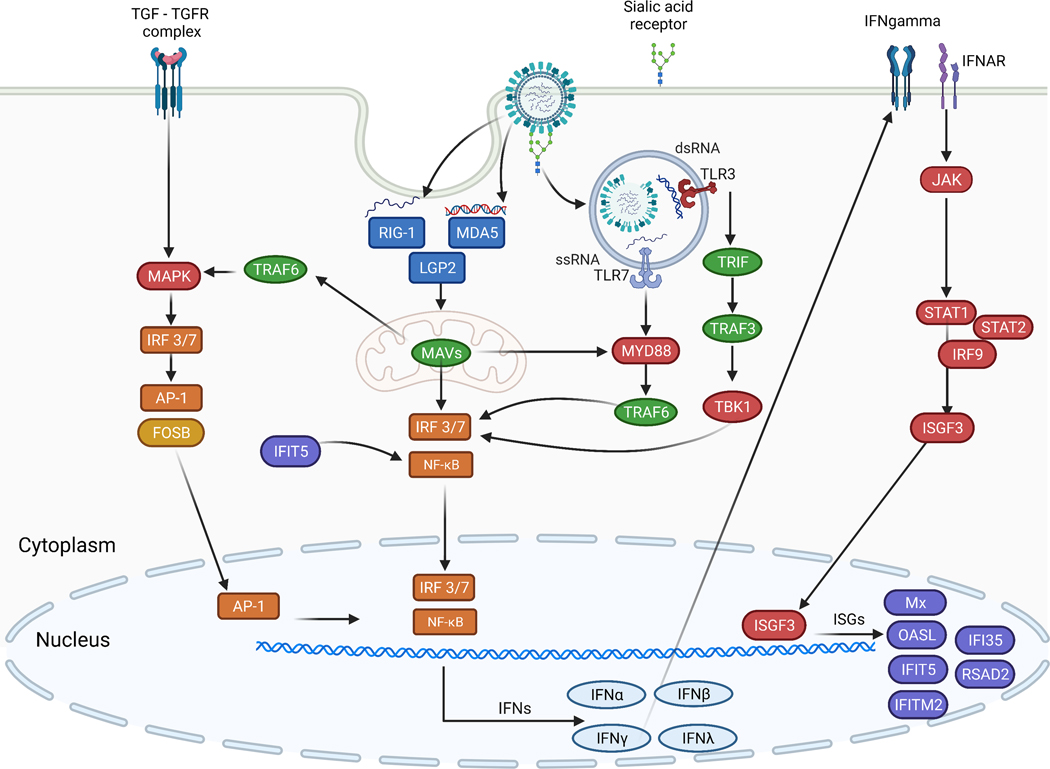
Intraspecific variation in pathogen shedding impacts disease transmission dynamics; therefore, understanding the host factors associated with individual variation in pathogen shedding is key to controlling and preventing outbreaks. In this study, ileum and bursa of Fabricius tissues of wild-bred mallards (Anas platyrhynchos) infected with low-pathogenic avian influenza (LPAIV) were evaluated at various post-infection time points to determine genetic host factors associated with intraspecific variation in viral shedding. By analysing transcriptome sequencing data (RNA-seq), we found that LPAIV-infected wild-bred mallards do not exhibit differential gene expression compared to uninfected birds, but that gene expression was associated with cloacal viral shedding quantity early in the infection. In both tissues, immune gene expression was higher in high/moderate shedding birds compared to low shedding birds, and significant positive relationships with viral shedding were observed. In the ileum, expression for host genes involved in viral cell entry was lower in low shedders compared to moderate shedders at 1 day post-infection (DPI), and expression for host genes promoting viral replication was higher in high shedders compared to low shedders at 2 DPI. Our findings indicate that viral shedding is a key factor for gene expression differences in LPAIV-infected wild-bred mallards, and the genes identified in this study could be important for understanding the molecular mechanisms driving intraspecific variation in pathogen shedding.

Keywords: influenza; shedding; transcriptomics; virus.


Figures

Fig 1.
Fig 1.. Experimental timeline of sample collection days post-infection (DPI).
Groups are designated by infection status (I = LPAIV-infected, C = uninfected control), DPI sacrificed and (N) quantity of birds in each group. Ileum and bursa were collected upon sacrifice. Cloacal swabs were collected from all living birds designated with the swab icon.
Fig 2.
Fig 2.. Cloacal swab virus titer profiles for LPAIV-infected mallards sacrificed on one (I1), two (I2), and five (I5) days post-infection (DPI).
Shed status of high (H), moderate (M), or low (L) was assigned to individuals by their last virus titer (I1, I2) or the average virus titer across all DPI (I5). Alternative high (Alt.H) and alternative low (Alt.L) shed status groupings were assigned to individuals in I2 based on cumulative virus titers clustered across one and two DPI. Due to low host RNA quality, *individuals were not included in ileum differential gene expression analyses.
Fig 3.
Fig 3.. Expression of FOSB gene and HSPA8 gene and transcript (“Gene/Trans”) in the bursa of uninfected control and LPAIV-infected groups.
Infected groups I1, I2, I5, I15, and I29 correspond to the DPI birds were sacrificed. Differential expression (FDR <0.1, LFC >0.5) was only observed between I2 and I29. HSPA8 had identical gene expression at the transcript (trans) and gene levels.
Fig 4.
Fig 4.. Number of differentially expressed genes (DEG) between shed level groups (low (L), moderate (M), high (H)) of LPAIV-infected mallards in the ileum and bursa on one (I1) and two (I2) DPI.
An additional analysis for I2 divided birds evenly into alternative low and high shedders (Alt.L vs. Alt.H). Arrows reflect the number of DEGs that are up (↑) or down (↓) regulated in the first shed level group listed in each comparison.
Fig 5.
Fig 5.. KEGG pathways of DEGs in the ileum between shed level group comparisons on one day post-infection (I1).
KEGG pathways in darker colors indicate statistically enriched pathways (p < 0.05). Abbreviations: biosynthesis (bs), signaling pathway (sp), glycosaminoglycan (ga), glycosphingolipid (gs), phosphate pathway (pp).
Fig 6.
Fig 6.. KEGG pathways of DEGs in the ileum between shed level group comparisons on two days post-infection (I2).
KEGG pathways in darker colors indicate statistically enriched pathways (p < 0.05). Abbreviations: signaling pathway (sp), protein processing (pp).
Fig 7.
Fig 7.. KEGG pathways of DEGs in the ileum between alternative shed level group comparisons (Alt.L vs. Alt.H) on two days post-infection (I2).
KEGG pathways in darker colors indicate statistically enriched pathways (p < 0.05). Abbreviations: biosynthesis (bs), protein processing (pp), signaling pathway (sp), glycosaminoglycan (ga), glycosphingolipid (gs).
Fig 8.
Fig 8.. Immune genes differentially expressed in the bursa (A) and ileum (B) early in the infection.
Individuals and their shed status group are on the x-axis and gene names are on the y-axis. Expression of genes is designated by color corresponding to the row Z-score (distance from the mean). Colors of gene names corresponds to their immune functional category.
Fig 9.
Fig 9.. Conditional R2 values for candidate genes with significant (p <0.05) linear relationships to cloacal swab virus titers.
Expression of all genes and transcripts shown are positively related to cloacal virus titers. Candidate genes in the bursa were evaluated at the gene and transcript level. Candidate genes in the ileum were only evaluated at the gene level. Colors of gene names corresponds to their immune gene functional category.
Fig 10.
Fig 10.. Intracellular innate immune response to avian influenza.
Antiviral interferon stimulated genes (ISGs, purple) are produced through a cascade of intracellular signaling processes (signaling molecules are in red) known as the interferon pathway. Pattern recognition receptors (dark blue) and toll-like receptors (TLRs) stimulate adaptor molecules (green) for the production of transcription factors (orange). Transcription factors relocate to the nucleus to trigger the production of interferons (IFN, light blue). Interferons transport outside the nucleus to initiate the JAK-STAT signaling pathway responsible for the production of the ISGF3 complex, which relocates to the nucleus to stimulate the production of ISGs. ISGs have various antiviral effects targeting viral replication or directly acting on the interferon pathway. Created with BioRender.com.

Similar articles

Cited by

References

    1. Lloyd-Smith JO, Schreiber SJ, Kopp PE, Getz WM. Superspreading and the effect of individual variation on disease emergence. Nature. 2005;438(7066):355–9. - PMC - PubMed
    1. Vanderwaal KL, Ezenwa VO. Heterogeneity in pathogen transmission: mechanisms and methodology. Funct Ecol. 2016;30:1606–22.
    1. Stein RA. Super-spreaders in infectious diseases. Int J Infect Dis. 2011;15(8):510–3. - PMC - PubMed
    1. Paull SH, Song S, McClure KM, Sackett LC, Kilpatrick AM, Johnson PTJ. From superspreaders to disease hotspots: Linking transmission across hosts and space. Front Ecol Environ. 2012;10(2):75–82. - PMC - PubMed
    1. Galvani AP, May RM. Epidemiology: dimensions of superspreading. Nature. 2005;438(7066):293–5. - PMC - PubMed

Publication types