. 2022 May;21(5):e13593.
doi: 10.1111/acel.13593. Epub 2022 Mar 30.

Reducing Nav1.6 expression attenuates the pathogenesis of Alzheimer's disease by suppressing BACE1 transcription

Affiliations

Reducing Nav1.6 expression attenuates the pathogenesis of Alzheimer's disease by suppressing BACE1 transcription

De-Juan Yuan et al. Aging Cell. 2022 May.

Abstract

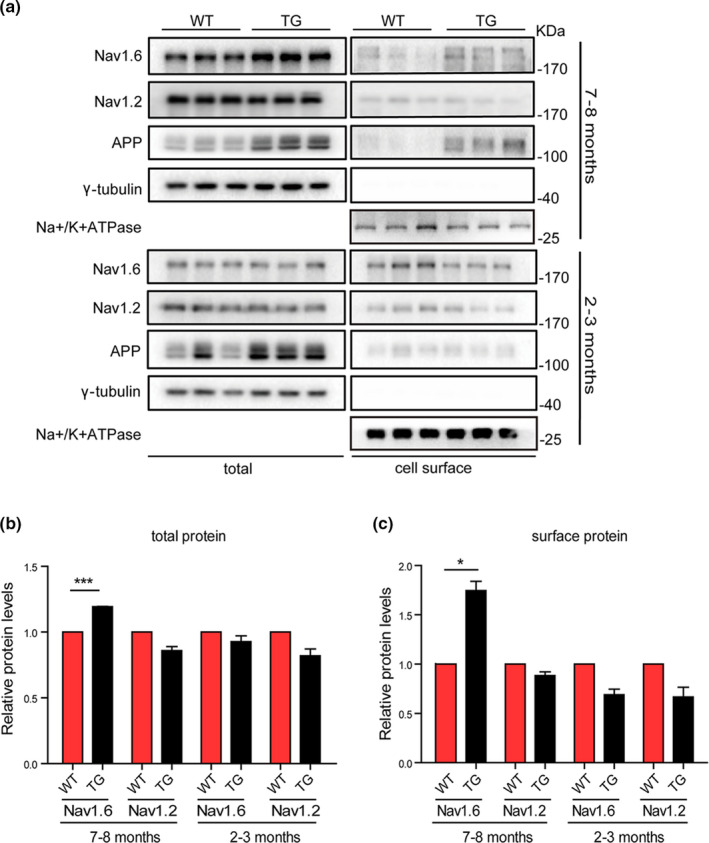
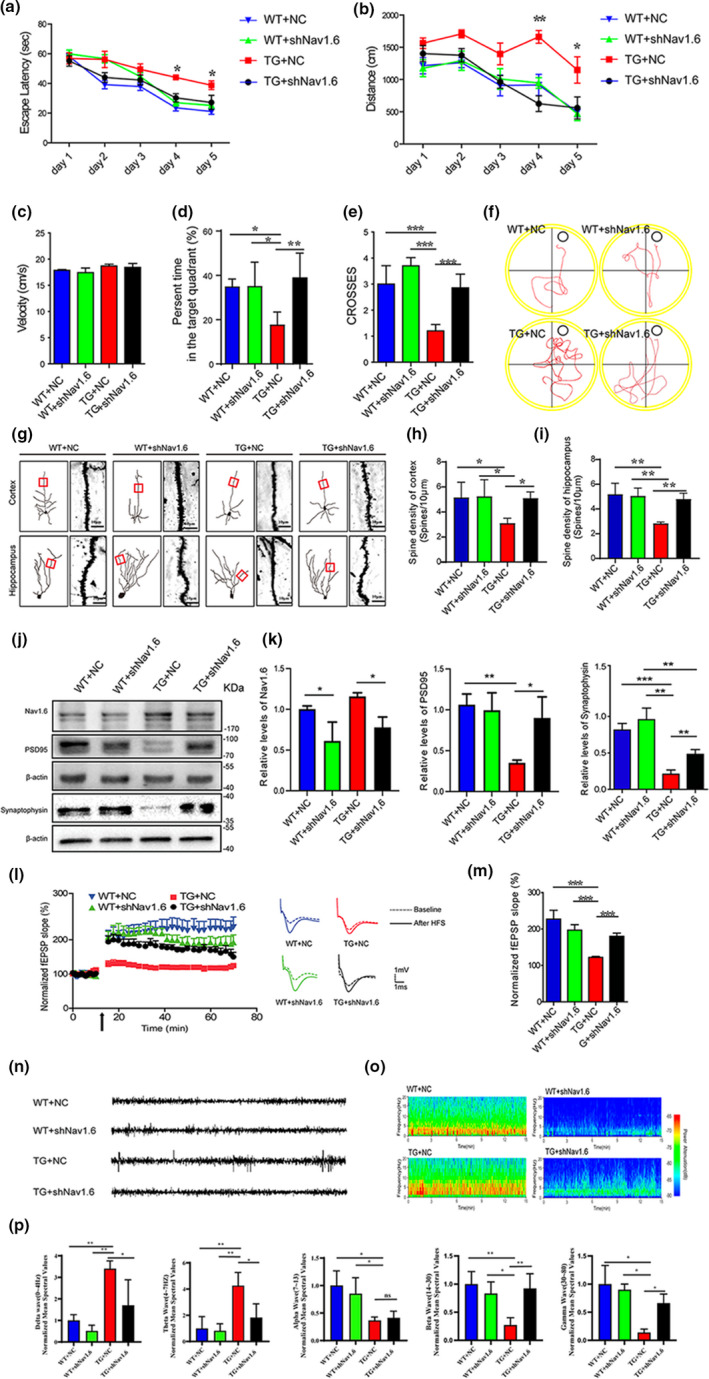
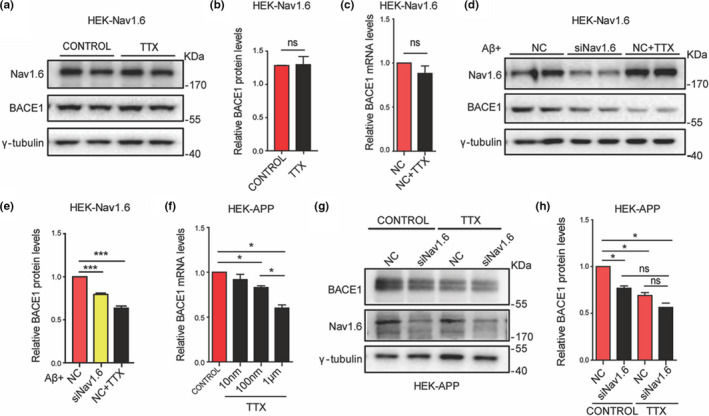
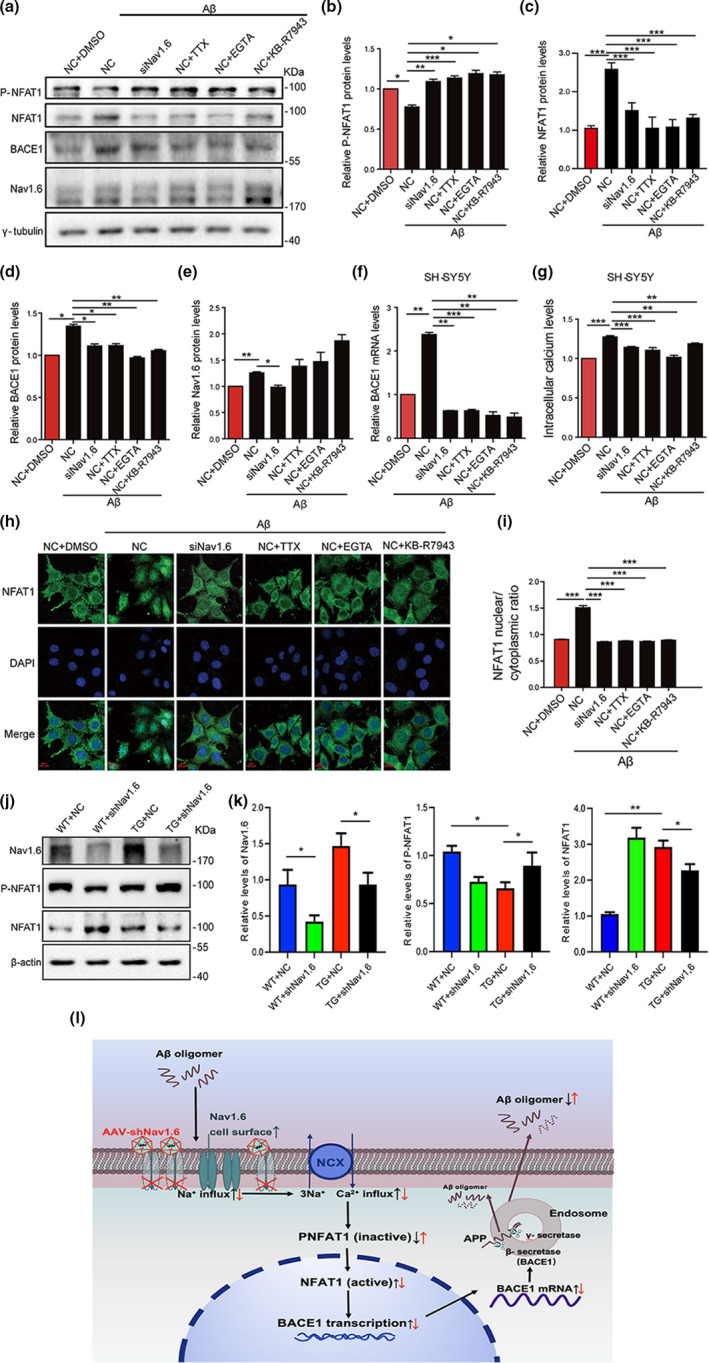
Aberrant increases in neuronal network excitability may contribute to cognitive deficits in Alzheimer's disease (AD). However, the mechanisms underlying hyperexcitability of neurons are not fully understood. Voltage-gated sodium channels (VGSC or Nav), which are involved in the formation of excitable cell's action potential and can directly influence the excitability of neural networks, have been implicated in AD-related abnormal neuronal hyperactivity and higher incidence of spontaneous non-convulsive seizures. Here, we have shown that the reduction of VGSC α-subunit Nav1.6 (by injecting adeno-associated virus (AAV) with short hairpin RNA (shRNA) into the hippocampus) rescues cognitive impairments and attenuates synaptic deficits in APP/PS1 transgenic mice. Concurrently, amyloid plaques in the hippocampus and levels of soluble Aβ are significantly reduced. Interfering with Nav1.6 reduces the transcription level of β-site APP-cleaving enzyme 1 (BACE1), which is Aβ-dependent. In the presence of Aβ oligomers, knockdown of Nav1.6 reduces intracellular calcium overload by suppressing reverse sodium-calcium exchange channel, consequently increasing inactive NFAT1 (the nuclear factor of activated T cells) levels and thus reducing BACE1 transcription. This mechanism leads to a reduction in the levels of Aβ in APP/PS1 transgenic mice, alleviates synaptic loss, improves learning and memory disorders in APP/PS1 mice after downregulating Nav1.6 in the hippocampus. Our study offers a new potential therapeutic strategy to counteract hippocampal hyperexcitability and subsequently rescue cognitive deficits in AD by selective blockade of Nav1.6 overexpression and/or hyperactivity.

Keywords: Alzheimer's disease; BACE1; NFAT1; Nav1.6 sodium channel; amyloid-β; hyperexcitability.


Conflict of interest statement

The authors declare that they have no competing interest in this publication.

Figures

FIGURE 1
FIGURE 1
Expression levels of total and cell surface levels of Nav1.6/Nav1.2/APP in APP/PS1 mice brain. Representative immunoblots (a) and densitometry analysis of the total (b) and cell surface (c) protein expression levels of Nav1.6, Nav1.2. APP levels in the brain of APP/PS1 and WT mice at different ages (2–3 months and 7–8 months). Here, Nav1.6, Nav1.2, APP, and their corresponding γ‐tubulin immunoblots was performed on different parts of the PVDF membrane of different gels. Data were presented as mean ± SEM, *p < 0.05, and ***p < 0.001
FIGURE 2
FIGURE 2
Nav1.6 knockdown attenuates cognitive deficits, ameliorates suppressed synaptic plasticity, and reduces hyperexcitability in APP/PS1 mice. (a–f) Acquisition of spatial learning in the different groups of mice after injecting with siNav1.6 and NC in the MWM with the hidden platform. (a) Escape latencies were measured for the APP/PS1 (TG) and wild‐type (WT) mice treated with either shNav1.6 or NC. (b) The average distance traveled by mice on the different trial days. (c) The swimming speed of the four groups of mice throughout the trial days. (d) The duration of stay in the target quadrant for four groups of mice. (e) The number of times that the four groups of mice swam across the target site after removal of the platform. (f) Representative images of the track visualization path that the mice would swim to find the platform. Data are presented as the mean ± SEM. *p < 0.05; **p < 0.01, ***p < 0.001. n = 7–9 mice/group. (g) Representative micrographs of dendritic spines in the four groups of mice (n = 5 mice/group; scale bar: 10 μm). (h, i) Bar graph showing the number of dendritic spines per unit micrometer (µm) in the cortex and hippocampus of four groups of mice. (j) Representative immunoblots and (k) densitometry analysis of synaptic protein (synaptophysin, PSD95) expression level in the four groups of mice. Here, synaptophysin and its corresponding β‐actin immunoblots were performed on different parts of PVDF membrane of the same gels (n = 8–10 mice/group). (l) Time course data on of the effects of HFS on the fEPSP initial slope. (m) Cumulative data showing the mean fEPSP slope 60 min post‐HFS (n = 5 mice/group, 3–4 slices per mice). (n) Representative traces of EEGs for the four groups of mice showing paroxysmal sinusoidal discharges in TG + NC and Nav1.6 knockdown reduced the paroxysmal sinusoidal discharges in TG + shNav1.6 mice. (o) Representative spectrograms of EEG for the four groups of mice. (p) Normalized differential band spectrum showed significant effects in delta, theta, beta, alpha, and gamma waves in the four groups of mice. Data are presented as the mean ± SEM. **p < 0.01; ***p < 0.001
FIGURE 3
FIGURE 3
Nav1.6 knockdown inhibits the accumulation of Aβ and the cleavage of APP by β‐secretase by suppressing transcription of BACE1. (a) Coronal sections of the hippocampus were immunohistochemically stained with an antibody against Aβ. (b) The size and number of Aβ plaques were quantified in APP/PS1 treated with siNav1.6 and NC (n = 5 mice/group, 3 slices per mice). (c) Protein levels of Aβ42 using ELISA in the four groups of mice (WT and APP/PS1 treated with siNav1.6 or NC); n = 5 mice/group. Representative immunoblots (d) and densitometry analysis (e) of Nav1.6, BACE1, and APP protein expression in the brain of mice (WT and APP/PS1 treated with siNav1.6 or NC), n = 5 mice/group. Representative immunoblots (f) and densitometry analysis (g) of Nav1.6, α‐CTF, and β‐CTF protein expression in mice brain (WT and APP/PS1 treated with siNav1.6 or NC), n = 5 mice/group. Representative immunoblots (h) and densitometry analysis (i) of Nav1.6, β‐CTF, α‐CTF, and APP in HEK‐APP cells after knockdown with siNav1.6. Here, Nav1.6, β‐CTF, α‐CTF, APP, and their corresponding γ‐tubulin immunoblots were performed on different parts of the PVDF membrane of different gels. γ‐tubulin was used as a loading control (n = 4–5 groups). Data are presented as mean ± SEM. *p < 0.05, and **p < 0.01. Representative immunoblot (k) and densitometry analysis (j) of BACE1, APP, and Nav1.6 in the HEK‐APP cell line after treatment with NC and siNav1.6. Relative mRNA expression level of Nav1.6, BACE1, and APP in the HEK‐APP cell line (l) and mouse primary neurons (m) after treatment with NC and siNav1.6/shNav1.6, respectively. The relative expression was normalized to β‐actin. (n) Luminescence density of BACE1 in HEK‐APP cell line using the fluorescein reporter gene detection system after treatment with NC and siNav1.6 (3–5 biological replicates). Here, BACE1 (in the animal model) was normalized to β‐actin, BACE1, APP, and Nav1.6 (in HEK‐APP cell line) were normalized to γ‐tubulin in the Western blots, whereas Nav1.6, BACE1, and APP were normalized to actin in the RT‐PCR. Data are presented as mean ± SEM. *p < 0.05, ***p < 0.001
FIGURE 4
FIGURE 4
Nav1.6 regulates BACE1 expression dependent on its channel property. Representative immunoblots (a) and densitometry analysis (b) of BACE1 and Nav1.6 expression levels in the HEK cell line overexpressing Nav1.6 and treated with TTX (1 μM). (c) Relative mRNA expression level of BACE1 in the HEK cell line overexpressing Nav1.6 after treatment with TTX (1 μM). Representative immunoblots (d) and densitometry analysis (e) of BACE1 and Nav1.6 expression levels in the HEK cell line overexpressing Nav1.6 in the presence of induced Aβ oligomers. (f) Relative mRNA expression level of BACE1 in the HEK‐APP cell line after treatment with different concentrations of TTX. Representative immunoblots (g) and densitometry analysis (h) of BACE1 and Nav1.6 expression levels in the HEK‐APP cell line transfected with NC or siNav1.6 plasmids with or without TTX (1 μM). Here, BACE1, APP, and Nav1.6 were normalized to γ‐tubulin in the Western blot, whereas BACE1 was normalized to β‐actin in the RT‐PCR. Data are presented as mean ± SEM (n = 5 biological replicates). *p < 0.05, ***p < 0.001
FIGURE 5
FIGURE 5
Aβ oligomer‐induced expression levels of BACE1 and inactive NFAT1 by interference with Nav1.6, TTX, EGTA, and KB‐R7943. Representative immunoblots (a) and densitometry analysis of P‐NFAT1 (inactive) (b), NFAT1 (active) (c), BACE1 (d), and Nav1.6 (e) expression levels in SH‐SY5Y cells after treatment with siNav1.6, 1 μM TTX, 0.5 mM EGTA, and 5 μM KB‐R7943 under induced Aβ oligomers condition. (f) Relative mRNA expression of RT‐qPCR showing the expression level of BACE1 in the SH‐SY5Y cells after treatment with siNav1.6, 1 μM TTX, 0.5 mM EGTA, and 5 μM KB‐R7943 under induced Aβ oligomers condition. (g) Intracellular calcium levels in SH‐SY5Y cell after treatment with NC, siNav1.6, 1 μM TTX, 0.5 mM EGTA, and 5 μM KB‐R7943 under induced Aβ oligomers condition. (h) SH‐SY5Y cells were either treated with 1 μM TTX, 0.5 mM EGTA, and 5 μM KB‐R7943 or transfected with Nav1.6 siRNA in the presence of Aβ oligomers and immunostained for NFAT1 and DAPI. Scale bar: 100 μm. (i) The ratio of nuclear NFAT1 to the cytoplasmic NFAT1. Here, P‐NFAT1, BACE1, and Nav1.6 were normalized to γ‐tubulin in the Western blot, whereas BACE1 was normalized to ACTIN in the RT‐PCR. Data are presented as mean ± SEM. *p < 0.05, **p < 0.01, **p < 0.001. Representative immunoblots (j) and densitometry analysis (k) of Nav1.6, P‐NFAT1, and NFAT1 protein expression in the brain of mice (WT and APP/PS1 treated with siNav1.6 or NC), n = 5 mice/group. (l) The proposed flowchart cycle depicting interference of Nav1.6’s effect on the progression of AD. Interference of Nav1.6 can reduce the Aβ oligomers‐dependent transcription of BACE1, which then relieves intracellular calcium overload by inhibiting sodium‐calcium reverse exchange channel and leads to an increase in non‐activated NFAT1 expression levels. The reduced transcription of BACE1, in turn, decreases Aβ production and slows the progression of AD

References

    1. Abdelsayed, M. , & Sokolov, S. (2013). Voltage‐gated sodium channels: Pharmaceutical targets via anticonvulsants to treat epileptic syndromes. Channels, 7(3), 146–152. 10.4161/chan.24380 - DOI - PMC - PubMed
    1. Alrashdi, B. , Dawod, B. , Schampel, A. , Tacke, S. , Kuerten, S. , Marshall, J. S. , & Côté, P. D. (2019). Nav1.6 promotes inflammation and neuronal degeneration in a mouse model of multiple sclerosis. Journal of Neuroinflammation, 16(1), 215. 10.1186/s12974-019-1622-1 - DOI - PMC - PubMed
    1. Andrews‐Zwilling, Y. , Bien‐Ly, N. , Xu, Q. , Li, G. , Bernardo, A. , Yoon, S. Y. , Zwilling, D. , Yan, T. X. , Chen, L. , & Huang, Y. (2010). Apolipoprotein E4 causes age‐ and tau‐dependent impairment of GABAergic interneurons, leading to learning and memory deficits in mice. Journal of Neuroscience, 30(41), 13707–13717. 10.1523/jneurosci.4040-10.2010 - DOI - PMC - PubMed
    1. Bakker, A. , Krauss, G. L. , Albert, M. S. , Speck, C. L. , Jones, L. R. , Stark, C. E. , Yassa, M. A. , Bassett, S. S. , Shelton, A. L. , & Gallagher, M. (2012). Reduction of hippocampal hyperactivity improves cognition in amnestic mild cognitive impairment. Neuron, 74(3), 467–474. 10.1016/j.neuron.2012.03.023 - DOI - PMC - PubMed
    1. Bender, A. C. , Luikart, B. W. , & Lenck‐Santini, P. P. (2016). Cognitive deficits associated with Nav1.1 alterations: Involvement of neuronal firing dynamics and oscillations. PLoS One, 11(3), e0151538. 10.1371/journal.pone.0151538 - DOI - PMC - PubMed

MeSH terms