. 2022 May 5;109(5):900-908.
doi: 10.1016/j.ajhg.2022.03.008. Epub 2022 Mar 29.

Polygenic risk for prostate cancer: Decreasing relative risk with age but little impact on absolute risk

Affiliations

Polygenic risk for prostate cancer: Decreasing relative risk with age but little impact on absolute risk

Daniel J Schaid et al. Am J Hum Genet. .

Abstract

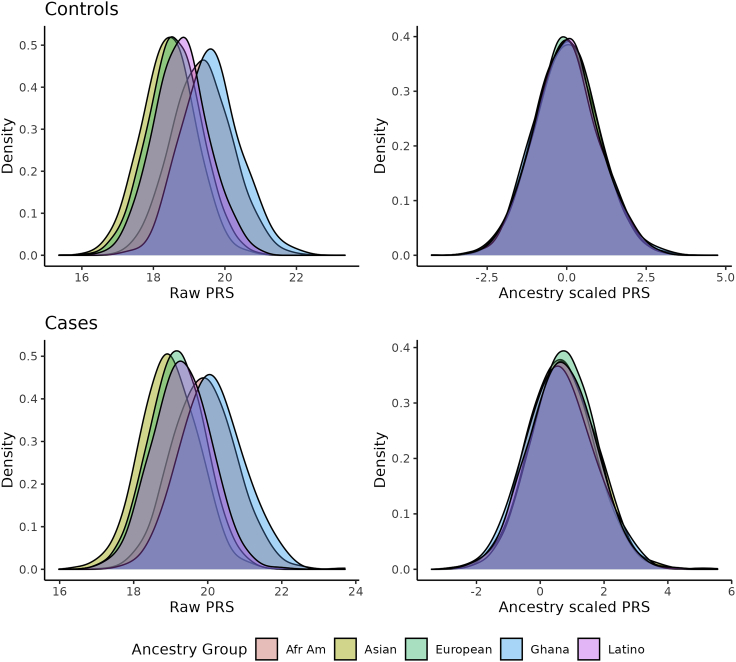
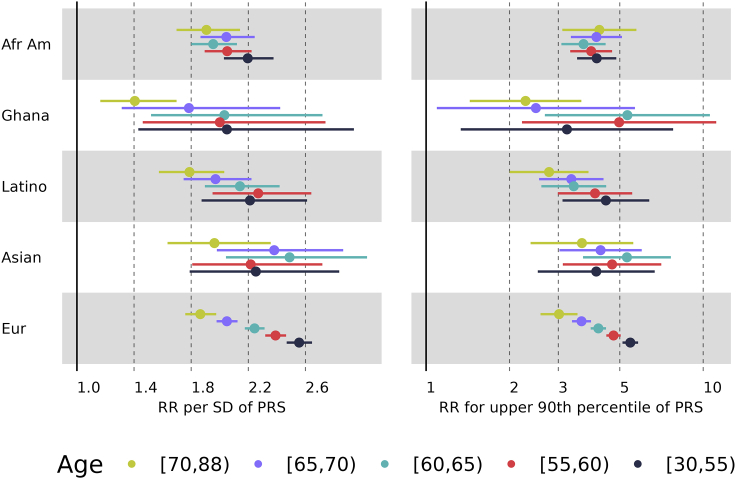
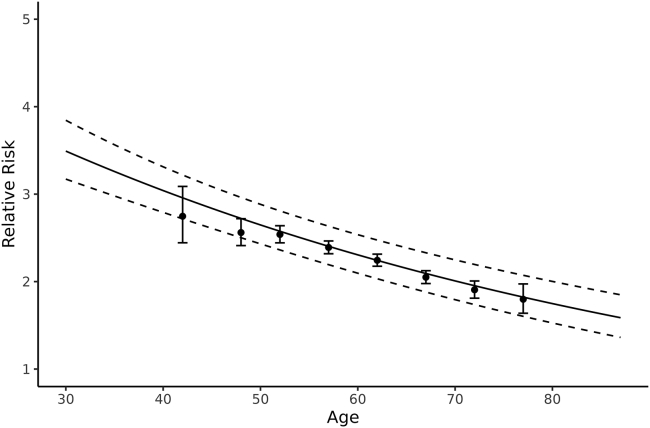
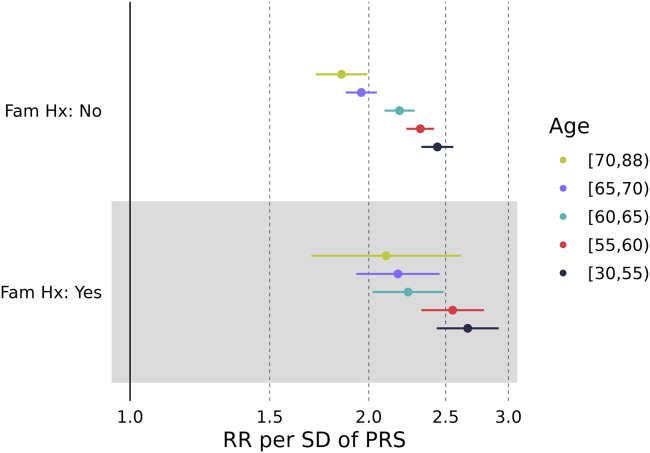
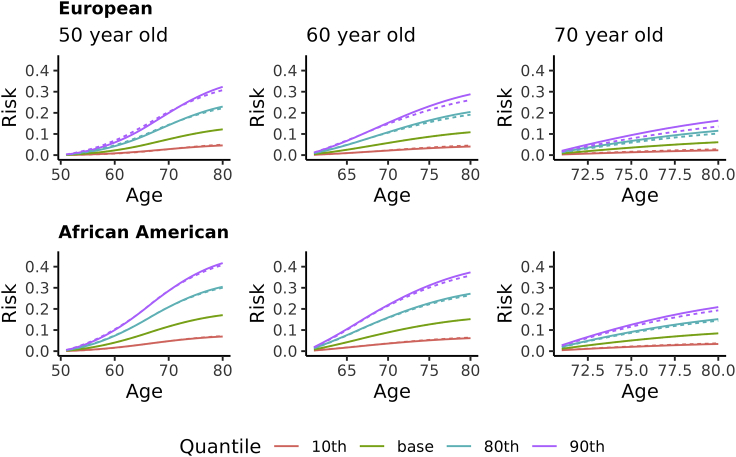
Polygenic risk scores (PRSs) for a variety of diseases have recently been shown to have relative risks that depend on age, and genetic relative risks decrease with increasing age. A refined understanding of the age dependency of PRSs for a disease is important for personalized risk predictions and risk stratification. To further evaluate how the PRS relative risk for prostate cancer depends on age, we refined analyses for a validated PRS for prostate cancer by using 64,274 prostate cancer cases and 46,432 controls of diverse ancestry (82.8% European, 9.8% African American, 3.8% Latino, 2.8% Asian, and 0.8% Ghanaian). Our strategy applied a novel weighted proportional hazards model to case-control data to fully utilize age to refine how the relative risk decreased with age. We found significantly greater relative risks for younger men (age 30-55 years) compared with older men (70-88 years) for both relative risk per standard deviation of the PRS and dichotomized according to the upper 90th percentile of the PRS distribution. For the largest European ancestral group that could provide reliable resolution, the log-relative risk decreased approximately linearly from age 50 to age 75. Despite strong evidence of age-dependent genetic relative risk, our results suggest that absolute risk predictions differed little from predictions that assumed a constant relative risk over ages, from short-term to long-term predictions, simplifying implementation of risk discussions into clinical practice.

Keywords: absolute risk prediction; genetic relative risk; weighted Cox regression.


Conflict of interest statement

Declaration of interests The authors declare no competing interests.

Figures

Figure 1
Figure 1
Distribution of PRSs by ancestry and disease status before and after adjustment for ancestry by centering and scaling according to mean and standard deviation within controls of each ancestry
Figure 2
Figure 2
Relative risk per PRS SD (left panel) and for upper 90th percentile cutoff of PRS (right panel) according to ancestry The bars represent 95% confidence intervals.
Figure 3
Figure 3
Relative risk per PRS SD (left panel) and for upper 90th percentile cutoff of PRS (right panel) for age groups according to ancestry The bars represent 95% confidence intervals.
Figure 4
Figure 4
Piece-wise relative risk models and log-relative risk modeled as linear with age for European ancestry The solid line is the model assuming log-relative risk depends linearly on age and dashed lines are the 95% confidence interval over ages. The estimated dependence on age was 1.2504-0.0138(age-30). The piece-wise relative risks are represented as “” and their 95% confidence intervals represented as whiskers. The piece-wise results are positioned on the x axis at the median value of age within each age group.
Figure 5
Figure 5
Relative risk per PRS SD according to age groups and family history for European ancestry The bars represent 95% confidence intervals.
Figure 6
Figure 6
Future absolute risk of prostate cancer for European ancestry (left three panels) and African American ancestry (right three panels) conditional on current age and quantile of PRS The solid lines assume a relative risk constant over ages, and the broken lines assume piece-wise relative risks to account for relative risks changing over ages. The quantiles (10, 80, 90) are for a standard normal distribution as expected for a standardized PRS in a population. The baseline represents the absolute risk assuming the PRS is unknown.

References

    1. Li S., Hopper J.L. Age dependency of the polygenic risk score for colorectal cancer. Am. J. Hum. Genet. 2021;108:525–526. - PMC - PubMed
    1. Lambert S.A., Gil L., Jupp S., Ritchie S.C., Xu Y., Buniello A., McMahon A., Abraham G., Chapman M., Parkinson H., et al. The Polygenic Score Catalog as an open database for reproducibility and systematic evaluation. Nat. Genet. 2021;53:420–425. - PMC - PubMed
    1. Choi S.W., O’Reilly P.F. PRSice-2: Polygenic Risk Score software for biobank-scale data. Gigascience. 2019;8:giz082. - PMC - PubMed
    1. Vilhjálmsson B.J., Yang J., Finucane H.K., Gusev A., Lindström S., Ripke S., Genovese G., Loh P.R., Bhatia G., Do R., et al. Modeling Linkage Disequilibrium Increases Accuracy of Polygenic Risk Scores. Am. J. Hum. Genet. 2015;97:576–592. - PMC - PubMed
    1. Privé F., Arbel J., Vilhjálmsson B.J. LDpred2: better, faster, stronger. Bioinformatics. 2020;36:5424–5431. - PMC - PubMed

Publication types