. 2022 Mar 29;38(13):110600.
doi: 10.1016/j.celrep.2022.110600.

Early stress-induced impaired microglial pruning of excitatory synapses on immature CRH-expressing neurons provokes aberrant adult stress responses

Affiliations

Early stress-induced impaired microglial pruning of excitatory synapses on immature CRH-expressing neurons provokes aberrant adult stress responses

Jessica L Bolton et al. Cell Rep. .

Abstract

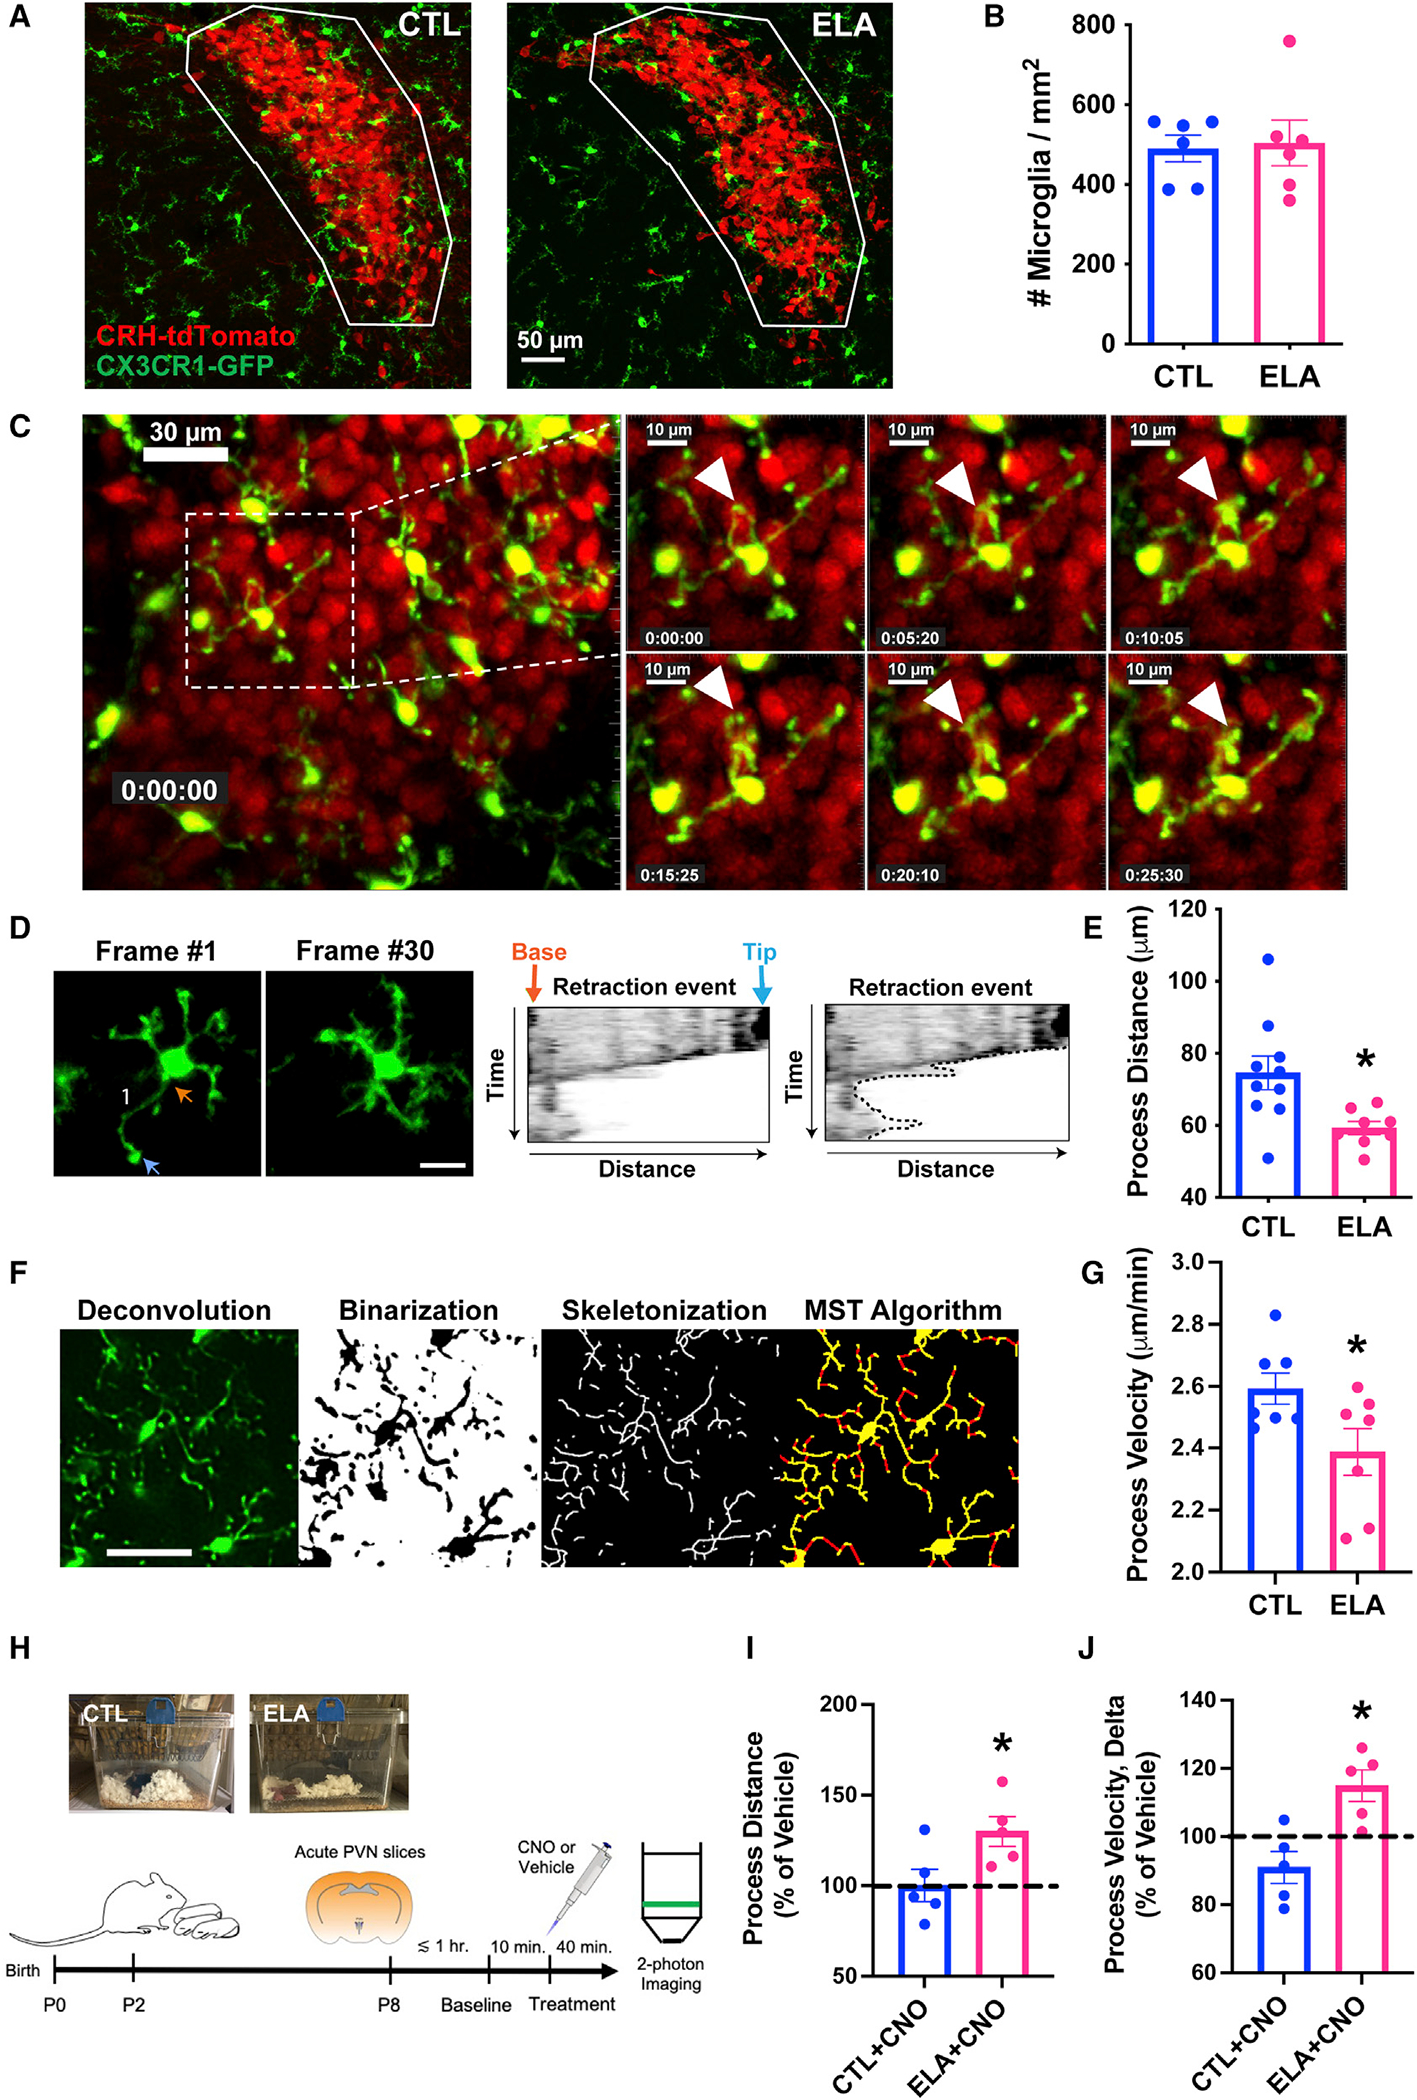
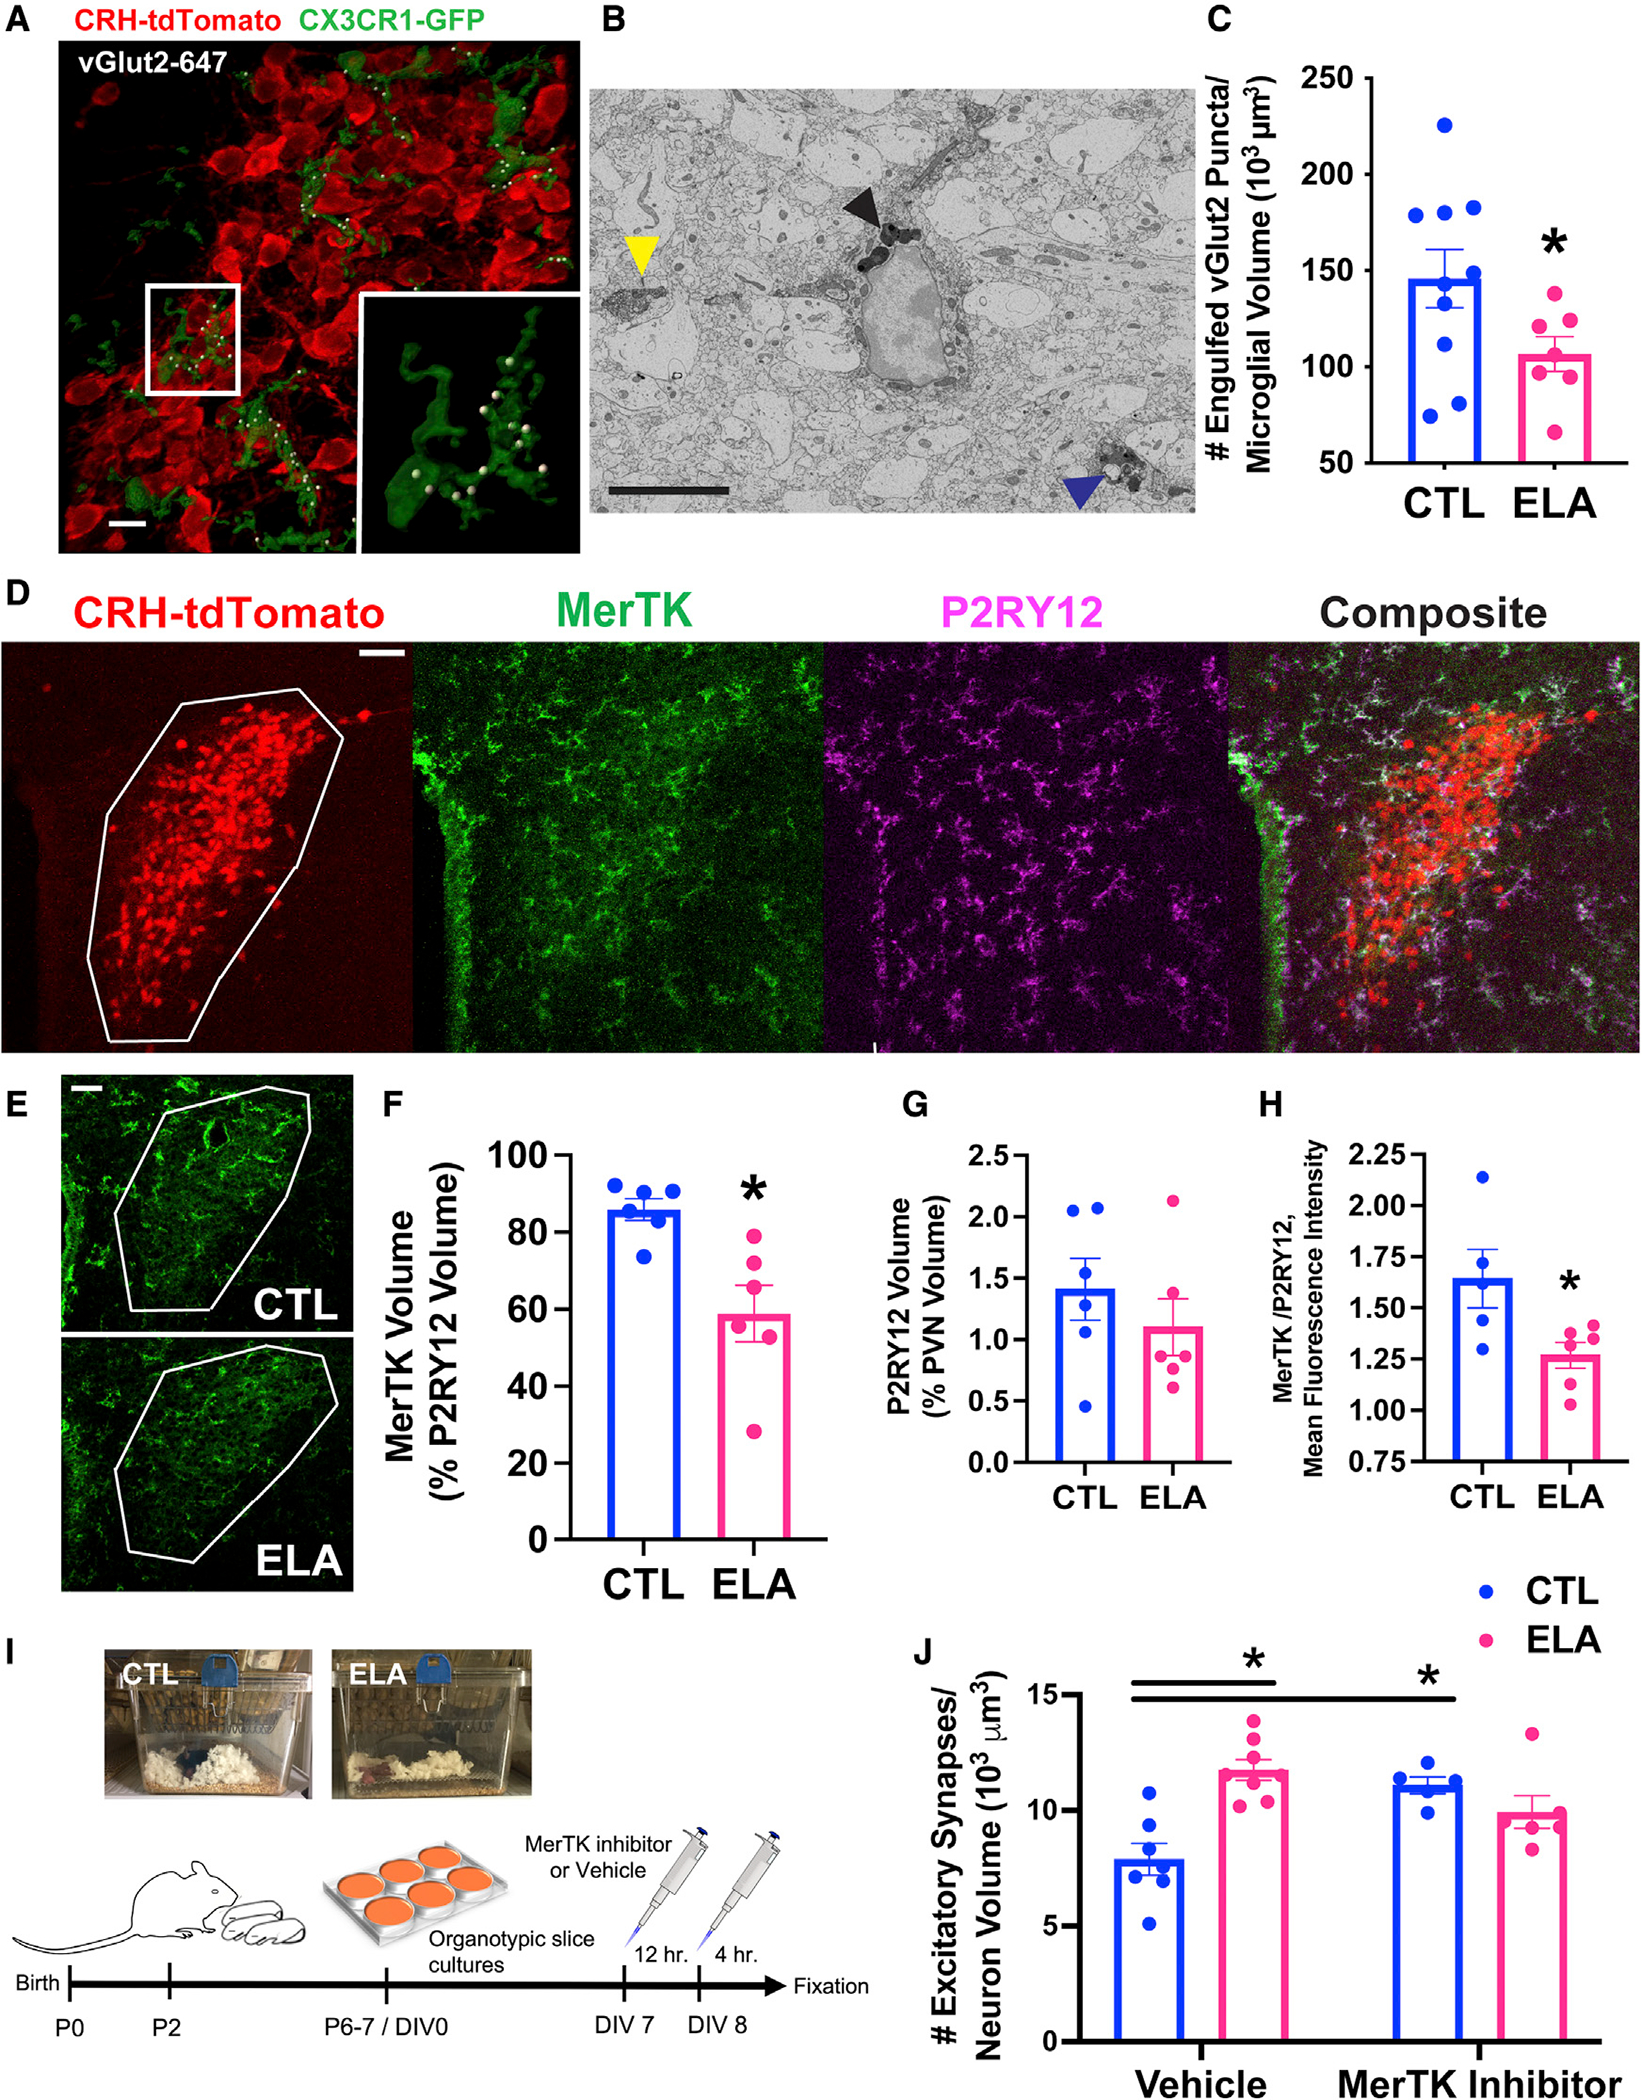
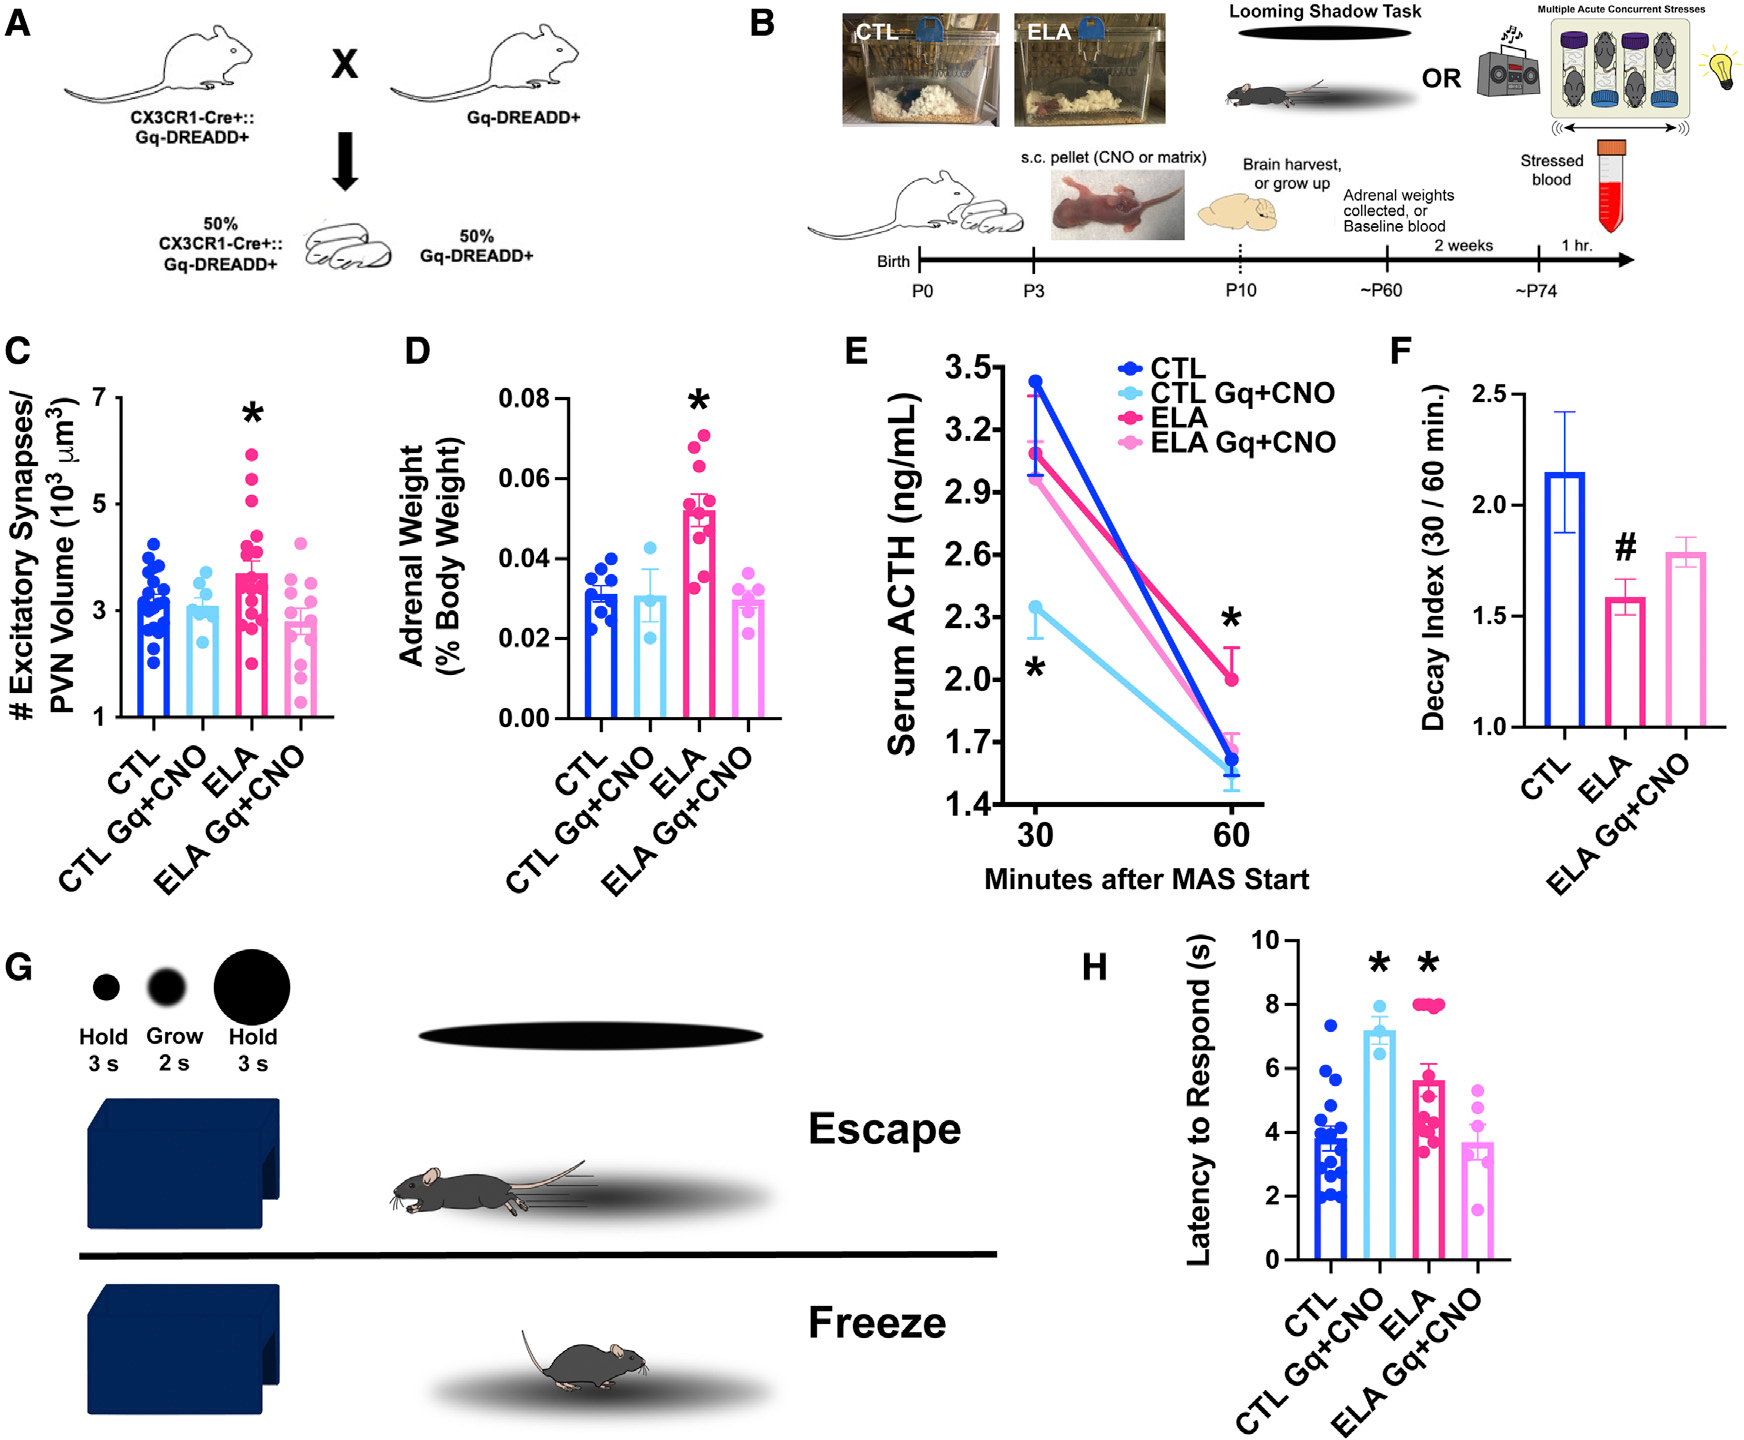
Several mental illnesses, characterized by aberrant stress reactivity, often arise after early-life adversity (ELA). However, it is unclear how ELA affects stress-related brain circuit maturation, provoking these enduring vulnerabilities. We find that ELA increases functional excitatory synapses onto stress-sensitive hypothalamic corticotropin-releasing hormone (CRH)-expressing neurons, resulting from disrupted developmental synapse pruning by adjacent microglia. Microglial process dynamics and synaptic element engulfment were attenuated in ELA mice, associated with deficient signaling of the microglial phagocytic receptor MerTK. Accordingly, selective chronic chemogenetic activation of ELA microglia increased microglial process dynamics and reduced excitatory synapse density to control levels. Notably, selective early-life activation of ELA microglia normalized adult acute and chronic stress responses, including stress-induced hormone secretion and behavioral threat responses, as well as chronic adrenal hypertrophy of ELA mice. Thus, microglial actions during development are powerful contributors to mechanisms by which ELA sculpts the connectivity of stress-regulating neurons, promoting vulnerability to stress and stress-related mental illnesses.

Keywords: 2-photon imaging; CP: Neuroscience; MerTK; chemogenetics; corticotropin-releasing factor; microglia; process dynamics; stress; synaptic pruning.


Conflict of interest statement

Declaration of interests The authors declare no competing interests.

Figures

Figure 1.
Figure 1.. Early-life adversity (ELA) augments the number and function of excitatory synapses on CRH-expressing hypothalamic neurons
(A) Top: A representative confocal composite image of excitatory synaptic puncta and CRH-tdTomato+ neurons in mediodorsal parvocellular (mpd) paraventricular hypothalamic nucleus (PVN). Inset: puncta colocalizing vGlut2 (magenta) and PSD95 (green) on a CRH-tdTomato+ neuron (red). These puncta satisfied the criteria for synapses (Imaris software). Scale bar, 10 μm. Bottom: Representative wide-field composite image of the overall PVN source of the mpd image (yellow, ROI); DAPI (blue), CRH-tdTomato+ cells (red), followed by 3D reconstruction of the selected CRH-tdTomato+ neuron (white inset), high-resolution confocal images masking PSD95 and vGlut2 channels on the 3D volume, their overlap, and remaining puncta that lie within the colocalization threshold. White arrowhead marks a synapse through all of the insets. Scale, 50 μm. (B) ELA increases the number of excitatory synapses onto PVN CRH+ neurons at postnatal day (P)10 in male mice (t12.44 = 2.95, p = 0.01; Welch’s t test; see Figure S5A for female data). The same result is obtained by Imaris or manual counts using FIJI (r = 0.90, p < 0.0001; Pearson correlation). Synapse density in the non-CRH-dense region below the mpd (anterior hypothalamic nucleus) did not distinguish ELA and control mice (p > 0.2; inset). (C) The ELA-induced increase in excitatory synapse number endured on P24–25 (t8.96 = 3.69, p = 0.005; Welch’s t test; see Figure S5B for female data). (D) ELA functionally changes excitatory synapses of presumed CRH-expressing neurons: Traces are epochs (10 s) of whole-cell voltage-clamp recordings of spontaneous inhibitory synaptic currents (sIPSCs, top) and spontaneous excitatory synaptic currents (sEPSCs, bottom) from mpd PVN neurons derived from CTL (left) and ELA (right) mice (also see Table S1). A subsection (shaded area; 1 s) of the recorded epoch is displayed on an expanded timescale. Scale bars, sIPSC: y = 50 pA, sEPSC: y = 10 pA, x = 2 s, and 200 ms for top and bottom traces, respectively. (E) ELA increases the frequency of sEPSCs in mpd PVN neurons of P18–26 male and female mice (t14 = 2.28, p = 0.04; unpaired t test). (F) ELA does not alter sIPSCs frequency in the same mice (p > 0.8). Data are means ± SEMs; *p < 0.05.
Figure 2.
Figure 2.. Process dynamics of microglia abutting CRH-expressing neurons in PVN are impaired by ELA
(A) Representative confocal images of microglia (green; CX3CR1-GFP) and CRH+ neurons (red; CRH-tdTomato) in PVN (white ROI) of P10 CTL (left) and ELA (right) male mice. Scale bar, 50 μm. (B) ELA does not alter the density of microglia (number per ROI area, mm2) in the PVN. (C) Still frames in ~5-min increments from a representative 2-photon video of microglia interacting with CRH+ neurons in the mpd PVN of a P8 male mouse. White arrowhead points to a microglial process, highlighting that its position shifts across frames. Scale bar, 30 μm (left image); 10 μm in insets. (D) Example of a kymograph analysis of a microglia from a 2-photon imaging video, tracking retraction of a microglial process over time. In frame 1, the orange arrow points to the base of the microglial process; the blue arrow points to the process tip. The dotted line around the edges of the right kymograph represents the total distance traveled by process tip. Scale bar, 10 μm. (E) ELA significantly attenuates microglial process dynamics, measured by the total distance traveled by process tips over 30 min (t16 = 2.79, p = 0.01; unpaired t test). (F) Sequential steps for processing microglial images in real time using an automated Python-based algorithm tracking concurrently movements of all of the process tips from multiple microglia. From left to right: deconvolution, binarization, skeletonization, and minimum spanning tree (MST) algorithm to fill any gaps (red) in skeletons (yellow). Scale bar, 30 μm. (G) ELA reduces microglial process velocity as measured by this novel technique (t12 = 2.26, p = 0.04; unpaired t test). (H) Schematic of the chemogenetic activation: Litters of CX3CR1-Cre+:Gq-DREADD+ mice are randomly assigned to CTL or ELA conditions on P2. On P8, acute hypothalamic slices are prepared, recover for ~1 h, and used for 2-photon live imaging in superfusion chambers. (I) Slices are imaged for a 10-min baseline period, then are exposed to CNO (to activate microglia-specific Gq-DREADDs) or vehicle for 40 min. The addition of CNO to microglia expressing excitatory Gq-DREADDs significantly augments the distance traveled by process tips in ELA slices compared to vehicle treatment (t4 = 3.63, p = 0.02; 1-sample t test) and CTL slices (t8 = 2.45, p = 0.04; unpaired t test; see Figure S2H for raw data). Slices were sampled at 30 min after drug onset. (J) In slices from ELA mice, CNO significantly increases microglial process velocity measured from the onset to end of the incubation period, compared to vehicle (t4 = 3.23, p = 0.03; 1-sample t test) and to CTL slices (t8 = 3.64, p = 0.007; unpaired t test). Means ± SEMs; *p < 0.05.
Figure 3.
Figure 3.. Microglial mechanisms for augmented excitatory synapses on CRH+ cells in ELA mice
(A) Representative confocal image of microglia (green; CX3CR1-GFP) abutting CRH+ neurons (red; CRH-tdTomato), engulfing vGlut2+ excitatory presynaptic puncta (white; vGlut2 puncta identified as inside microglia by Imaris 3D reconstruction) in mpd PVN of a P8 male mouse. Scale bar, 10 μm (raw images in Figures S2C–S2E). (B) Representative electron micrograph of a microglia labeled with ionized calcium binding adaptor molecule (Iba)1 and 3′,3-diaminobenzidine (DAB; electron-dense soma and processes) in P8 PVN. The yellow arrowhead points to the postsynaptic density of an excitatory synapse directly abutting a labeled microglial process. The black arrowhead indicates multiple lysosomes (electron dense) in microglial soma; these degrade engulfed material. The blue arrowhead points to an engulfed endosome of synaptic elements, including a putative postsynaptic density, surrounded by lysosomes in a microglia process. Scale bar, 5 μm. (C) ELA reduces the number of vGlut2+ synaptic puncta engulfed by microglia abutting CRH+ neurons in the P8 mpd PVN of male mice (t13.87 = 2.22, p = 0.04; Welch’s t test; see Figure S5C for female data), as quantified in confocal 3D reconstructions. (D) Representative confocal image of the microglial phagocytic receptor Mer tyrosine kinase (MerTK) expression. MerTK is primarily in microglia in the P8 PVN (white ROI; see also Figure S3D). Red = CRH-tdTomato+ neurons; green = MerTK immunoreactivity (IR); magenta = P2RY12 IR (microglia); white = overlap of green and magenta in composite image. Scale bar, 50 μm. (E) Representative confocal images of MerTK IR in CTL (top) compared to ELA (bottom) P8 PVN (white ROI). Scale bar, 50 μm. (F) MerTK volume per unit volume of P2RY12+ microglia (measured using Imaris) was lower in P8 ELA male PVN than in controls (t6.46 = 3.44, p = 0.01; Welch’s t test). (G) Notably, P2RY12 volume and its percentage of PVN volume did not differ in ELA compared to control mice. (H) The ratio of MerTK mean fluorescence intensity (MFI; measured using Imaris) to P2RY12 MFI was significantly reduced in ELA mice PVN (t9 = 2.54, p = 0.03; unpaired t test). (I) Schematic of the MerTK inhibition experiment: Litters of CRH-tdTomato+ mice were randomly assigned to CTL or ELA conditions on P2. On P6–7, organotypic hypothalamic slice cultures were prepared and maintained for 7 d in vitro (DIV). On DIV7, cultures were treated with 20 nM of a small-molecule MerTK inhibitor (UNC2025: ~40-fold greater selectivity for MerTK over the Axl and Tyro3 TAM receptors [McDaniel et al., 2018; Zhang et al., 2014a]) or vehicle. Twelve hours later, the medium was refreshed with new drug, and the cultures were fixed 4 h later (Figure S3E). (J) MerTK inhibition increased the number of excitatory synapses on CRH+ neurons in PVN cultures from control mice but not in ELA mice (significant interaction of ELA × drug, F1,22 = 17.89, p = 0.0003; 2-way ANOVA; p < 0.05; post hoc Tukey’s test). Means ± SEMs; *p < 0.05.
Figure 4.
Figure 4.. Enduring functional significance of ELA-related microglial deficits
(A) Breeding strategy for the chemogenetic studies: CX3CR1-Cre+:Gq-DREADD+ mice were crossed with Gq-DREADD+ mice to generate ~50% pups expressing Gq-DREADDs exclusively in microglia (see Figures S4A and S4B). (B) Schematic of in vivo chemogenetic activation experiment: Male mice of CX3CR1-Cre+:Gq-DREADD+ litters, randomly assigned to CTL or ELA conditions (P3) received small, sustained-release CNO- or placebo-containing pellets subcutaneously (s.c.). A cohort was perfused on P10 for the quantification of excitatory synapses on mpd-PVN cells. A second cohort were behaviorally tested as adults in the looming-shadow threat (Daviu et al., 2020) and provided adrenal gland weights, a measure of lifetime stress responses. A third cohort provided baseline and stress-induced ACTH and corticosterone (CORT) levels. After an adult acute, complex stress experience (Hokenson et al., 2020), blood was collected at 30 and 60 min from stress onset. (C) Chronic chemogenetic microglial activation during P3–10 in microglia-specific Gq-DREADDs in ELA male mice decreased excitatory synapse numbers on mpd PVN neurons to control levels; this was not observed in mice lacking the microglial expression of Gq-DREADDs or in placebo-receiving mice (F2,23.8 = 3.76, p = 0.04; Welch’s 1-way ANOVA; p < 0.05, Dunnett’s T3 multiple comparisons test; also see Figure S6). As CNO alone did not alter the synapse number in microglial Gq-DREADD-expressing CTL mice (p > 0.6), CTL groups were combined for analysis. (D) Adrenal weights of ELA-adult male mice were higher than those of control mice, indicative of lifelong exposure to augmented stress-hormone release. Chemogenetic microglial activation during the ELA epoch prevented adrenal weight increases (F3,24 = 11.11, p < 0.0001; 1-way ANOVA; p < 0.05, Holm-Sidak’s multiple comparisons test). (E) At 30 min from onset, stress elicited a robust elevation of ACTH in both CTL and ELA male mice. Chemogenetic activation of microglia in CTL mice blunted this response (F3,20.6 = 3.19, p = 0.04; Welch’s 1-way ANOVA; p < 0.05, Dunnett’s T3 test). At 60 min from stress onset, ACTH levels dropped to 50% of peak values in CTL but not ELA mice (F2,53 = 3.45, p = 0.04; 1-way ANOVA; p < 0.05, Holm-Sidak’s test). Chemogenetic microglial activation in ELA mice ameliorated the prolonged surge of ACTH, which returned to control levels by 60 min (p > 0.8, Holm-Sidak’s test). (F) The ACTH decay index (30 min/60 min levels) differed in ELA mice (F3,21.5 = 3.19, p = 0.04; Welch’s 1-way ANOVA; p = 0.06, Dunnett’s T3 test), and was partially restored in chemogenetically activated ELA mice (p > 0.2 compared to CTL, same post hoc test). The data show an aberrant prolongation of the hormonal stress response in ELA mice, and the restoration of normal “shutoff” mechanisms by early-life microglial activation (CTL Gq+ CNO mice were not included in the decay index analysis because their stress response was already blunted). (G) Schematic of the looming-shadow threat task: mice experienced 5 looming-shadow stimulus trials, and their response was scored as escape (top), freezing (bottom), or none. (H) ELA significantly prolonged latencies of responses to the threat (F3,35 = 6.25, p = 0.002; 1-way ANOVA; p < 0.05, Holm-Sidak’s test). Chemogenetic activation of microglia prevented ELA-induced aberrant threat responses (p > 0.9, Holm-Sidak’s test). Chemogenetic activation of microglia in CTL mice led to delayed responses to the threat, suggesting that normal responses require graded microglia-related synapse pruning (p < 0.05). Means ± SEMs; *p < 0.05.

References

    1. Abiega O, Beccari S, Diaz-Aparicio I, Nadjar A, Layé S, Leyrolle Q, Gómez-Nicola D, Domercq M, Pérez-Samartín A, Sánchez-Zafra V, et al. (2016). Neuronal hyperactivity disturbs ATP microgradients, impairs microglial motility, and reduces phagocytic receptor expression triggering apoptosis/microglial phagocytosis uncoupling. PLoS Biol. 14, 1–48. - PMC - PubMed
    1. Armario A (2006). The Hypothalamic-Pituitary-Adrenal Axis: What can it Tell us About Stressors? CNS & Neurological Disorders - Drug Targets 5, 485–501. - PubMed
    1. Avishai-Eliner S, Gilles EE, Eghbal-Ahmadi M, Bar-El Y, and Baram TZ (2001). Altered regulation of gene and protein expression of hypothalamic-pituitary-adrenal Axis components in an immature rat model of chronic stress. J. Neuroendocrinol. 13, 799–807. - PMC - PubMed
    1. Ayata P, Badimon A, Strasburger HJ, Duff MK, Montgomery SE, Loh Y-HE, Ebert A, Pimenova AA, Ramirez BR, Chan AT, et al. (2018). Epigenetic regulation of brain region-specific microglia clearance activity. Nat. Neurosci. 21, 1049–1060. - PMC - PubMed
    1. Badimon A, Strasburger HJ, Ayata P, Chen X, Nair A, Ikegami A, Hwang P, Chan AT, Graves SM, Uweru JO, et al. (2020). Negative feedback control of neuronal activity by microglia. Nature 586, 417–423. - PMC - PubMed

Publication types

Substances