. 2022 Mar 29;38(13):110574.
doi: 10.1016/j.celrep.2022.110574.

Dopamine neurons evaluate natural fluctuations in performance quality

Affiliations

Dopamine neurons evaluate natural fluctuations in performance quality

Alison Duffy et al. Cell Rep. .

Abstract

Many motor skills are learned by comparing ongoing behavior to internal performance benchmarks. Dopamine neurons encode performance error in behavioral paradigms where error is externally induced, but it remains unknown whether dopamine also signals the quality of natural performance fluctuations. Here, we record dopamine neurons in singing birds and examine how spontaneous dopamine spiking activity correlates with natural fluctuations in ongoing song. Antidromically identified basal ganglia-projecting dopamine neurons correlate with recent, and not future, song variations, consistent with a role in evaluation, not production. Furthermore, maximal dopamine spiking occurs at a single vocal target, consistent with either actively maintaining the existing song or shifting the song to a nearby form. These data show that spontaneous dopamine spiking can evaluate natural behavioral fluctuations unperturbed by experimental events such as cues or rewards.

Keywords: CP: Neuroscience; Gaussian process model; basal ganglia; birdsong; dopamine; generalized linear model; motor skill learning; natural behavior; performance prediction error; skill maintenance; ventral tegmental area.


Conflict of interest statement

Declaration of interests The authors declare no competing interests.

Figures

Figure 1.
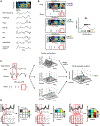
Figure 1.. Experimental identification of performance error in VTA DA neurons in singing birds
(A) Evaluation of auditory feedback during singing is thought to produce an error signal for song learning (reproduced from Gadagkar et al., 2016, with the permission of AAAS). (B) Basal ganglia (Area X)-projecting DA neurons from VTA were antidromically identified (reproduced from Gadagkar et al., 2016, with the permission of AAAS). (C) Example of DAF. The target syllable was randomly distorted across motifs. All other syllables (labeled “Natural”) were left undisturbed (reproduced from Gadagkar et al., 2016, with the permission of AAAS). (D) (Left, top to bottom) Example spectrograms of renditions with the target syllable undistorted (enclosed in blue box) and distorted (enclosed in red box); rate histogram of distorted and undistorted renditions (the horizontal bar indicates significant deviations from baseline [p < 0.05, z test; see STAR Methods]); (Right) Normalized response to target syllable in VTAerror and VTAother neurons (mean ± SEM; see STAR Methods) (reproduced from Gadagkar et al., 2016, with the permission of AAAS). (E) The experimental results suggest a hypothesis that fluctuations in natural song should also result in VTAerror responses.
Figure 2.
Figure 2.. A Gaussian process model approach reveals song-spike relationships
(A) Natural song was parameterized into eight time-varying song features. (B) Schematic of fitting song fluctuations to spike counts within specific time windows. Local feature averages (one feature shown for illustration) were used to predict local spike counts using a GP model. (C) Schematic of fitting a single, multivariate model using multiple song features. The multi-dimensional model takes a weighted average of the model predictions from every combination of eight song features (two shown here for illustration). The middle column shows the three feature combinations for two example features (t-b): pitch only; pitch and entropy; entropy only. The model’s goodness of fit was quantified by the cross-validated r2 calculated from the final, weighted average model (see STAR Methods). The cyan dot indicates an example held out data point in the cross-validation procedure. (D) Schematic of modeling technique shown in (B and C) now extended across a range of song windows and song-spike latencies, thus building a matrix of r2 values. The top panels show a sliding window along the song (single feature shown for illustration). The bottom panels show the time-aligned spiking activity across renditions in a raster plot. Each entry in the r2 matrix (middle panels) represents the fit between one song window and one spike window, shown here connected with red lines.
Figure 3.
Figure 3.. Timing of song-spike relationships for VTAerror neurons suggests an evaluative process
(A) Spectrogram of example syllable (top left). Heatmap of r2 values for fitted relationships between local song feature averages and binned spike counts (top right). r2> 0 indicates a predictive relationship. The pink box indicates the region where the latency matches the hypothesized response for a PPE, 0–150 ms. The lower heatmap shows an r2 matrix for a shuffled version of the data (see STAR Methods). (B) Histogram of latencies for predictive fits shown in (A). (C) Latency distribution of predictive fits over all VTAerror neurons (n = 22) showed a significant peak in the number of responses in the expected PPE time window (**p < 0.01; see STAR Methods). (D) Same as in (C), but for the VTAother neuron population (n = 23).
Figure 4.
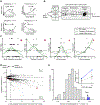
Figure 4.. The form of the predominant song-spike relationship for VTAerror neurons is consistent with song maintenance
(A) The form of a song-spike relationship determines how the song is being reinforced. α and β correspond to the quadratic and linear coefficients in the GLM shown in (B). (B) Schematic of the nested GLM fitting process to quantify tuning curve shape for VTAerror neuron activity to natural song fluctuations. (C) Example tuning curves obtained with the GP model, l-GLM, and q-GLM between single song features and spike counts for a selection of song-spike model fits. Each point on each plot represents a single rendition. Pink shapes denote fit locations marked in (D). The r2 values for each example fit, l-r are: 0.13, 0.27, 0.13, 0.24. Additional, single-feature examples are given in Figure S4. (D) The quadratic coefficient for q-GLM model fits to predictive song-spike relationships (defined within the GP model) as a function of ΔAIC values in the GLM model comparison within the PPE latency range. Each point represents one q-GLM fit to a significant song feature-spike count pair. Pink shapes denote fits shown in (C). The fraction of total data points in each quadrant about the [0,0] origin, clockwise from top left is: 0.24, 0.09, 0.32, 0.34. This plot zooms in on 99.5% of data. Outlier points follow the same trend but increase scale and obscure visualization. All data are used in analysis. (E) Fraction of stabilizing fits (negative quadratic coefficient) for all fits better described as quadratic than linear (ΔAIC > 0) compared with shuffled population fractions. The blue point is the data and each value in the gray histogram is a single fraction from an independent population shuffle (see STAR Methods). The data showed a greater fraction of stabilizing fits than expected by chance (two-sided bootstrap test: p < 0.02; see STAR Methods). Inset: same distribution but now shown for both the binned ΔAIC > 0 group and ΔAIC ∈[−2, 0]. The blue point is the true fraction and gray points are fractions from shuffled populations (see STAR Methods).

References

    1. Akaike H (1974). A new look at the statistical model identification. IEEE Trans. Automatic Control 19, 716–723.
    1. Ali F, Otchy TM, Pehlevan C, Fantana AL, Burak Y, and Olveczky BP (2013). The basal ganglia is necessary for learning spectral, but not temporal, features of birdsong. Neuron 80, 494–506. 10.1016/j.neuron.2013.07.049. - DOI - PMC - PubMed
    1. Aljadeff J, Lansdell BJ, Fairhall AL, and Kleinfeld D (2016). Analysis of neuronal spike trains, deconstructed. Neuron 91, 221–259. 10.1016/j.neuron.2016.05.039. - DOI - PMC - PubMed
    1. Andalman AS, and Fee MS (2009). A basal ganglia-forebrain circuit in the songbird biases motor output to avoid vocal errors. Proc. Natl. Acad. Sci. U S A 106, 12518–12523. 10.1073/pnas.0903214106. - DOI - PMC - PubMed
    1. Barter JW, Li S, Lu D, Bartholomew RA, Rossi MA, Shoemaker CT, Salas-Meza D, Gaidis E, and Yin HH (2015). Beyond reward prediction errors: the role of dopamine in movement kinematics. Front. Integr. Neurosci 9, 39. 10.3389/fnint.2015.00039. - DOI - PMC - PubMed

Publication types

LinkOut - more resources