. 2022 Mar 29;38(13):110576.
doi: 10.1016/j.celrep.2022.110576.

Developmental coupling of cerebral blood flow and fMRI fluctuations in youth

Affiliations

Developmental coupling of cerebral blood flow and fMRI fluctuations in youth

Erica B Baller et al. Cell Rep. .

Abstract

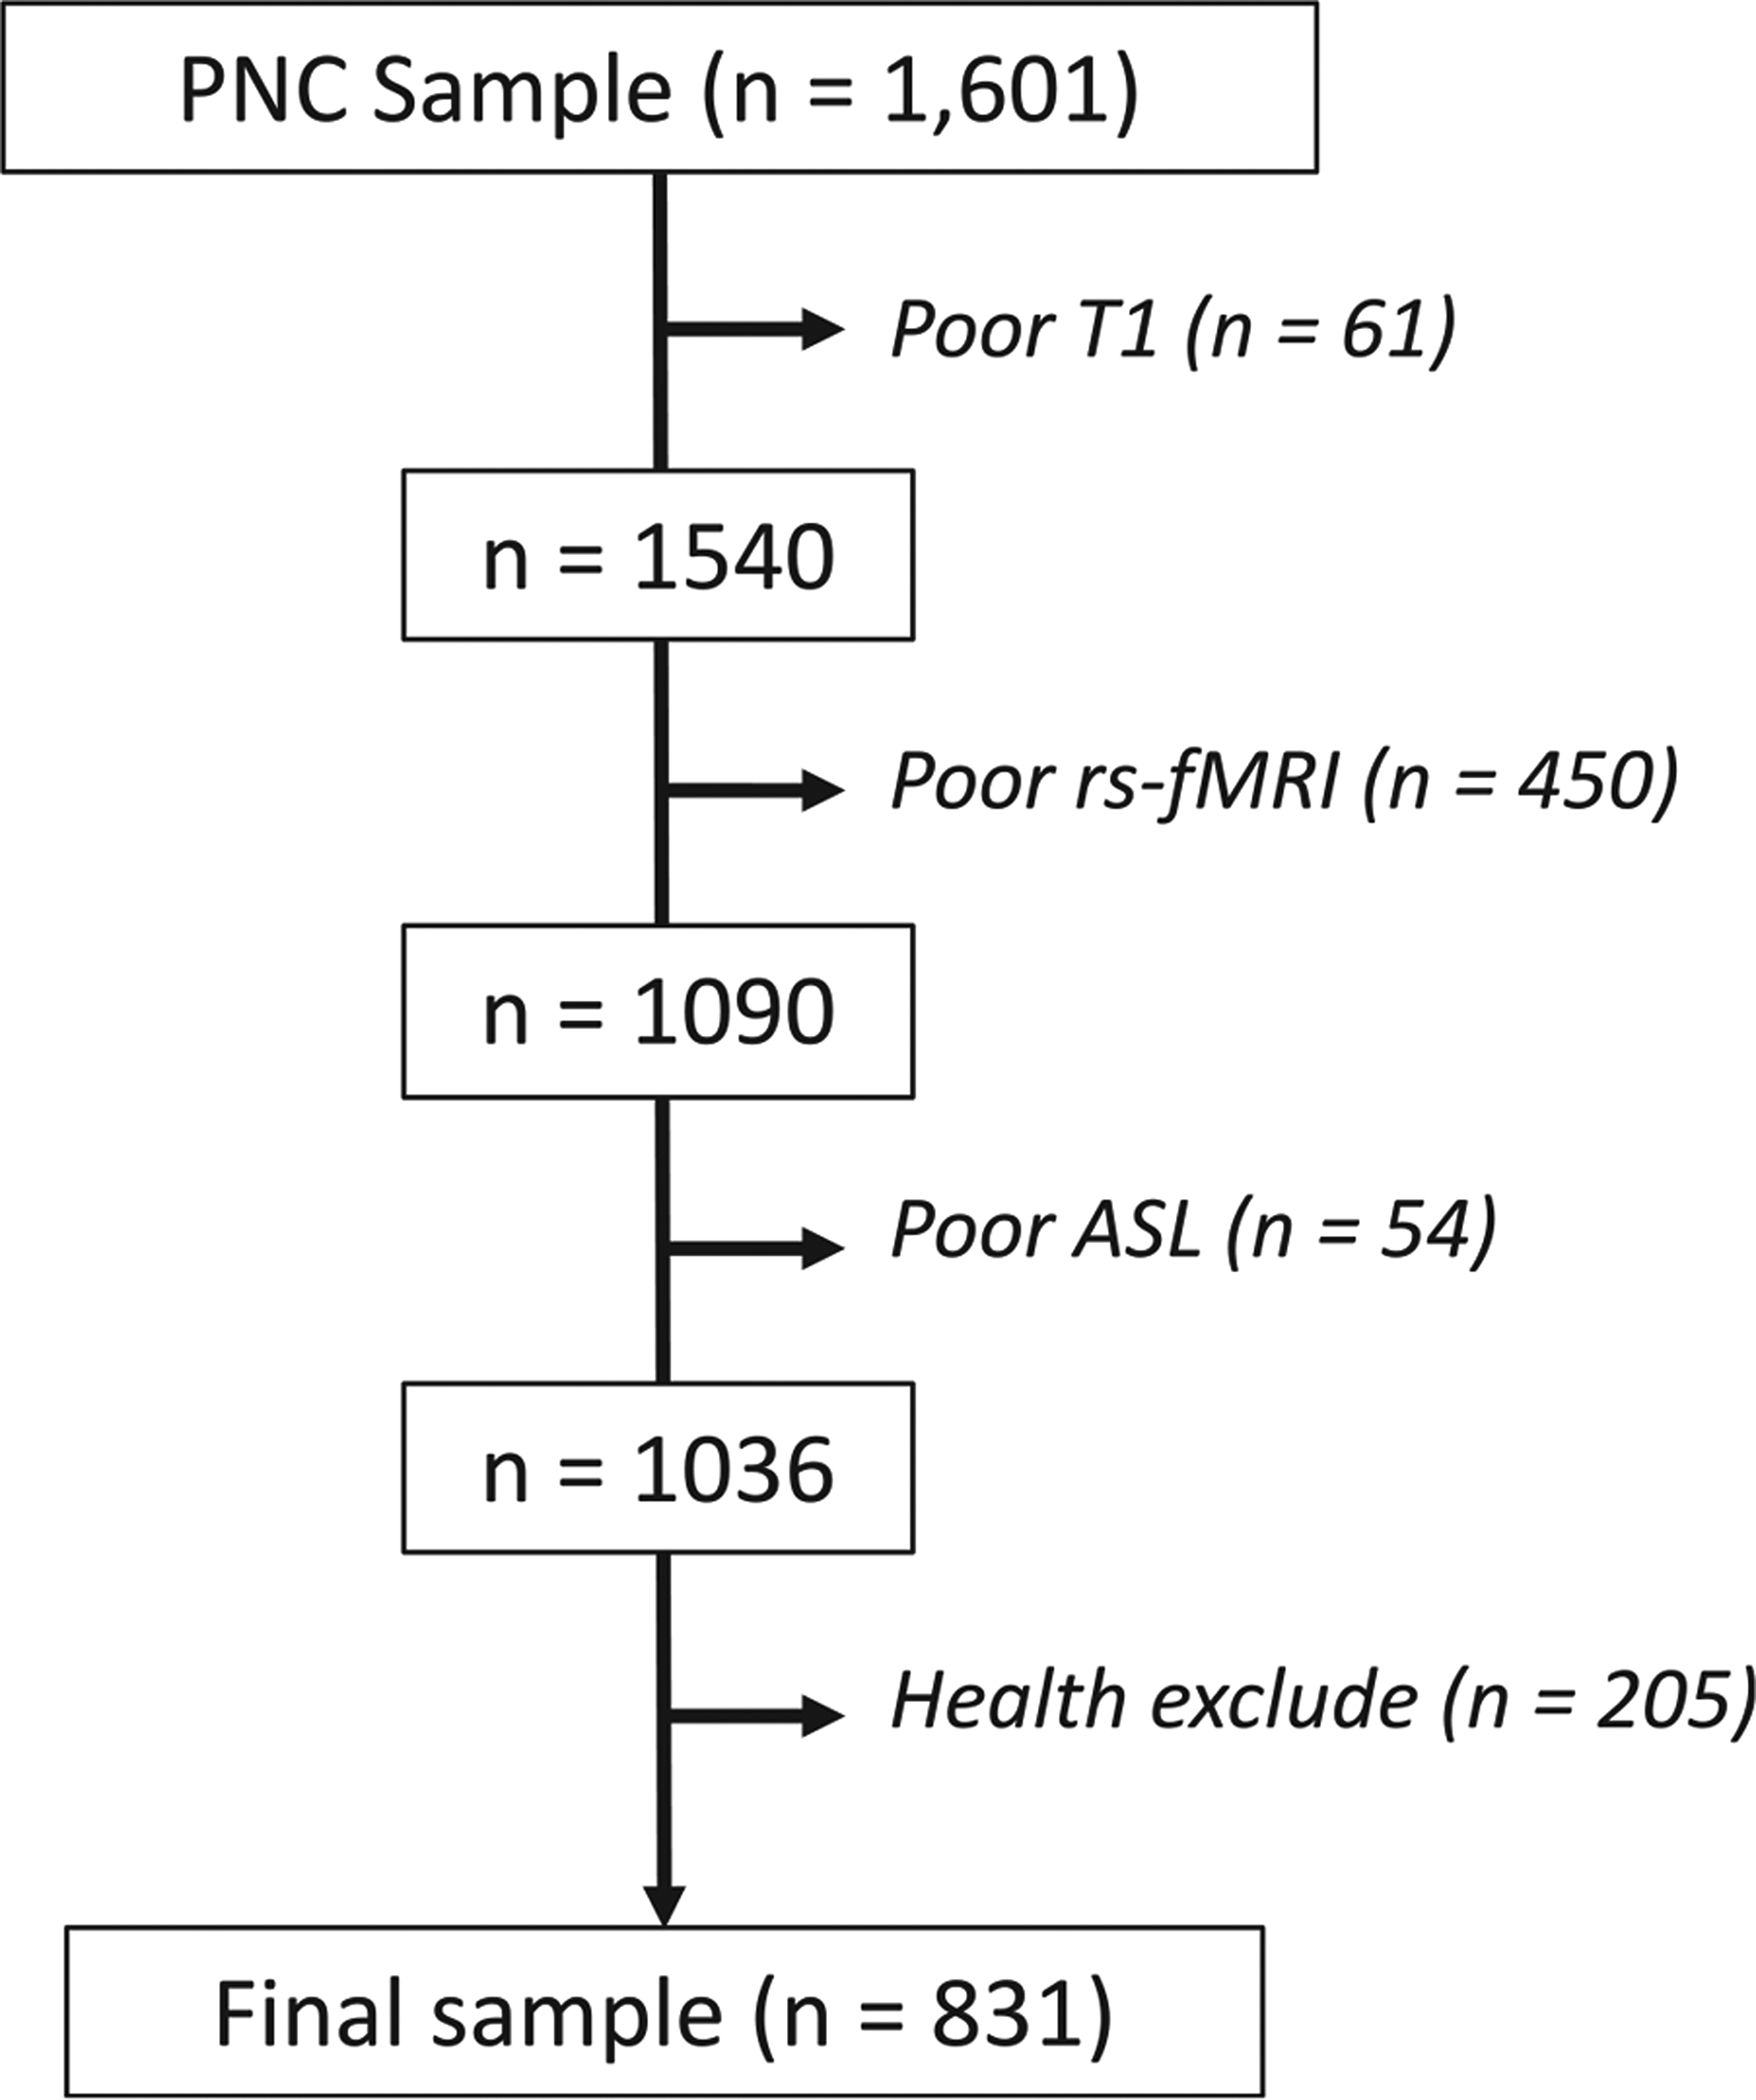
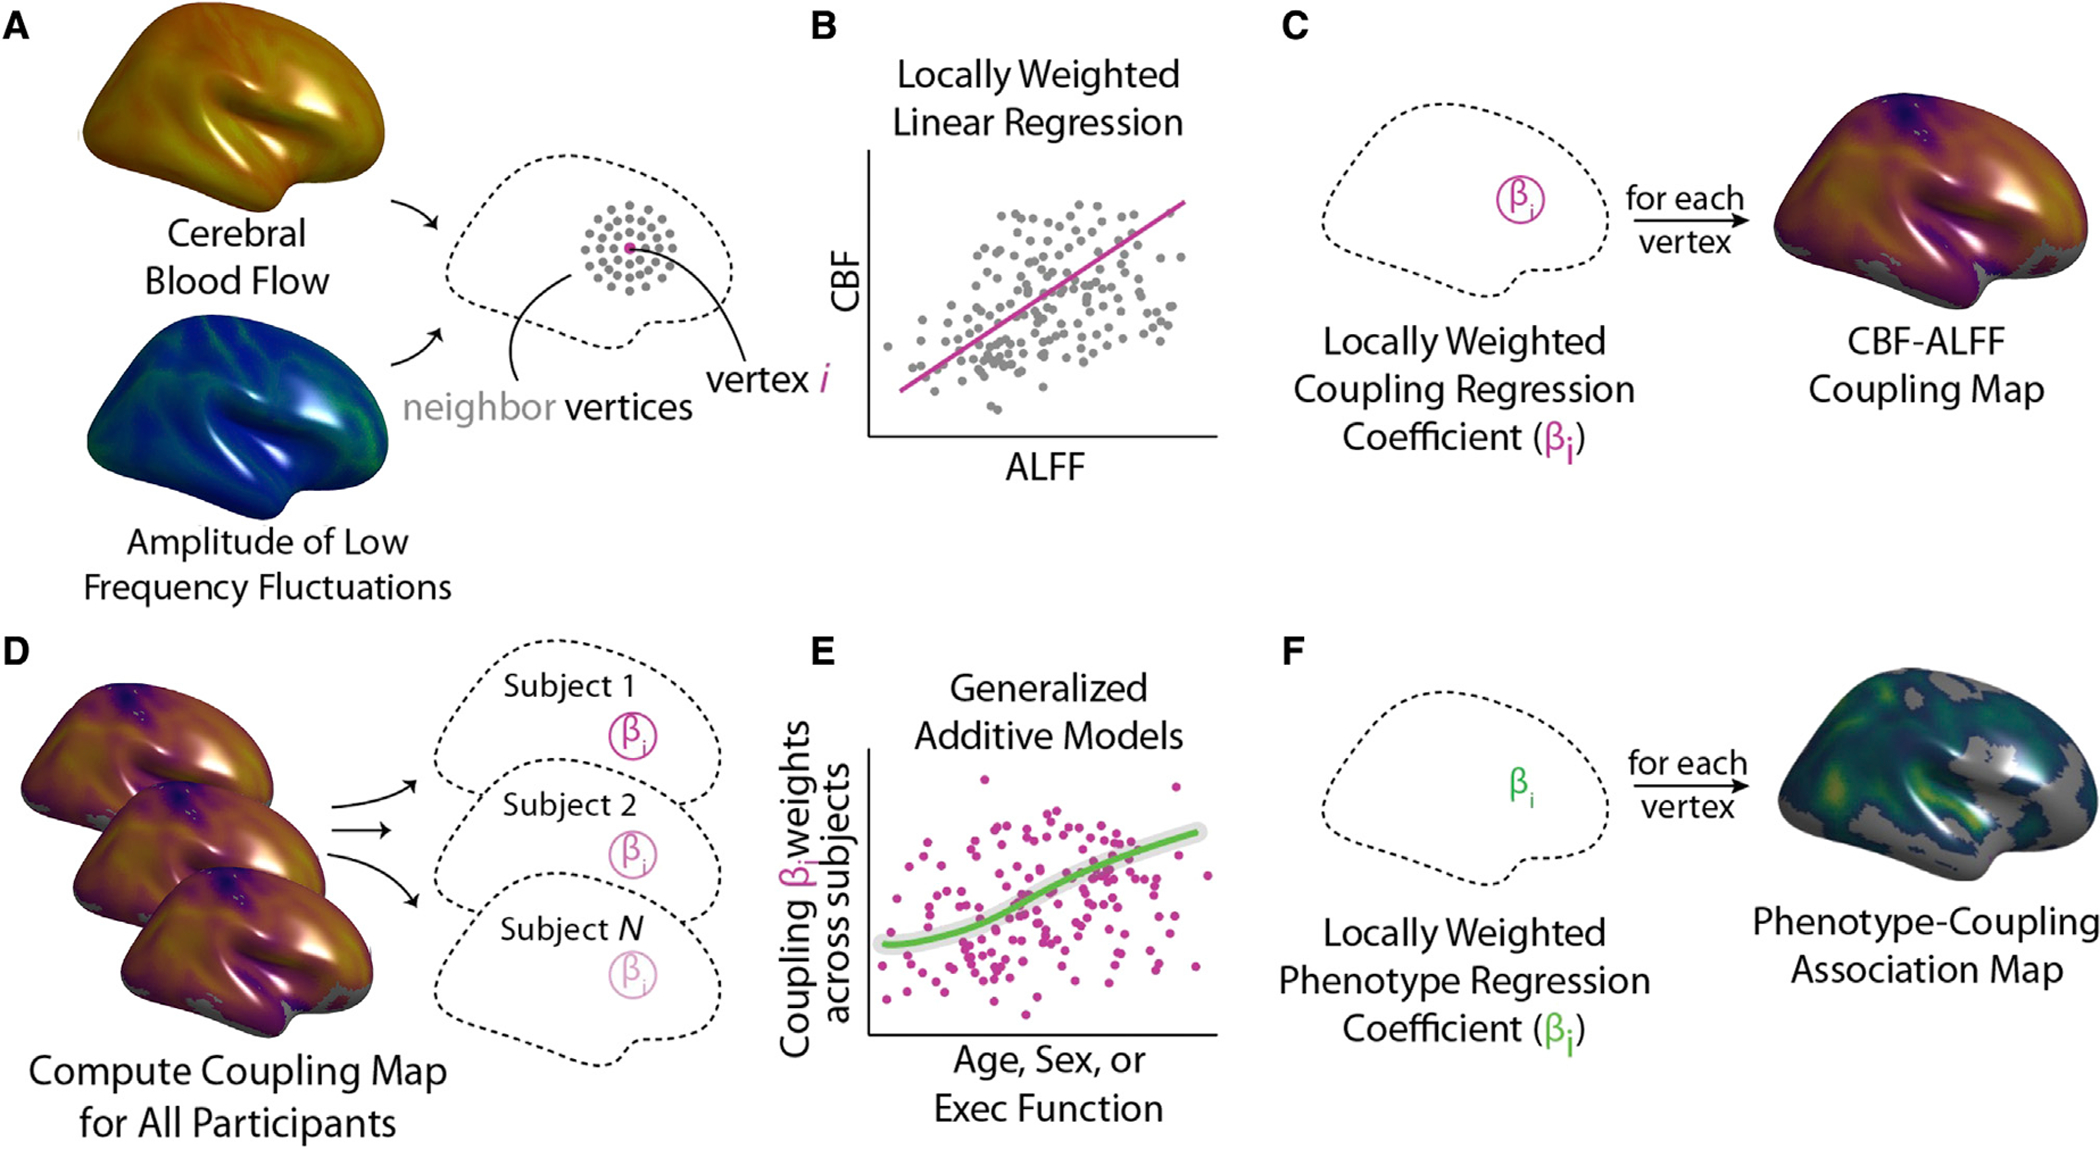
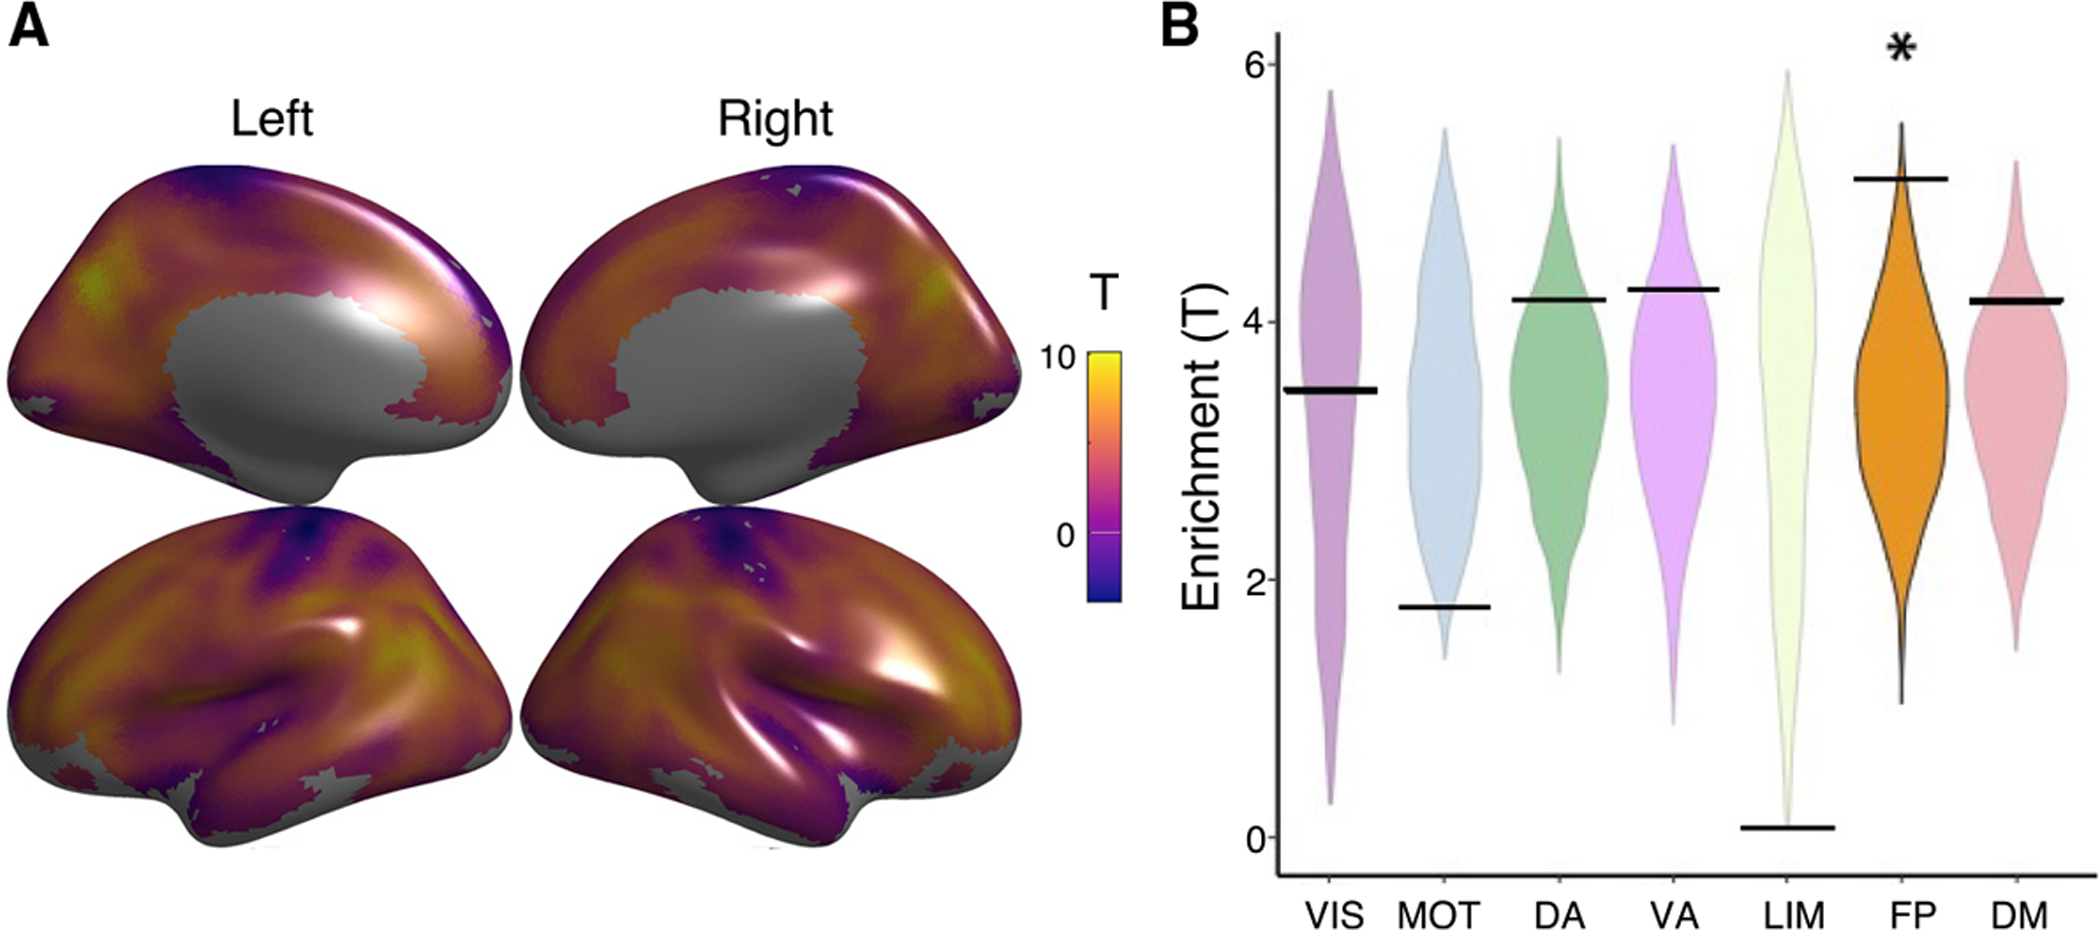
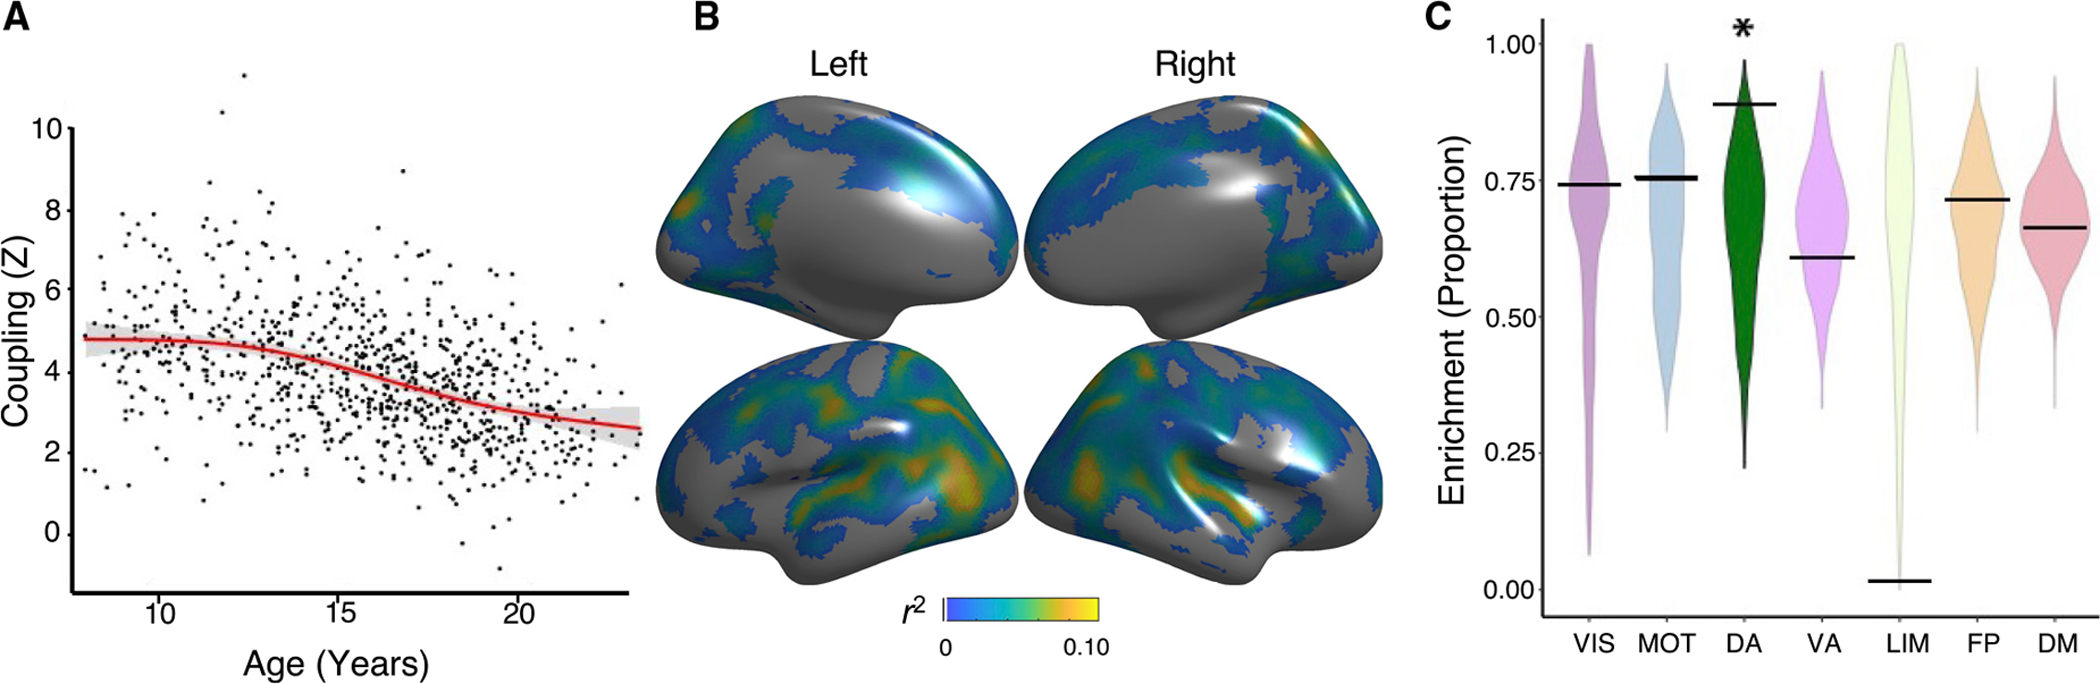
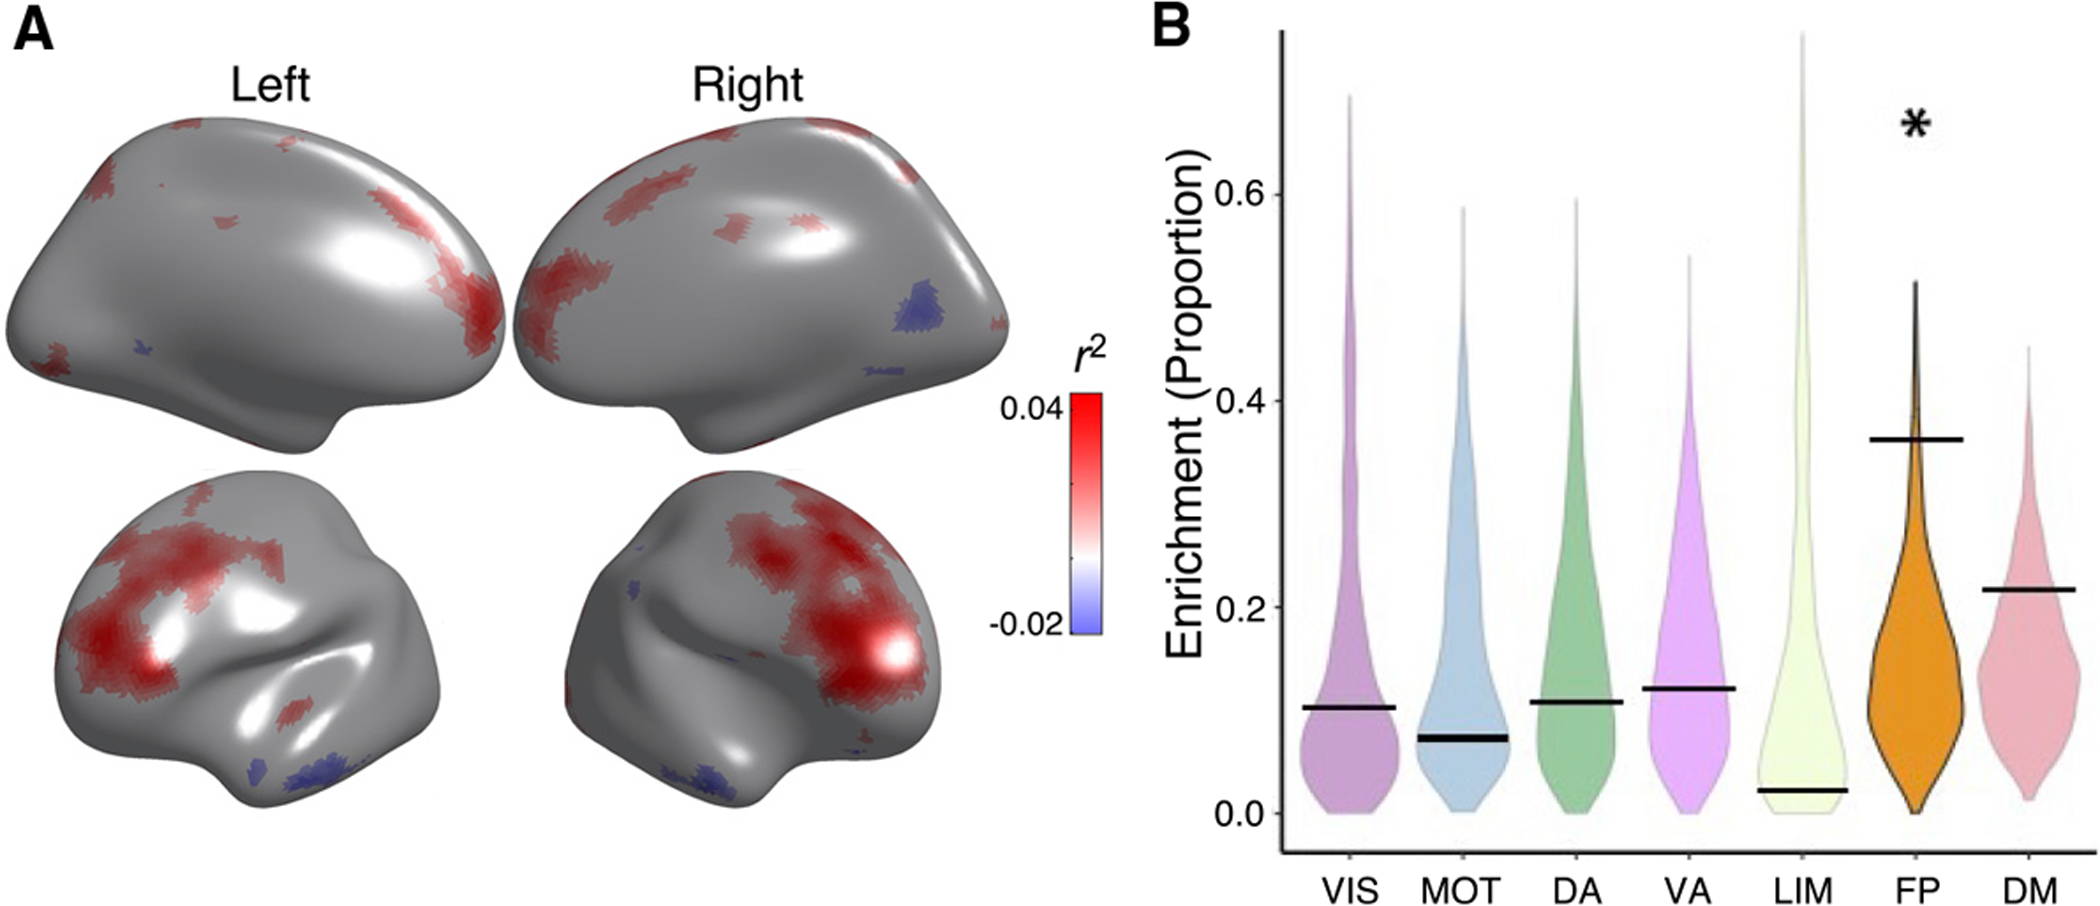
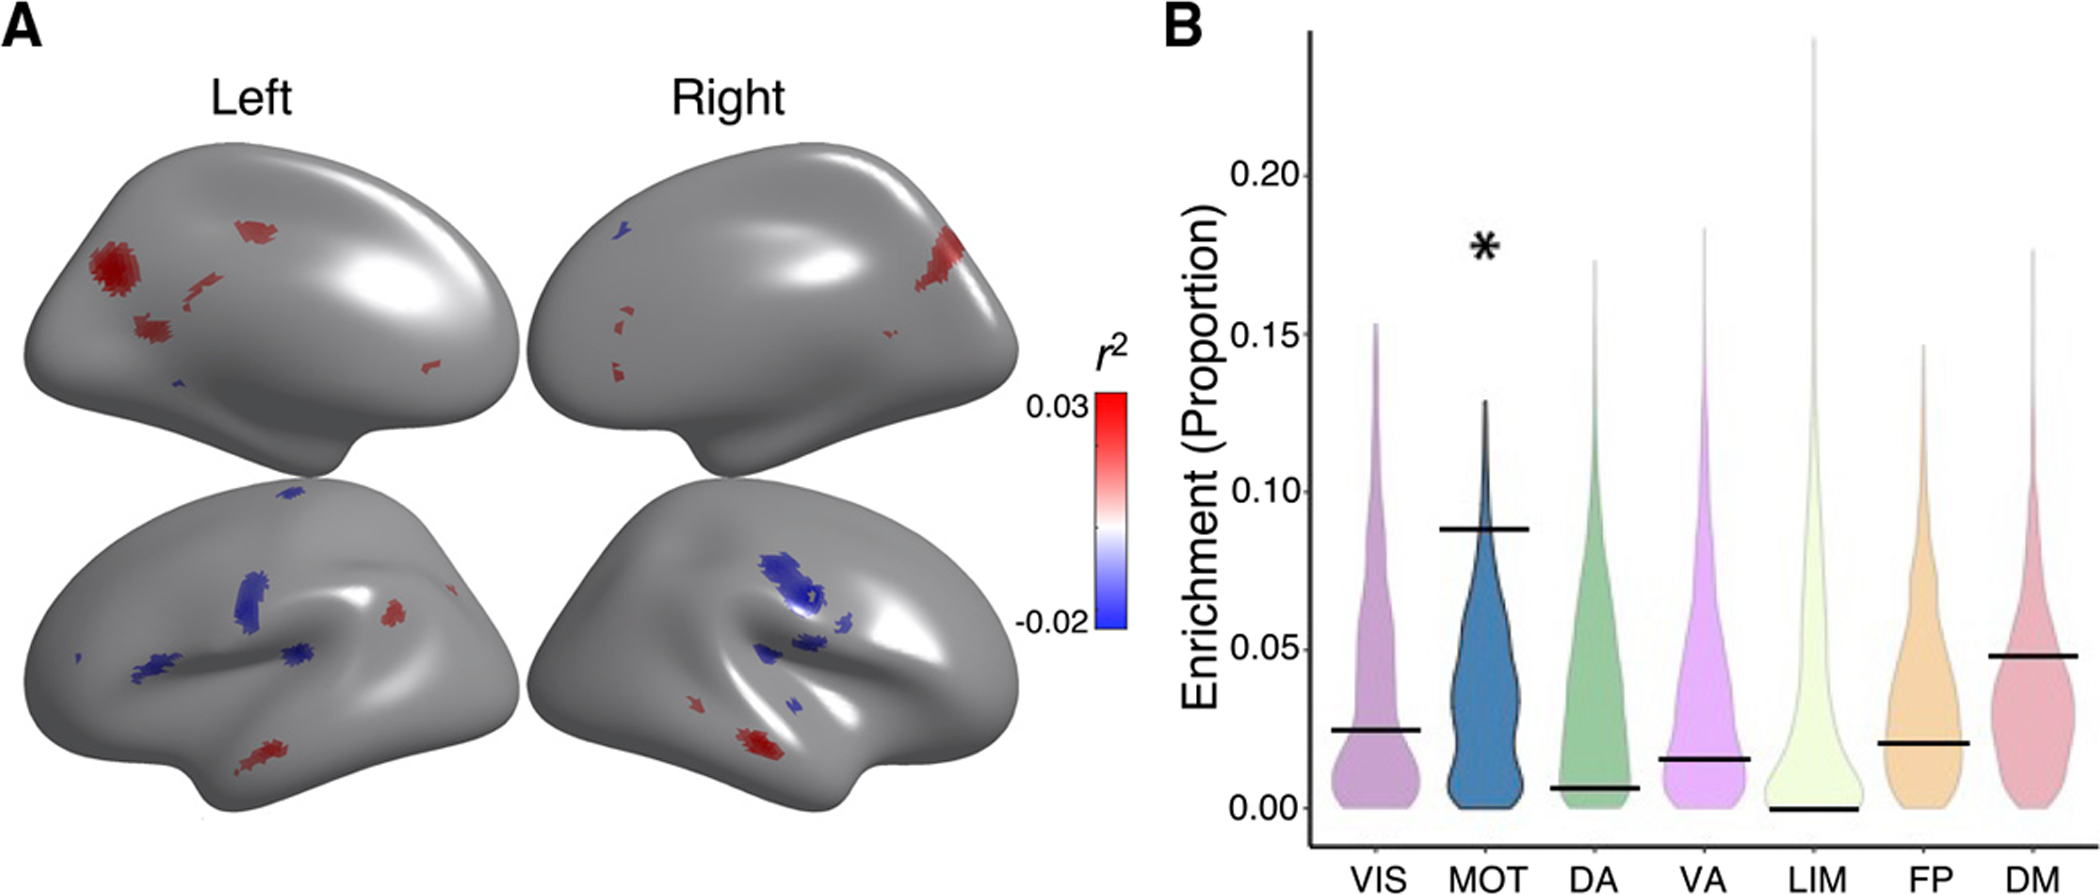
The functions of the human brain are metabolically expensive and reliant on coupling between cerebral blood flow (CBF) and neural activity, yet how this coupling evolves over development remains unexplored. Here, we examine the relationship between CBF, measured by arterial spin labeling, and the amplitude of low-frequency fluctuations (ALFF) from resting-state magnetic resonance imaging across a sample of 831 children (478 females, aged 8-22 years) from the Philadelphia Neurodevelopmental Cohort. We first use locally weighted regressions on the cortical surface to quantify CBF-ALFF coupling. We relate coupling to age, sex, and executive functioning with generalized additive models and assess network enrichment via spin testing. We demonstrate regionally specific changes in coupling over age and show that variations in coupling are related to biological sex and executive function. Our results highlight the importance of CBF-ALFF coupling throughout development; we discuss its potential as a future target for the study of neuropsychiatric diseases.

Keywords: CP: Neuroscience; adolescence; amplitude of low-frequency fluctuations; cerebral blood flow; development; executive function; frontoparietal; neurovascular coupling; sex differences.


Conflict of interest statement

Declaration of interests The authors have no competing interests.

Figures

Figure 1.
Figure 1.. Sample construction
A total of 1,601 participants had neuroimaging scans acquired as part of the PNC, and 831 were included in the study after excluding those who failed rigorous quality assessment for poor T1 quality (n = 61), resting-state fMRI quality (n = 450), ASL quality (n = 54), and medical and psychiatric comorbidities (n = 205).
Figure 2.
Figure 2.. Analysis of CBF-ALFF coupling
CBF-ALFF coupling analysis involves both calculation of within-subject coupling and across-subject comparisons to assess individual differences. (A) For each subject, a neighborhood for each vertex was identified. (B) Locally weighted regressions of ALFF onto CBF were calculated. (C) Locally weighted regressions were repeated at each vertex, resulting in a participant-level coupling map. (D and E) After subject-level coupling maps were calculated, statistical analyses relating covariates of interest (e.g., age, sex, and executive function) to participant-level coupling maps were calculated using generalized additive models (GAMs). (F) GAMs were fit at each vertex, yielding a group-level statistical map describing individual differences.
Figure 3.
Figure 3.. Mean CBF-ALFF coupling
(A) CBF-ALFF coupling is robust throughout the brain, with maximal coupling in the medial and lateral prefrontal cortex, parietal cortex, posterior cingulate. and precuneus. (B) We used a spin-based spatial permutation test that accounted for spatial autocorrelation to evaluate enrichment of CBF-ALFF coupling in canonical functional networks. This revealed enrichment in the frontoparietal network (p = 0.005). The asterisk represents statistical significance (p < 0.05). The black bars represent the observed values, whereas the violin plots reflect the null distributions.
Figure 4.
Figure 4.. CBF-ALFF coupling evolves with age
Linear and nonlinear age effects of CBF-ALFF were flexibly modeled within a generalized additive model at each vertex, while controlling for sex and in-scanner motion; multiple comparisons were controlled using the false discovery rate (Q < 0.05). (A) Mean cortical CBF-ALFF coupling declines with age in a nonlinear fashion (F3,828 = 60.0, p < 0.0001). Data points represent the mean CBF-ALFF coupling (Z) for each subject (n = 831) across all vertices that met statistical correction (pfdr < 0.05). (B) Vertex-level CBF-ALFF declines were prominent in the posterior temporal cortex, parietal cortex, and dorsolateral prefrontal cortex. Partial correlation coefficients (r2) are displayed to show the strength of effects. (C) Spin testing revealed enrichment of age effects within the dorsal attention network (p = 0.027). The asterisk represents statistical significance. Black bars represent the observed values, whereas the violin plots reflect the null distributions.
Figure 5.
Figure 5.. Sex differences in CBF-ALFF coupling
(A) CBF-ALFF coupling is higher in females than males in the bilateral dorsolateral prefrontal cortex, medial frontal cortex, anterior cingulate cortex, and precuneus. CBF-ALFF coupling differences between females and males were modeled using generalized additive models, while adjusting for both linear and nonlinear age effects as well as in-scanner motion; multiple comparisons were controlled using the false discovery rate (Q < 0.05). Partial correlation coefficients (r2) are displayed to show strength of effects. For visualization purposes, regions where females had higher coupling have a positive r2 and are shown in red, whereas regions where males had higher coupling have a negative r2 and are shown in blue. (B) Spin testing revealed significant enrichment of sex differences within the frontoparietal network (p = 0.032). The asterisk represents statistical significance. Black bars represent the observed values, whereas the violin plots reflect the null distributions.
Figure 6.
Figure 6.. CBF-ALFF coupling is related to executive function
(A) The relationship of CBF-ALFF coupling to executive function showed regional variation, with both positive and negative associations. Generalized additive models were used to calculate the relationship between CBF-ALFF coupling and executive function while controlling for linear and nonlinear age effects, sex effects, and in-scanner motion; multiple comparisons were accounted for using the false discovery rate (Q < 0.05). Higher coupling in parts of the default mode were associated with better executive functioning, while higher coupling in parts of the somatomotor network were associated with reduced executive functioning. Partial correlation coefficients (r2 values) are displayed to show strength of effects. For visualization purposes, regions with positive associations have a positive r2 and are shown in red, whereas regions with negative associations have a negative r2 and are shown in blue. (B) Spin testing revealed that associations between executive function and coupling were significantly enriched in the motor network (p = 0.040). The asterisk represents statistical significance (p < 0.05). Black bars represent the observed values, whereas the violin plots reflect the null distributions.

References

    1. Alexander-Bloch A, Shou H, Liu S, Satterthwaite TD, Glahn DC, Shinohara RT, Vandekar SN, and Raznahan A (2018). On testing for spatial correspondence between maps of human brain structure and function. Neuroimage 178, 540–551. 10.1016/j.neuroimage.2018.05.070. - DOI - PMC - PubMed
    1. Arain M, Haque M, Johal L, Mathur P, Nel W, Rais A, Sandhu R, and Sharma S (2013). Maturation of the adolescent brain. Neuropsychiatr. Dis. Treat 9, 449–461. 10.2147/NDT.S39776. - DOI - PMC - PubMed
    1. Armstead WM (2016). Cerebral blood flow autoregulation and dysautoregulation. Anesthesiol Clin. 34, 465–477. 10.1016/j.anclin.2016.04.002. - DOI - PMC - PubMed
    1. Attwell D, and Laughlin SB (2001). An energy budget for signaling in the grey matter of the brain. J. Cereb. Blood Flow Metab 21, 1133–1145. 10.1097/00004647-200110000-00001. - DOI - PubMed
    1. Ball G, Beare R, and Seal ML (2019). Charting shared developmental trajectories of cortical thickness and structural connectivity in childhood and adolescence. Hum. Brain Mapp 40, 4630–4644. 10.1002/hbm.24726. - DOI - PMC - PubMed

Publication types