. 2022 May 9;32(9):1949-1960.e5.
doi: 10.1016/j.cub.2022.03.014. Epub 2022 Mar 29.

Sequential sampling from memory underlies action selection during abstract decision-making

Affiliations

Sequential sampling from memory underlies action selection during abstract decision-making

S Shushruth et al. Curr Biol. .

Abstract

The study of perceptual decision-making in monkeys has provided insights into the process by which sensory evidence is integrated toward a decision. When monkeys make decisions with the knowledge of the motor actions the decisions bear upon, the process of evidence integration is instantiated by neurons involved in the selection of said actions. It is less clear how monkeys make decisions when unaware of the actions required to communicate their choice-what we refer to as "abstract" decisions. We investigated this by training monkeys to associate the direction of motion of a noisy random-dot display with the color of two targets. Crucially, the targets were displayed at unpredictable locations after the motion stimulus was extinguished. We found that the monkeys postponed decision formation until the targets were revealed. Neurons in the parietal association area LIP represented the integration of evidence leading to a choice, but as the stimulus was no longer visible, the samples of evidence must have been retrieved from short-term memory. Our results imply that when decisions are temporally unyoked from the motor actions they bear upon, decision formation is protracted until they can be framed in terms of motor actions.

Keywords: decision making, abstraction, short-term memory, area LIP, macaque monkey.


Conflict of interest statement

Declaration of interests MNS is a member of the advisory board of Current Biology. The other authors declare no competing interests.

Figures

Figure 1.
Figure 1.. Behavioral task.
The monkey fixates at an instructed location (red dot). After a delay, a random dot motion stimulus appears around the fixation point. The stimulus terminates after a variable duration (350–800 ms). After another short delay (200–333 ms), a blue and a yellow target appear at unpredictable peripheral locations. In the go version of the task (top panel), the fixation is extinguished at the time the targets appear and the monkey can report the decision by choosing one of the colored targets. In the wait version of the task (bottom panel), the monkey must wait until the fixation point is extinguished before choosing a target. During recording sessions, the target locations on each trial are pseudorandomly chosen from a restricted set of locations based on the receptive field of the neuron being recorded. The unchosen locations are illustrated by dashed gray circles (not shown to the monkey). During training sessions, the target locations were less constrained.
Figure 2.
Figure 2.. Color choices are governed by the strength and direction of motion.
A, Effect of motion strength on decisions for monkey-AN on the go-task. Monkey-AN was trained to associate blue with rightward and yellow with leftward. The proportion of blue (rightward) choices are plotted as a function of signed motion strength (rightward motion is positive signed). Curves are logistic regression fits to the data. Error bars are s.e. B, Effect of motion strength on decisions for monkey-SM on the wait-task. Monkey-SM was trained to associate yellow with rightward and blue with leftward. The proportion of yellow (rightward) choices are plotted as a function of signed motion strength. Otherwise, same conventions as in A. C–D, The influence of fluctuations in motion information on choices plotted as a function of time from motion onset. Curves represents the mean motion energy in support of the direction chosen by the monkey on 0% coherence trials (shading, ±1 s.e.m.).
Figure 3.
Figure 3.. Putative strategies.
Schematic of strategies that monkeys could adopt to solve the task. Strategy 1: During motion viewing, evidence for motion direction is accumulated to decide if the motion is to the right or left. The result of the decision about direction and/or its color association is stored. When the colored targets are presented, the previously made decision guides an immediate saccade to the target with the chosen color. The saccadic latency might vary by 10–20 ms as a function of confidence in the decision. Strategy 2: During motion viewing, the experienced evidence is stored in short term memory. When the targets are shown, the stored evidence is evaluated during action-selection to decide which of the two colored targets to choose. The drawing gives the impression of many samples, but the samples themselves might represent several tens of ms of motion information (as in).
Figure 4.
Figure 4.. Deliberation during action selection.
A Top, Go-RTs of monkey-AN plotted as a function of signed motion coherence. Curves are fits to a bounded drift-diffusion model. The model is also constrained by the choice proportions. Bottom, Same data as in Figure 2A. Curve is the fit of the bounded diffusion model, which accounts for both the choice proportions and the go-RTs. Table S2 shows the best-fitting model parameters. See also Figure S2 and Data S1. B, Proportion of rightward (yellow) choices as a function of motion strength for monkey-SM from the last four training sessions on the go-task (green, see Figure S1). The same data as Figure 2B is shown for comparison (black). Lines are logistic regression fits to the data. C, Influence of motion fluctuations on choice in the last four training sessions of the go-task for monkey-SM (green curve). Same conventions as Figure 2D. Data from the wait-task (black curve, same as in Figure 2D) is shown for comparison. See also Figure S3.
Figure 5.
Figure 5.. LIP activity during motion viewing and target selection.
The graphs show average normalized responses as a function of time aligned to motion onset or target onset. Data from the two monkeys are shown separately (left, AN, 29 neurons; right, SM, 31 neurons). A,D Responses aligned to motion onset. All trials are included. B,C,E,F Data from trials in which the blue (B,E) or yellow (C,F) target was in the neuronal response field. The responses are aligned to the onset of the target. In B & C, traces extend until at least 33% of the trials have not terminated. Insets show residual responses after removal of the large visual response to the target. They isolate the component of the response that is controlled by the strength and direction of motion. In all panels, coherences are grouped as High (±64% and ±32%), Medium (±16%), Low (±8% and ±4%) and 0%. Grouping of the direction of motion (for coherences >0%) is based on the preferred color-motion association for each neuron. This was consistent with the association the monkey had learned between motion direction and target color, except for six neurons in monkey-SM for which the association was reversed (see STAR Methods). The responses aligned to saccade are shown in Figure S4.
Figure 6.
Figure 6.. Buildup of neural activity depends on the strength and direction of motion.
Buildup rates were estimated for each neuron, using trials with the same motion strength, direction, and color-target in the response field (top, monkey-AN; bottom, monkey-SM). Symbols are averages across neurons (error bars are s.e.m.) The lines in the graph are weighted least square fits to the average buildup rates, grouped by motion direction. The 0% coherence point (gray) is included in both weighted regressions in each panel. See also Table S1.
Figure 7.
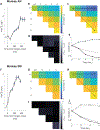
Figure 7.. Variance and autocorrelation of decision related neural responses during action selection.
The analyses depicted here evaluate predictions that the neural activity during action selection epoch on single trials includes a representation of accumulated noise. A,F, Variance of neural responses aligned to target onset. Filled symbols are estimates of the variance of the conditional expectations (VarCE) of the spike counts in 60 ms bins spanning the putative integration epoch. B,G, Theoretical correlations between the cumulative sums of independent, identically distributed random numbers from the 1st to ith and from 1st to jth samples. The unique values of the correlation matrix are displayed as an upper triangular matrix. The horizontal solid line shows the correlation between the first sample and the cumulative sum to the jth sample (lag = ji). It shows decreasing correlation as a function of lag. The dashed line identifies the first juxtadiagonal set of correlations between pairs with the same lag = 1. It shows an increase in correlation as a function of time of the pairs of samples. C,H, Correlations estimated from the neural response. These are the correlations between the conditional expectation of the spike counts (CorCE) in time bins i and j. If the rates on single trials are determined by unbounded drift-diffusion, these correlations should match the values in panels B/G. The top row and first juxtadiagonal are identified as in B/G. D,I, Deviance of the estimated correlations from theoretical correlations (sum of squares measure). E,J, Comparison of theoretical and estimated correlations in the top row and first juxtadiagonal of the matrices in B/G & C/H. Gray traces show the theoretical values in B/G. Black lines connect the CorCE values in C/H. Line and symbol styles distinguish the top row (correlation as a function of lag) and first juxtadiagonal (correlations of neighboring bins as a function of time). See also Figure S5.

Comment in

References

    1. Freedman DJ, Riesenhuber M, Poggio T, Miller EK. Categorical representation of visual stimuli in the primate prefrontal cortex [Journal Article]. Science. 2001;291(5502):312–6. Available from: https://www.ncbi.nlm.nih.gov/pubmed/11209083. - PubMed
    1. Freedman DJ, Assad JA. Experience-dependent representation of visual categories in parietal cortex [Journal Article]. Nature. 2006;443(7107):85–8. Available from: http://www.ncbi.nlm.nih.gov/pubmed/16936716. - PubMed
    1. Seger CA, Miller EK. Category learning in the brain [Journal Article]. Annu Rev Neurosci. 2010;33:203–19. Available from: https://www.ncbi.nlm.nih.gov/pubmed/20572771. - PMC - PubMed
    1. Goodwin SJ, Blackman RK, Sakellaridi S, Chafee MV. Executive control over cognition: stronger and earlier rule-based modulation of spatial category signals in prefrontal cortex relative to parietal cortex [Journal Article]. J Neurosci. 2012;32(10):3499–515. Available from: https://www.ncbi.nlm.nih.gov/pubmed/22399773. - PMC - PubMed
    1. Tenenbaum JB, Kemp C, Griffiths TL, Goodman ND. How to grow a mind: statistics, structure, and abstraction [Journal Article]. Science. 2011;331(6022):1279–85. Available from: https://www.ncbi.nlm.nih.gov/pubmed/21393536. - PubMed

Publication types

LinkOut - more resources