Review
. 2022 Aug:246:1-14.
doi: 10.1016/j.trsl.2022.03.010. Epub 2022 Mar 27.

Microfluidic methods to advance mechanistic understanding and translational research in sickle cell disease

Affiliations
Review

Microfluidic methods to advance mechanistic understanding and translational research in sickle cell disease

Melissa Azul et al. Transl Res. 2022 Aug.

Abstract

Sickle cell disease (SCD) is caused by a single point mutation in the β-globin gene of hemoglobin, which produces an altered sickle hemoglobin (HbS). The ability of HbS to polymerize under deoxygenated conditions gives rise to chronic hemolysis, oxidative stress, inflammation, and vaso-occlusion. Herein, we review recent findings using microfluidic technologies that have elucidated mechanisms of oxygen-dependent and -independent induction of HbS polymerization and how these mechanisms elicit the biophysical and inflammatory consequences in SCD pathophysiology. We also discuss how validation and use of microfluidics in SCD provides the opportunity to advance development of numerous therapeutic strategies, including curative gene therapies.


Figures

Figure 1:
Figure 1:. Sickle hemoglobin fiber polymerization is related to hemoglobin S concentration and is highly inefficient.
A. Hemoglobin S polymerization (C) as a function of HbS molecules per cell as calculated by Lu, L et al. 2017. Figure moodified and used with permission. B. Differential interference contrast images showing an example of heterogeneous nucleation (left) and the intersection of two separate HbS fibers (right). Red and yellow arrowheads indicate the region where the intensity value was calculated for the multifiber region (nucleation or intersection) or the adjacent region, respectively. Scale bars, 2 μm. (Figure modified and used with permission from Castle et al. 2019).
Figure 2:
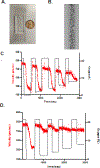
Figure 2:. Microfluidics devices to interrogate oxygen-dependent sickle RBC rheology.
A. Photo of a microfluidic device for scale, top-down view. B. Still image of red blood cells moving through microfluidic device. C-D: Raw representative RBC velocity data from a SCD subject. C. RBC velocity is tracked through the device while environmental oxygen tension within the device is varied between 0 % and 21%. In the untreated sample, RBC velocity is dependent upon oxygen tension as RBC flow velocity is reduced with hypoxia. D. RBCs from the same SCD subject after 1-hour incubation with 500 μM of voxelotor at 37C ex vivo. Identical oxygen tension protocol as in B; however, voxelotor-treated RBCs experience smaller velocity reductions with hypoxia and reach oxygen-independent flow at lower oxygen tensions than untreated samples.
Figure 3:
Figure 3:. Implications of sickle red blood cell dehydration.
A. Channels involved in sickle cell red cell dehydration. The Na-K pump (Na, K-ATPase) is more active in sickle RBCs. Monensin and other drugs can target this pump. The P-sickle channel, which may be PIEZO1, leads to Ca2+ influx. Furthermore, activation of GPCR and other cytokine-mediated channels leads to Ca2+ influx, which leads to Gardos channel activation. This leads to K+ and water efflux by aquaporins (AQ1). In SCD, the K-Cl cotransporter is also activated at low oxygen tensions, causing efflux of K+ and subsequently loss of water by aquaporins (AQ1).. Image created in Biorender. Fluid tonicity effects sRBC adherence to endothelium. B. Fluorescent-stained sRBC (red) adhered to human umblical vein endothelial cells. C. Bar graph illustrating how sRBC from 6 indivudals were less adherent to endothelium after exposure to hypotonic fluids. Figure modified and used with permission from Carden et. al. 2017.
Figure 4:
Figure 4:. Potential applications of microfluidic technologies in the development of SCD therapies.
1. Samples can be collected before or after treatment. 2. Ex vivo studies from individuals with SCD can be used. These would include oxygen-dependent sRBC velocity, oxygen-dependent sRBC adhesion studies, and oxygen-dependent occlusion studies to evaluate RBC behavior under physiologic relevant conditions. Furthermore, single-RBC polymer content can be established. 3. These findings can be integrated with clinical parameters, including patient-based assessments, to assess response. Furthermore, combined with computational modeling, cycles of further interventions to optimize combination therapies may be completed. Image created in Biorender.com.

References

    1. Connes P, Alexy T, Detterich J, Romana M, Hardy-Dessources MD, Ballas SK. The role of blood rheology in sickle cell disease. Blood Rev 2016;30(2):111–118. - PMC - PubMed
    1. Rees DC, Gibson JS. Biomarkers in sickle cell disease. Br J Haematol 2012;156(4):433–445. - PubMed
    1. Lubeck D, Agodoa I, Bhakta N, et al. Estimated Life Expectancy and Income of Patients With Sickle Cell Disease Compared With Those Without Sickle Cell Disease. JAMA Netw Open 2019;2(11):e1915374. - PMC - PubMed
    1. Kauf TL, Coates TD, Huazhi L, Mody-Patel N, Hartzema AG. The cost of health care for children and adults with sickle cell disease. Am J Hematol 2009;84(6):323–327. - PubMed
    1. National Center on Birth Defects and Developmental Disabilities CfDCaP Center For Disease Control. Vol. 2020. https://www.cdc.gov/ncbddd/sicklecell/data.html:CDC.gov; 2019.

Publication types

Substances