

Effects of 'Candidatus Liberibacter solanacearum' haplotypes A and B on tomato gene expression and geotropism
- PMID: 35354405
- PMCID: PMC8966271
- DOI: 10.1186/s12870-022-03505-z
Effects of 'Candidatus Liberibacter solanacearum' haplotypes A and B on tomato gene expression and geotropism
Abstract
Background: The tomato psyllid, Bactericera cockerelli Šulc (Hemiptera: Triozidae), is a pest of solanaceous crops such as tomato (Solanum lycopersicum L.) in the U.S. and vectors the disease-causing pathogen 'Candidatus Liberibacter solanacearum' (or Lso). Disease symptom severity is dependent on Lso haplotype: tomato plants infected with Lso haplotype B experience more severe symptoms and higher mortality compared to plants infected with Lso haplotype A. By characterizing the molecular differences in the tomato plant's responses to Lso haplotypes, the key components of LsoB virulence can be identified and, thus, targeted for disease mitigation strategies.
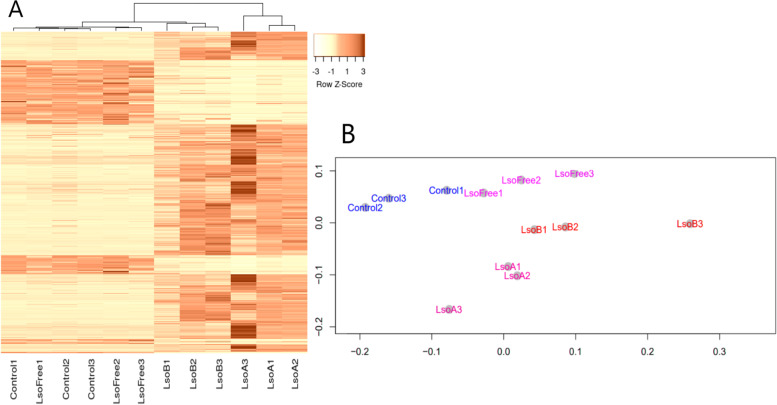
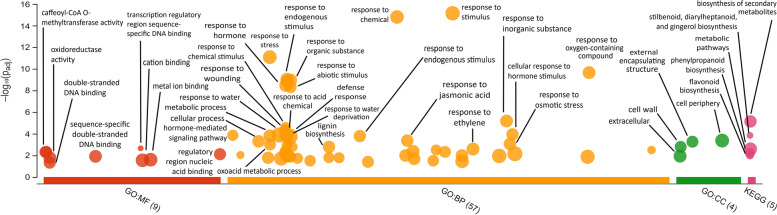
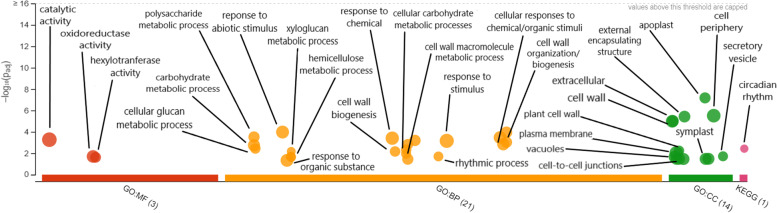
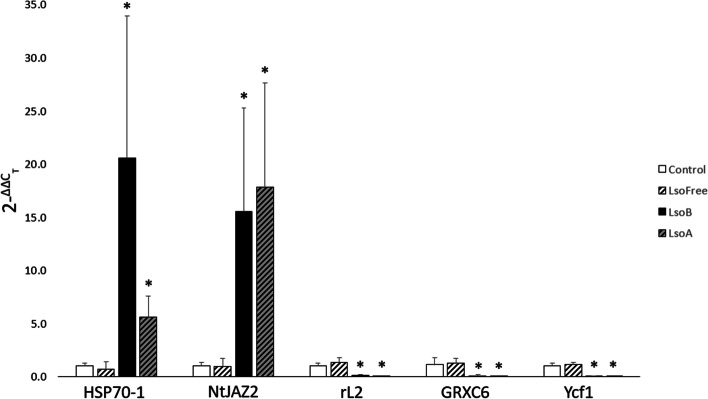
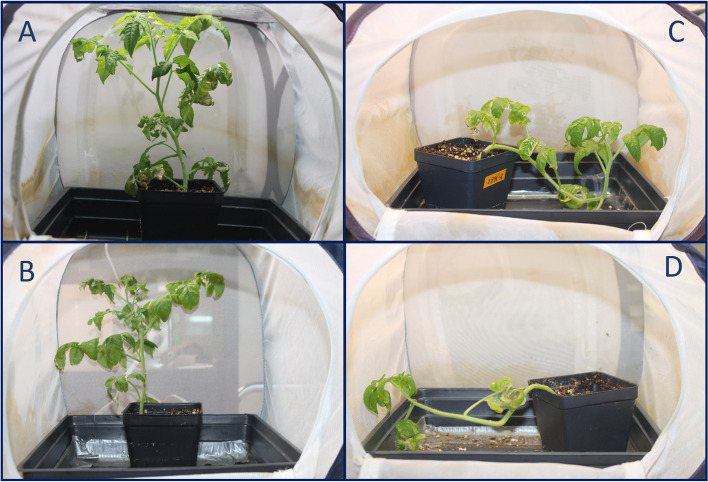
Results: To characterize the tomato plant genes putatively involved in the differential immune responses to Lso haplotypes A and B, RNA was extracted from tomato 'Moneymaker' leaves 3 weeks after psyllid infestation. Gene expression levels were compared between uninfected tomato plants (i.e., controls and plants infested with Lso-free psyllids) and infected plants (i.e., plants infested with psyllids infected with either Lso haplotype A or Lso haplotype B). Furthermore, expression levels were compared between plants infected with Lso haplotype A and plants infected with Lso haplotype B. A whole transcriptome analysis identified 578 differentially expressed genes (DEGs) between uninfected and infected plants as well as 451 DEGs between LsoA- and LsoB-infected plants. These DEGs were primarily associated with plant defense against abiotic and biotic stressors, growth/development, plant primary metabolism, transport and signaling, and transcription/translation. These gene expression changes suggested that tomato plants traded off plant growth and homeostasis for improved defense against pathogens, especially when infected with LsoB. Consistent with these results, tomato plant growth experiments determined that LsoB-infected plants were significantly stunted and had impaired negative geotropism. However, it appeared that the defense responses mounted by tomatoes were insufficient for overcoming the disease symptoms and mortality caused by LsoB infection, while these defenses could compensate for LsoA infection.
Conclusion: The transcriptomic analysis and growth experiments demonstrated that Lso-infected tomato plants underwent gene expression changes related to abiotic and biotic stressors, impaired growth/development, impaired plant primary metabolism, impaired transport and signaling transduction, and impaired transcription/translation. Furthermore, the transcriptomic analysis also showed that LsoB-infected plants, relative to LsoA-infected, experienced more severe stunting, had improved responses to some stressors and impaired responses to others, had poorer transport and signaling transduction, and had impaired carbohydrate synthesis and photosynthesis.
Keywords: Bactericera cockerelli; Gene expression; Lso haplotype; Plant-insect-microbe interactions; Potato; Psyllid; Solanum lycopersicum L.; Transcriptome; Transcriptomics; zebra chip; ‘Candidatus Liberibacter solanacearum’.
© 2022. The Author(s).
Conflict of interest statement
The authors declare that they have no competing interests.
Figures
Similar articles
-
Global gene regulation in tomato plant (Solanum lycopersicum) responding to vector (Bactericera cockerelli) feeding and pathogen ('Candidatus Liberibacter solanacearum') infection.Plant Mol Biol. 2018 May;97(1-2):57-72. doi: 10.1007/s11103-018-0724-y. Epub 2018 Apr 4. Plant Mol Biol. 2018. PMID: 29619663
-
Infection by Candidatus Liberibacter solanacearum' haplotypes A and B in Solanum lycopersicum 'Moneymaker'.Plant Dis. 2018 Oct;102(10):2009-2015. doi: 10.1094/PDIS-12-17-1982-RE. Epub 2018 Aug 22. Plant Dis. 2018. PMID: 30133358
-
Acquisition and transmission of two 'Candidatus Liberibacter solanacearum' haplotypes by the tomato psyllid Bactericera cockerelli.Sci Rep. 2020 Aug 19;10(1):14000. doi: 10.1038/s41598-020-70795-4. Sci Rep. 2020. PMID: 32814781 Free PMC article.
-
A comprehensive review of zebra chip disease in potato and its management through breeding for resistance/tolerance to 'Candidatus Liberibacter solanacearum' and its insect vector.Pest Manag Sci. 2022 Sep;78(9):3731-3745. doi: 10.1002/ps.6913. Epub 2022 May 6. Pest Manag Sci. 2022. PMID: 35415948 Review.
-
Biology, Ecology, and Management of the Potato Psyllid, Bactericera cockerelli (Hemiptera: Triozidae), and Zebra Chip Disease in Potato.Annu Rev Entomol. 2024 Jan 25;69:139-157. doi: 10.1146/annurev-ento-020123-014734. Epub 2023 Aug 24. Annu Rev Entomol. 2024. PMID: 37616600 Review.
Cited by
-
The functional decline of tomato plants infected by Candidatus Liberbacter solanacearum: an RNA-seq transcriptomic analysis.Front Plant Sci. 2024 Feb 1;15:1325254. doi: 10.3389/fpls.2024.1325254. eCollection 2024. Front Plant Sci. 2024. PMID: 38362455 Free PMC article.
-
An Overview of the Emergence of Plant Pathogen 'Candidatus Liberibacter solanacearum' in Europe.Microorganisms. 2023 Jun 29;11(7):1699. doi: 10.3390/microorganisms11071699. Microorganisms. 2023. PMID: 37512871 Free PMC article. Review.
References
-
- Liefting L, Ward L, Shiller J, Clover G. A new ‘Candidatus Liberibacter’ species in Solanum betaceum (tamarillo) and Physalis peruviana (cape gooseberry) in New Zealand. Plant Dis. 2008;92:1588–1588. - PubMed
-
- Glynn J, Islam M, Bai Y, Lan S, Wen A, Gudmestad N, et al. Multilocus sequence typing of ‘Candidatus Liberibacter solanacearum’ isolates from North America and New Zealand. J Plant Pathol. 2012;94(1):223–228.
-
- Nelson WR, Sengoda VG, Alfaro-Fernandez AO, Font MI, Crosslin JM, Munyaneza JE. A new haplotype of “Candidatus Liberibacter solanacearum” identified in the Mediterranean region. Eur J Plant Pathol. 2013;135:633–639.
-
- Liefting LW, Sutherland PW, Ward LI, Paice KL, Weir BS, Clover GR. A new ‘Candidatus Liberibacter’ species associated with diseases of solanaceous crops. Plant Dis. 2009;93:208–214. - PubMed
MeSH terms
LinkOut - more resources
Full Text Sources
