. 2022 Mar 30;41(1):115.
doi: 10.1186/s13046-022-02328-y.

Mechanical stress shapes the cancer cell response to neddylation inhibition

Affiliations

Mechanical stress shapes the cancer cell response to neddylation inhibition

Frédérique Mittler et al. J Exp Clin Cancer Res. .

Erratum in

Abstract

Background: The inhibition of neddylation by the preclinical drug MLN4924 represents a new strategy to combat cancer. However, despite being effective against hematologic malignancies, its success in solid tumors, where cell-cell and cell-ECM interactions play essential roles, remains elusive.

Methods: Here, we studied the effects of MLN4924 on cell growth, migration and invasion in cultured prostate cancer cells and in disease-relevant prostate tumoroids. Using focused protein profiling, drug and RNAi screening, we analyzed cellular pathways activated by neddylation inhibition.

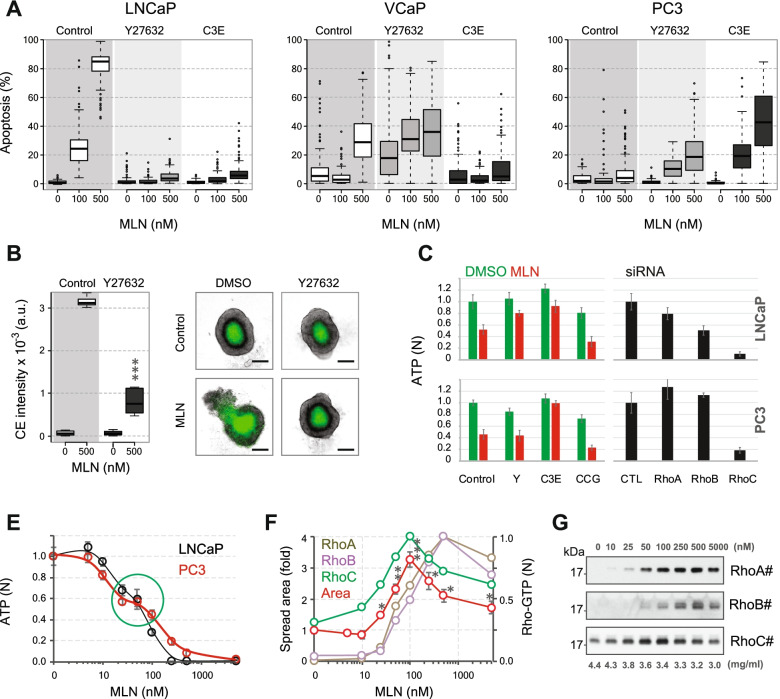
Results: We show that mechanical stress induced by MLN4924 in prostate cancer cells significantly affects the therapeutic outcome. The latter depends on the cell type and involves distinct Rho isoforms. In LNCaP and VCaP cells, the stimulation of RhoA and RhoB by MLN4924 markedly upregulates the level of tight junction proteins at cell-cell contacts, which augments the mechanical strain induced by Rho signaling. This "tight junction stress response" (TJSR) causes the collapse of cell monolayers and a characteristic rupture of cancer spheroids. Notably, TJSR is a major cause of drug-induced apoptosis in these cells. On the other hand, in PC3 cells that underwent partial epithelial-to-mesenchymal transition (EMT), the stimulation of RhoC induces an adverse effect by promoting amoeboid cell scattering and invasion. We identified complementary targets and drugs that allow for the induction of TJSR without stimulating RhoC.

Conclusions: Our finding that MLN4924 acts as a mechanotherapeutic opens new ways to improve the efficacy of neddylation inhibition as an anticancer approach.

Keywords: MLN4924; Mechanical stress; Metastasis; Prostate cancer; Rho GTPases; Tight junctions.


Conflict of interest statement

The authors declare that they have no competing interests.

Figures

Fig. 1
Fig. 1
Neddylation inhibition induces distinct phenotypes in PCa cells. A, B Effect of 100 nM MLN on PCa colony growth in soft agar (“steady”). In the “pulse” regimen, the cells were pretreated with 100 nM MLN for 1 h before seeding (see also Supplementary Figure S1A). The histograms show the colony size distribution of control (black)- and MLN (red)-treated cells. The numbers indicate the total area occupied by the colonies of the given size. Scale bar = 1 mm. C, D Wound healing assay with LNCaP (C) and PC3 (D) cells (mean ± S.D., n = 5 for LNCaP, n = 6 for PC3, ***-p < 0.001). 100 nM MLN was added just before monolayer scratching. Scale bar = 500 µm (E, F) Effect of 100 nM MLN on LNCaP (E) and PC3 (F) tumoroid growth over 10 days. Scale bar = 150 µm. In all experiments with MLNs, DMSO was used as a vehicle control
Fig. 2
Fig. 2
MLN affects distinct sets of membrane proteins in PCa cells. A Effect of MLN on protein expression in PCa cells measured by western blotting. The numbers indicate the fold increase compared to the control. B Western blots show upregulation of TJ proteins in LNCaP and VCaP cells with the corresponding quantification below. C Effect of MLN on ItgB1 and related signaling in PC3 cells. D Cell morphology and expression of Cldn4 and Ocln proteins in LNCaP and VCaP cells treated with 100 nM MLN. Scale bar = 25 µm. E Expression of ItgB1 in PC3 cells treated with 100 nM MLN. Actin-positive protrusions in MLN-treated cells showed no ItgB1 staining compared to the control (white arrows). Scale bar = 25 µm and 10 µm (zooms). F On the left: binding of Cy3-labeled C-CPE to control and 100 nM MLN-treated LNCaP cells analyzed by flow cytometry. The gray trace corresponds to the control cells not exposed to Cy3-C-CPE. In the middle: effect of 200 µg/ml C-CPE on wound closure by control and 100 nM MLN-treated LNCaP cells. The C-CPE conditions are shown in dark gray. On the right: effect of 200 µg/ml C-CPE on spheroid assembly by control and 100 nM MLN-treated VCaP cells. The C-CPE conditions are shown in dark gray. G Effect of 100 nM MLN on PC3 cell morphology measured by automated microscopy. In all experiments, the cells were treated with MLN for 20 h with DMSO as a vehicle control. Statistical significance: *- p < 0.05, **-p < 0.01 and ***-p < 0.001
Fig. 3
Fig. 3
Rho activation by MLN stimulates TJ expression. A Effect of MLN on TJ transcription measured by CLDN4 promoter luciferase reporter and RT–qPCR of CLDN4 and OCLN transcripts in LNCaP cells. B Drug effect on the stimulation of Cldn4 expression by MLN (100 nM in control). Inhibitors of PI3K/AKT kinase are indicated in dark red, those of Roc/Cdc42 are indicated in red, and those of Rho signaling are indicated in blue. C Rho signaling is required for the stimulation of Cldn4 expression by MLN. Conditions: 100 nM MLN, charcoal-stripped serum (CSM), 20 nM staurosporine (Stau), 5 µM MBQ167 (MBQ), 10 µM Y27632, 5–10–20 µg/ml C3E, 10 µM lysophosphatidic acid (LPA), 50 µM calpeptin (CAL), and 1 nM CNFy. D Effect of the drugs (see above) on individual Rho isoforms. The active GTP-bound isoforms are hash-tagged. E The effect of 100 nM MLN on LNCaP cell morphology and VCaP spheroid assembly was reversed by 10 µM Y27632 and 20 µg/ml C3E. Scale bars = 50 µm (LNCaP) and 200 µm (VCaP). F Effect of knocking down Rho isoforms and specific mechanoresponsive transcriptional regulators on the stimulation of Cldn4 expression by 100 nM MLN. G Interaction of ZO1 and YBX3 proteins revealed by western blotting after immunoprecipitation. On the right: Effect of 100 nM MLN on the levels of nuclear ZO1 and YBX3 analyzed by immunofluorescence (histogram) and cell fractionation (western blot). Statistical significance: ***-p < 0.001
Fig. 4
Fig. 4
Rho activation by MLN triggers MAT and tumoroid spreading in PC3 cells. A Activation of Rho isoforms by 100 nM MLN in PC3 cells. The active GTP-bound isoforms are hash-tagged. B Depletion of Rho isoforms in PC3 cells changes cell morphology and affects the cell response to 100 nM MLN. Scale bar = 25 µm. C Quantitative analysis of the effect of Rho isoform knockdown shown in (B). The cell area and length-to-width ratio (LWR) were measured by automated microscopy. Statistical significance: ***-p < 0.001. D Effect of the depletion of Rho isoforms on PC3 tumoroid growth. Scale bar = 200 µm. E Effect of 10 µM Y27632, 20 µg/ml C3E, and 3 µM CCG1423 on PC3 tumoroid growth with or without (control) 100 nM MLN. Scale bar = 200 µm. F Localization of RhoC in control and 100 nM MLN-treated PC3 cells. Scale bar = 25 µm and 10 µm (zooms). In all experiments with MLNs, DMSO was used as a vehicle control
Fig. 5
Fig. 5
Rho signaling defines the therapeutic outcome. A Effect of Rho signaling inhibitors on MLN-induced apoptosis in monolayer cultures of PCa cells. The cells were treated for 1 day with increasing doses of MLN and 10 µM Y27632 or 20 µg/ml C3E. The percentage of apoptotic cells was evaluated by automated fluorescence microscopy using CellEvent™ Caspase-3/7 Green Detection Reagent (CE). For all shown drug vs. control effects: p < 0.001 (B) Effect of 10 µM Y27632 on MLN-induced apoptosis in LNCaP spheroids. The histogram shows the stimulation of apoptosis by MLN in small (< 250 µm) spheroids measured by CE fluorescence. Statistical significance: ***-p < 0.001. On the right: 10 µM Y27632 prevents the mechanical rupture of large (> 400 µm) spheroids induced by 250 nM MLN (the hypoxic apoptotic core of spheroids is stained with CE). Scale bar = 200 µm. C Effect of the inhibition of Rho signaling on LNCaP (top) and PC3 (bottom) tumoroid growth. Color histograms: Preformed tumoroids were treated for 7 days with 10 µM Y27632 (Y), 20 µg/ml C3E, or 3 µM CCG1423 with or without (control) 100 nM MLN. The viability was assessed by measuring ATP with ViaLight™ reagent. Black histograms: Tumoroids were grown from Rho-depleted cells for 10 days and assessed for viability. E Biphasic MLN dose response curves for LNCaP and PC3 tumoroids. The biphasicity is indicated by the green circle. F MLN dose response curves for PC3 tumoroid invasion (measured by tumoroid spread area) and Rho activation. Statistical significance: *- p < 0.05, **-p < 0.01 and ***-p < 0.001. G Dose-dependent Rho stimulation by MLN analyzed by western blot and quantified in Fig. 5F. The active GTP-bound isoforms are hash-tagged
Fig. 6
Fig. 6
TJSR regulators are potential therapeutic targets. A Functional genomic siRNA screen for TJSR regulators in LNCaP cells. The indicated genes were knocked down, and the level of Cldn4 protein was measured by western blot. One hundred nM MLN was used as a reference (MLN100). B Hit validation using four individual siRNAs. Western blots show the depletion of the target proteins and the corresponding Cldn4 level. Double black arrowheads indicate native and neddylated CUL2 protein. Double white arrowheads indicate DCNL4 isoforms. C Effect of hit depletion on actin polymerization in LNCaP cells. Scale bar = 50 µm. The genes were knocked down using SmartPool siRNAs, and the effect on cell morphology was evaluated by automated fluorescence microscopy and quantified (the histogram in the middle). The histogram on the right shows the validation of the UBE2F hit using four individual siRNAs. Statistical significance: *- p < 0.05 and ***-p < 0.001. D General scheme showing distinct outcomes of neddylation inhibition in PCa cells. E Effect of gene knockdown on PC3 and LNCaP tumoroid growth measured with ViaLight™ reagent. The histogram on the right shows the validation of UBE2F and CUL2 hits using four individual siRNAs and comparison with CUL5 in PC3 tumoroids. F Effect of gene knockdown on PC3 tumoroid morphology. Scale bar = 200 µm

References

    1. Eisenhauer EA, Therasse P, Bogaerts J, Schwartz LH, Sargent D, Ford R, et al. New response evaluation criteria in solid tumours: Revised RECIST guideline (version 1.1) Eur J Cancer. 2009;45(2):228–47. - PubMed
    1. Karagiannis GS, Pastoriza JM, Wang Y, Harney AS, Entenberg D, Pignatelli J, et al. Neoadjuvant chemotherapy induces breast cancer metastasis through a TMEM-mediated mechanism. Sci Transl Med. 2017;9(397):eaan0026. - PMC - PubMed
    1. Keklikoglou I, Cianciaruso C, Güç E, Squadrito ML, Spring LM, Tazzyman S, et al. Chemotherapy elicits pro-metastatic extracellular vesicles in breast cancer models. Nat Cell Biol. 2019;21(2):190–202. - PMC - PubMed
    1. Soucy TA, Smith PG, Milhollen MA, Berger AJ, Gavin JM, Adhikari S, et al. An inhibitor of NEDD8-activating enzyme as a new approach to treat cancer. Nature. 2009;458(7239):732–736. - PubMed
    1. Enchev RI, Schulman BA, Peter M. Protein neddylation: beyond cullin–RING ligases. Nat Rev Mol Cell Biol. 2015;16(1):30–44. - PMC - PubMed