. 2022 Mar 30;13(1):1690.
doi: 10.1038/s41467-022-29211-w.

Cyclophilin anaCyp40 regulates photosystem assembly and phycobilisome association in a cyanobacterium

Affiliations

Cyclophilin anaCyp40 regulates photosystem assembly and phycobilisome association in a cyanobacterium

Shivam Yadav et al. Nat Commun. .

Abstract

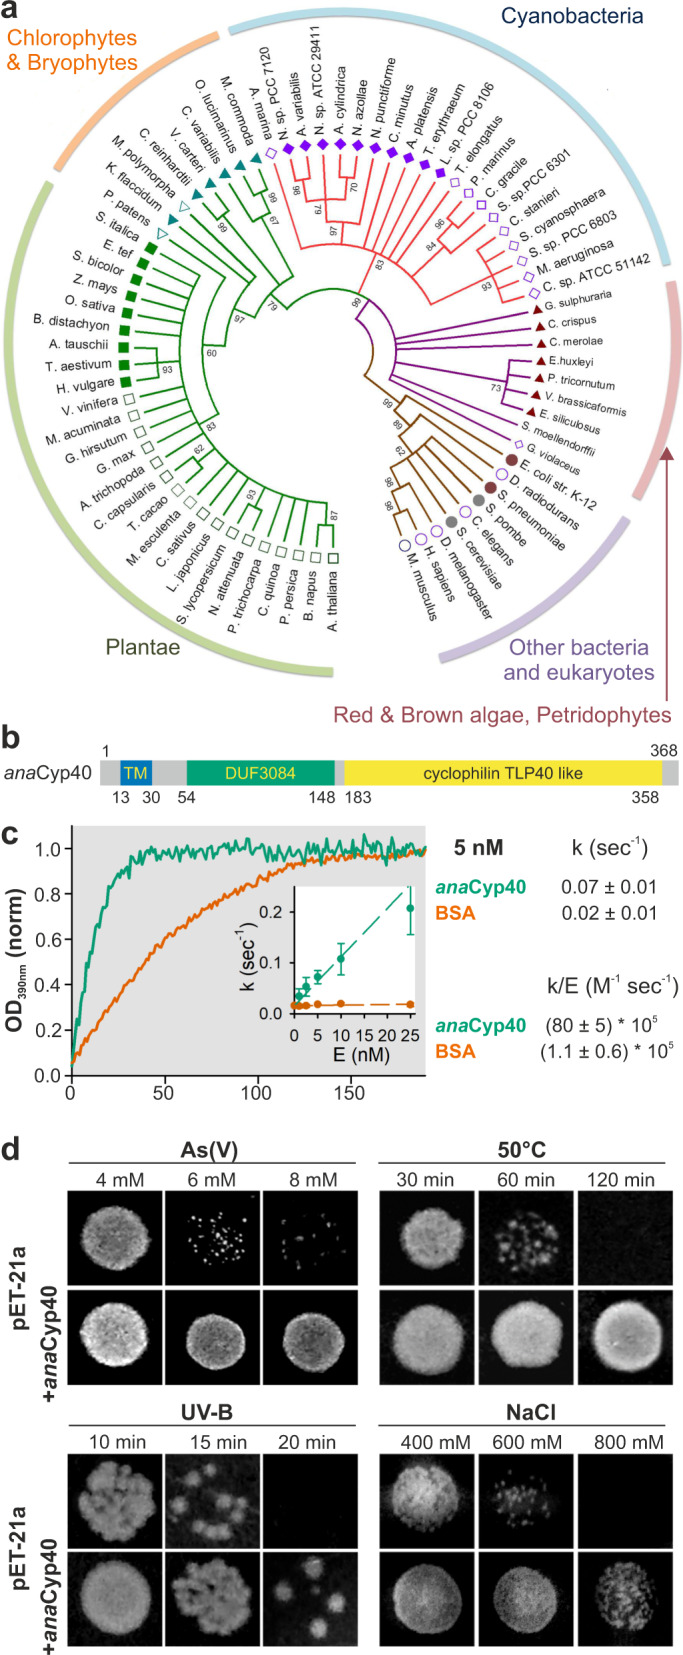
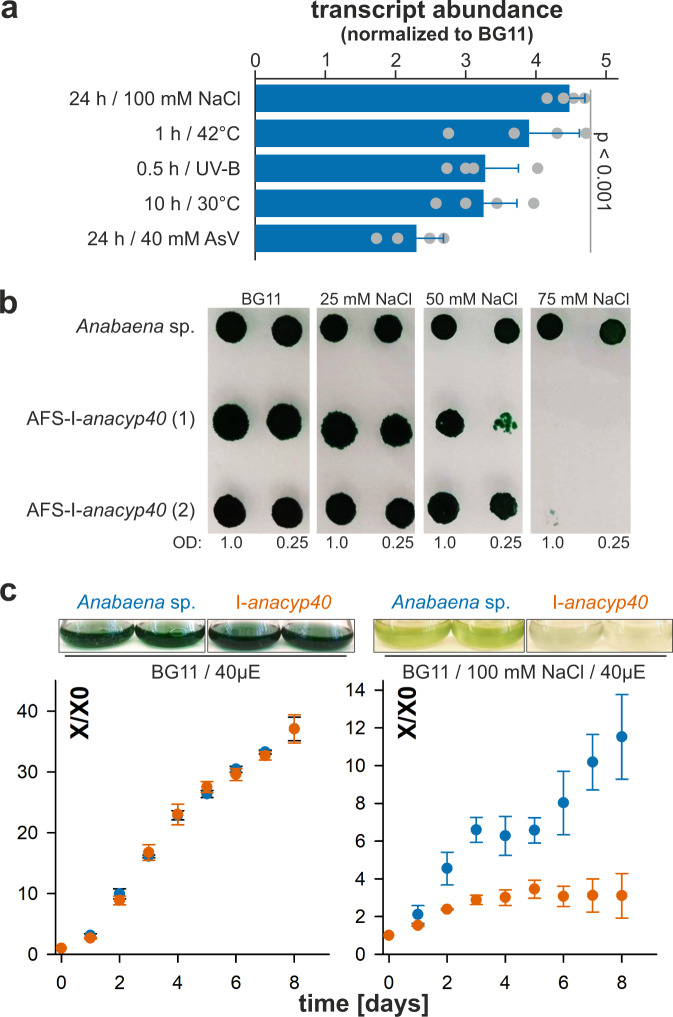
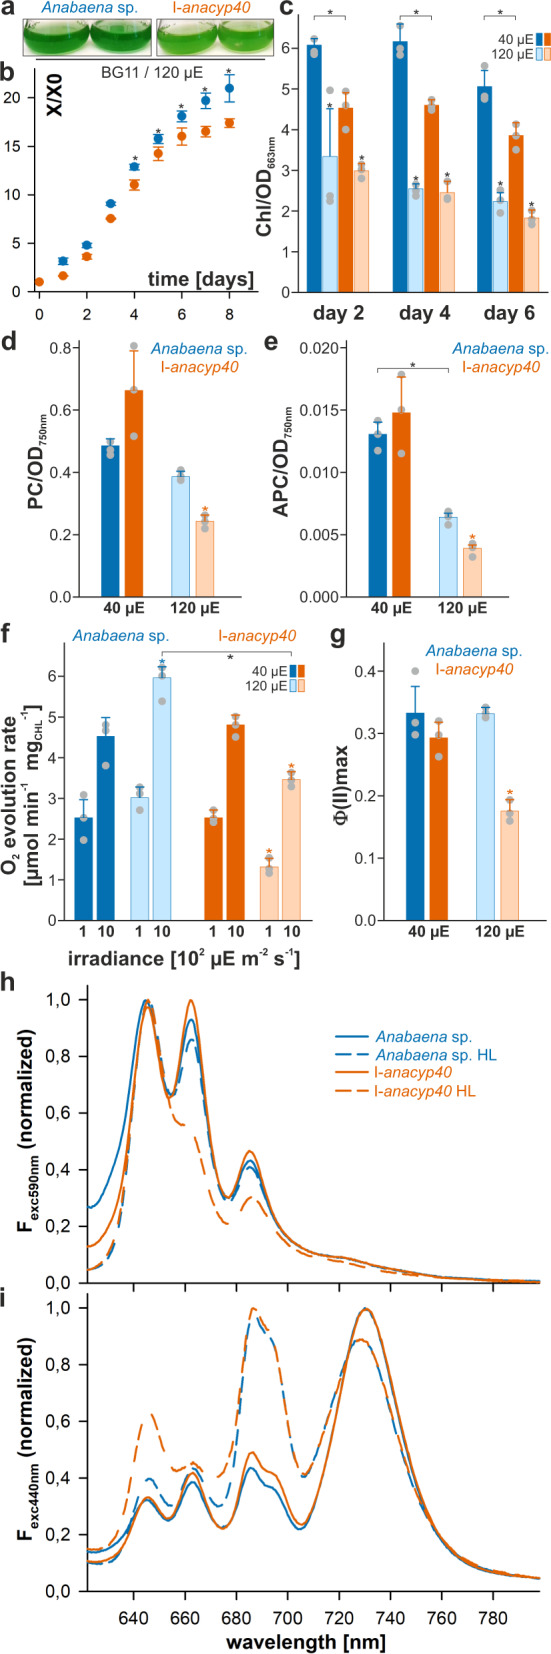
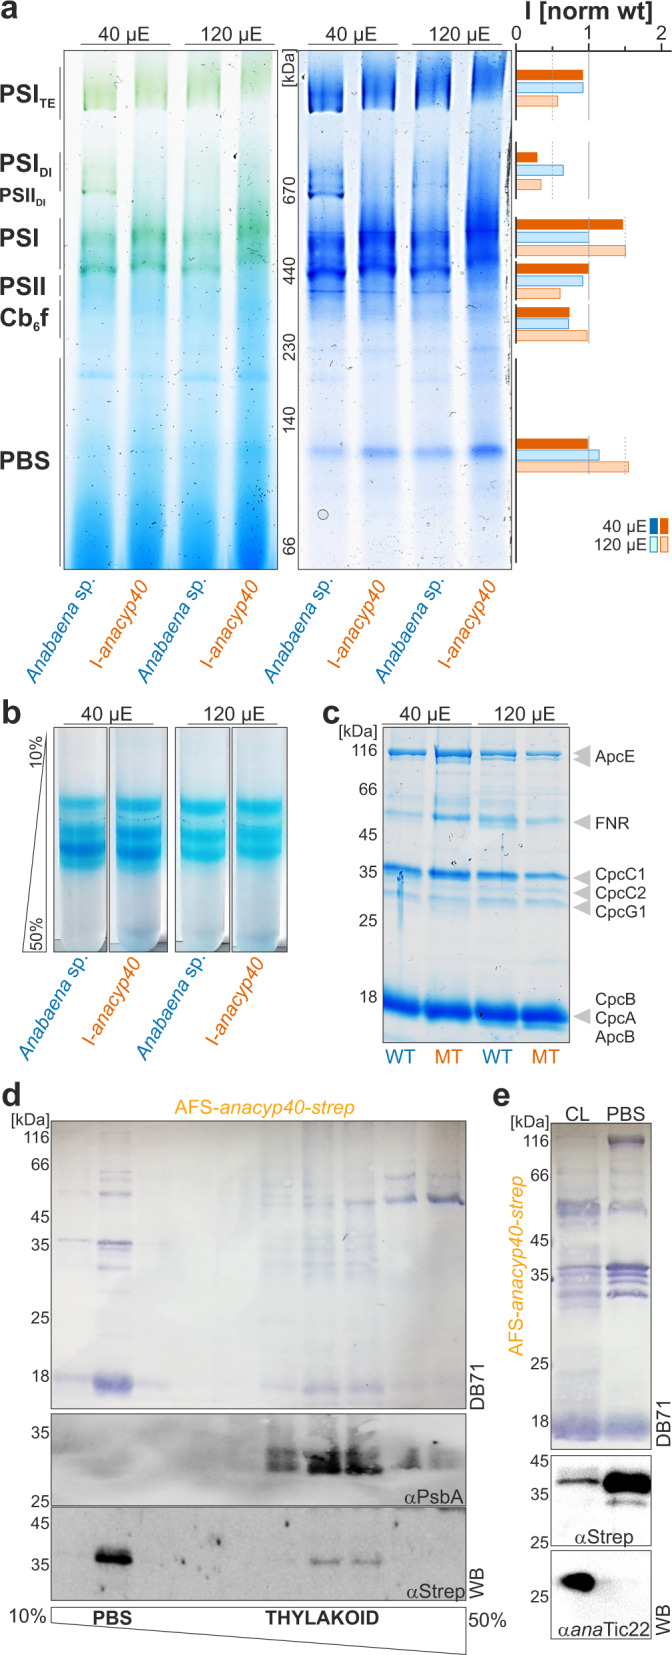
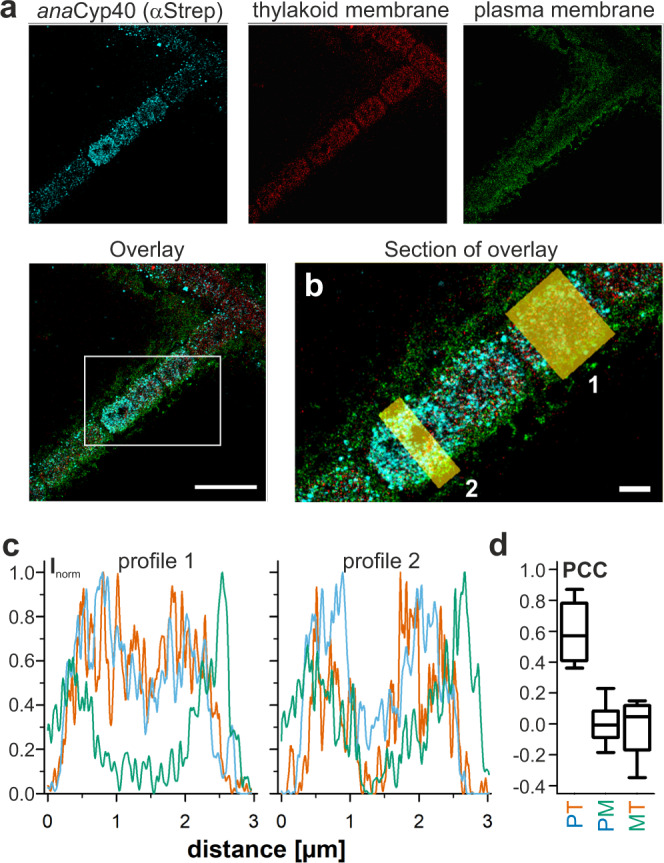
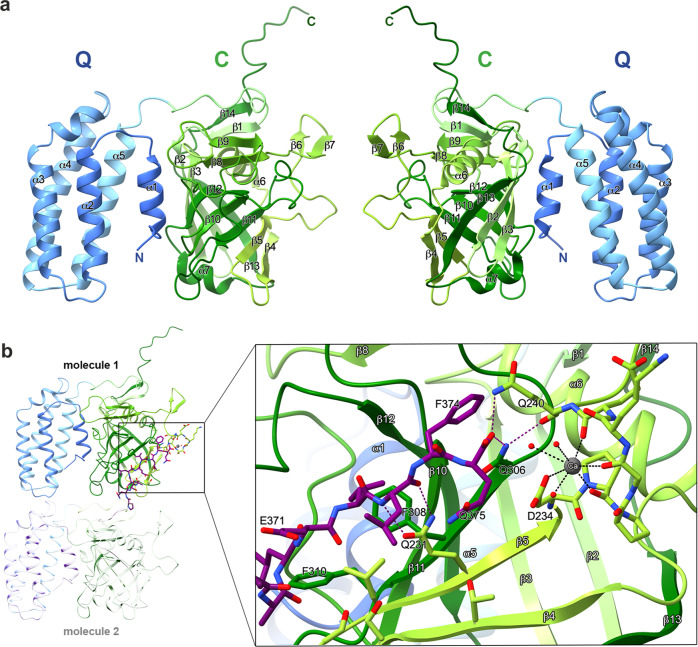
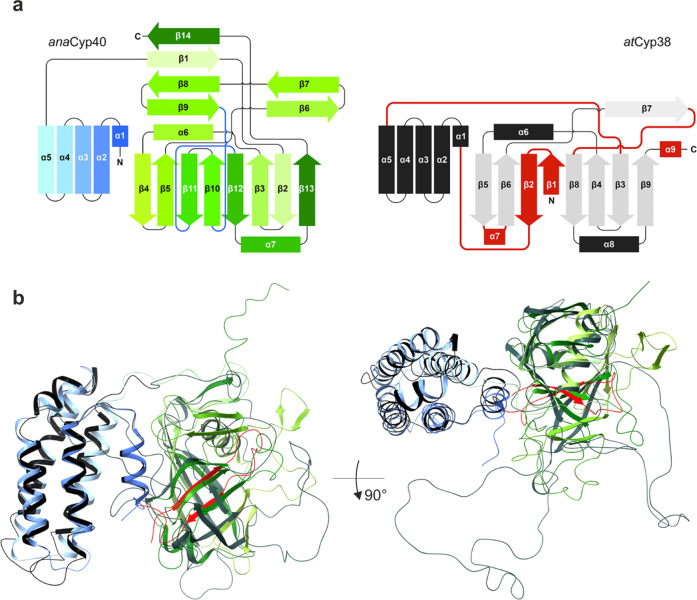
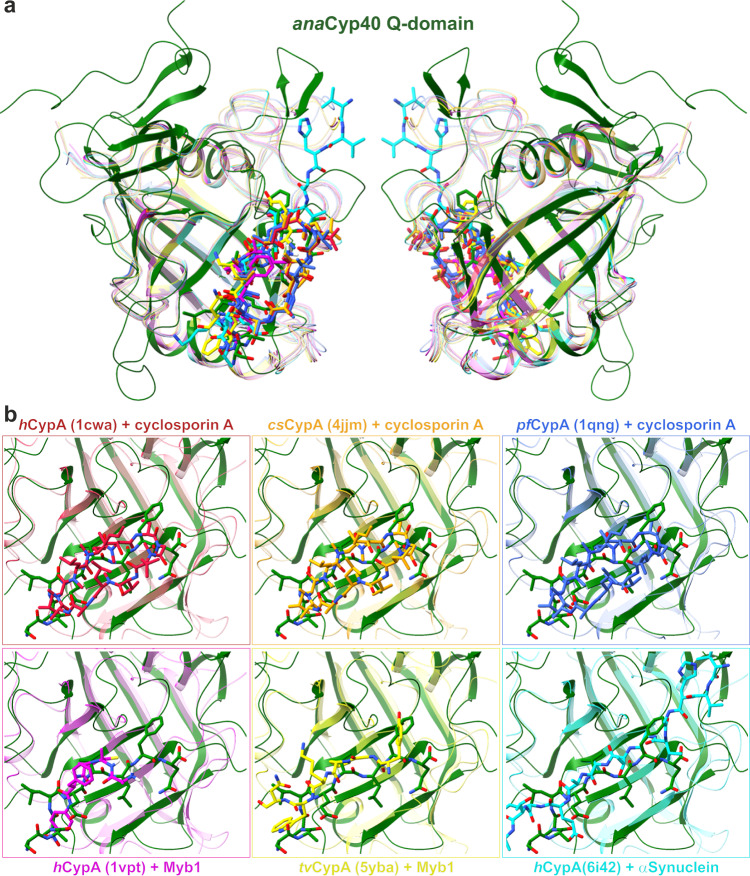
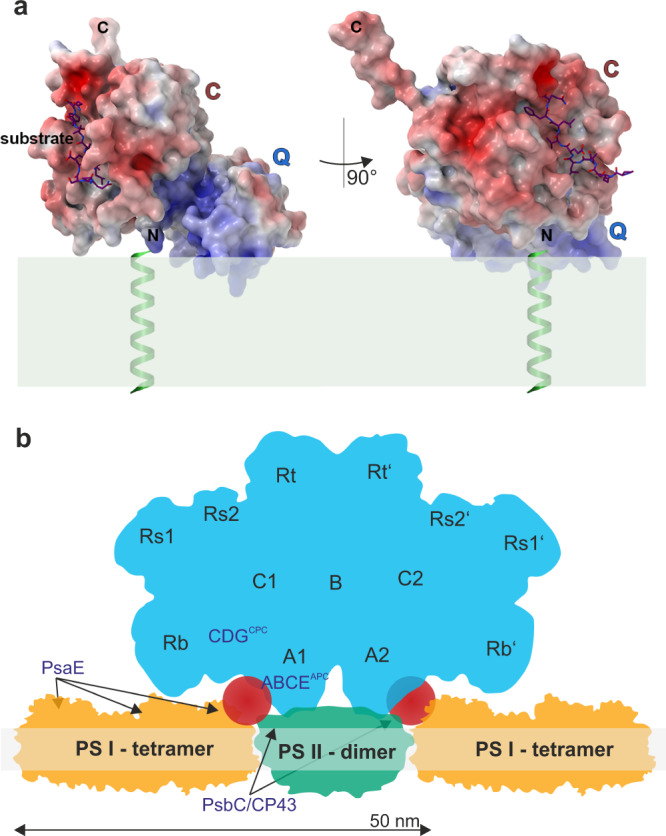
Cyclophilins, or immunophilins, are proteins found in many organisms including bacteria, plants and humans. Most of them display peptidyl-prolyl cis-trans isomerase activity, and play roles as chaperones or in signal transduction. Here, we show that cyclophilin anaCyp40 from the cyanobacterium Anabaena sp. PCC 7120 is enzymatically active, and seems to be involved in general stress responses and in assembly of photosynthetic complexes. The protein is associated with the thylakoid membrane and interacts with phycobilisome and photosystem components. Knockdown of anacyp40 leads to growth defects under high-salt and high-light conditions, and reduced energy transfer from phycobilisomes to photosystems. Elucidation of the anaCyp40 crystal structure at 1.2-Å resolution reveals an N-terminal helical domain with similarity to PsbQ components of plant photosystem II, and a C-terminal cyclophilin domain with a substrate-binding site. The anaCyp40 structure is distinct from that of other multi-domain cyclophilins (such as Arabidopsis thaliana Cyp38), and presents features that are absent in single-domain cyclophilins.


Conflict of interest statement

The authors declare no competing interests.

Figures

Fig. 1
Fig. 1. The protein encoded by alr5059 shows a sequence similarity to atCyp38.
a Shown is the phylogenetic analysis of the sequences of the plant and cyanobacterial cyclophilin family as described in Materials and Methods (Supplementary Table 1). b The predicted domains of anaCyp40 are shown as bar diagram. The conserved domains were extracted from NCBI database (CDD) and additional regions for membrane anchoring or targeting predicted as described (Supplementary Table 2). TM: transmembrane region, DUF: domain of unknown function. c Purified anaCyp40ΔTM-His (5 nM, blue) or BSA (5 nM, red) were incubated with 40 μM N-succinyl-ala-ala-pro-phe-p-nitroanilidine and the catalytic reaction monitored by the increase of absorption at 390 nm. Source data are provided as a Source data file. The values were normalized to the baseline and to the maximum. A representative experiment is shown. The average of the determine rate constant (n > 5 repetitions of the experiment) is presented and the standard deviation is shown as error bar. d E. coli BL21 (DE3) transformed with pET21a (upper panel) or pET21a-anaCyp40 (lower panel) were spotted on agar plates or plates containing the indicated concentrations of arsenic (upper left) or sodium chloride (lower right). Bacteria on normal plates were exposed to 50 °C or to UV-B (2.9 mWm−2 nm−1) for the indicated time. Representative images of growth after 24 h are shown.
Fig. 2
Fig. 2. anaCyp40 is required for salinity stress response.
a Wild-type Anabaena sp. was grown in BG11 and cells were treated as indicated followed by RNA isolation and qRT-PCR analysis with specific oligonucleotides for anaCyp40 (Supplementary Table 4). The mean of the ratio to the mRNA abundance in non-treated cultures is shown and error bars indicate the standard deviation (n = 4). The statistical significance determined by ANOVA (Duncans) of the difference to non-treated cultures is indicated. b Two independently generated AFS-I-anaCyp40 strains and wild-type cells were spotted at two indicated concentrations at BG11 supplemented with indicated concentrations of NaCl. The plates were imaged after 8 days of growth. c Wild-type (blue) and AFS-I-anaCyp40 (orange) were grown in BG11 liquid medium (left) with additional 100 mM NaCl (right). The culture density was imaged after 8 days (top) and the average values and the standard deviation for the growth of three independent cultures normalized to the OD at the start of the analysis are shown (bottom). Source data are provided as a Source data file.
Fig. 3
Fig. 3. anaCyp40 is important for the photosynthetic performance under high-light.
a, b Wild-type (blue) and AFS-I-anaCyp40 (orange) were grown in BG11 liquid medium at 120 µE illumination (right). The culture density was imaged after 8 days (a) and the average values for the growth of three independent cultures normalized to the OD at the start of the analysis are shown (b). c The chlorophyll content in wild-type (blue) and AFS-I-anaCyp40 (orange) cells grown under 40 µE or 120 µE (transparent color) was analyzed and normalized to cell density for three independent experiments. d, e The PC (d) and the APC (e) content in wild-type (blue) and AFS-I-anaCyp40 (orange) cells grown under 40 µE or 120 µE (transparent color) was analyzed and normalized to cell density. The statistical significance was analyzed and p < 0.001 is indicated. f The oxygen evolution rate was determined for wild-type (green) and AFS-I-anaCyp40 (orange) grown in BG11 liquid medium at 40 (dark color) or 120 µE illumination (transparent color). The average values and the standard deviation are shown. Stars indicate statistical significance with p < 0.001. g The photosynthetic parameters were determined by PAM. The Φ(II) for wild-type and mutant culture grown at 40 or 120 µE are shown. The statistical significance of the change was analyzed for same illumination condition and p < 0.001 is indicated. Error bars in bg indicate standard deviation and the bare represents the mean. In bg the statistical significance was analyzed by ANOVA (Duncans) and the star indicates a p < 0.001. h, i The 77 K fluorescence emission spectra of Anabaena sp. wild-type (green) or the insertion mutant of anaCyp40 (I-anaCyp40, orange) grown at normal (solid line) or high-light (dashed line) were recorded by excitation with 590 nm (f) or 440 nm (g). Normalization was done at 800 nm, and the spectra are the average of at least three independent biological replicates. The color and line coding shown in (f). Source data are provided as a Source data file.
Fig. 4
Fig. 4. The impact of anaCyp40 on assembly of photosynthetic complexes.
a Membranes of wild-type (green) and AFS-I-anaCyp40 (orange) grown in BG11 liquid medium at 40 or 120 µE illumination were solubilized and subjected to BN-PAGE. The chlorophyll staining (left) and the Coomassie Blue staining (right) are shown. On the left migration of complexes and between the two images the migration of the molecular weight standards is show. The Coomassie Blue staining was quantified by ImageJ and the intensity of the individual complexes was normalized to the intensity in wild-type grown at 40 µE light intensity. b Phycobilisomes were isolated from cultures grown as in (a) and subjected to a 10–50% sucrose gradient. A representative profile is shown. c Equal amounts of phycobilisomes (5 µg protein) isolated from the strains as in (a) were subjected to SD-PAGE as indicated. The migration of the molecular weight is shown on the right and the proteins are assigned. d The strain AFS-anaCyp40-strep was grown in BG11, cells harvested and solubilized in low concentrated buffer and subjected on top of a 10–50% sucrose gradient. The fractions were subjected to SDS-PAGE followed by Western blotting (DB71-staining shown) and incubation with indicated antibodies. PBS and Thylakoid membrane fractions are indicated. e Cell lysate (CL) and phycobilisomes (PBS) were isolated in buffer with high concentration of phosphate from AFS-anaCyp40-strep and subjected to SDS-PAGE followed by Western blotting (DB71 staining shown) and incubation with indicated antibodies.
Fig. 5
Fig. 5. The intracellular localization of anaCyp40.
a AFS-anaCyp40-strep was grown in BG11 and processed as described in “Methods”. Using three-color super-resolution microscopy, the nanoscale localization of anaCyp40 (left), the thylakoid membrane (second from left) and the plasma membrane (second from right) were visualized (overlay shown on the right, scale bar = 5 µm). b Enlarged section as indicated in (a) with two boxed regions (1, 2) from where intensity profiles were extracted (scale bar = 1 µm). c Intensity profiles for the two regions shown in (b) for anaCyp40 (cyan), the thylakoid membrane (red) and the plasma membrane (green) are shown. d The Pearson correlation coefficient (PCC) was calculated from intensity values for pixels and for anaCyp40 and thylakoid (PT), anaCyp40 and membrane (PM) as well as for the membrane and thylakoid (MT). Values were calculated in 10 individual regions and are shown as box plot (horizontal lines indicate median, box sizes represent the 25th and 75th percentile of all values, whiskers indicate the standard deviation). Source data are provided as a Source data file.
Fig. 6
Fig. 6. Overall structure of anaCyp40.
a Ribbon presentation of anaCyp40 from two orientations related to each other by a 180° vertical rotation. The N-terminal four-helix bundle (Q-domain) is shown in blue and the cyclophilin domain (C-domain) is shown in green colors. The two domains are linked by a flexible loop. The interaction between the domains is mediated by the N-terminal helix (α1). The cyclophilin domain is formed by a distorted β-barrel with eight β-strands (β2–5 and β10–13). The β-barrel is flanked on one side by helix α6 and the remaining β-strands and on the other side by helix α7. The N- and C-termini are indicated. b The intermolecular interactions between two symmetry-related anaCyp40 molecules are shown on the left side. The interaction is mediated by the last seven C-terminal residues shown in purple. The boxed region is magnified on the right side and shows the interactions of the C-terminal peptide with the potential substrate binding site on the outer surface of the β-barrel. The metal at the site within close proximity to the C-terminus of the symmetry-related monomer was interpreted as heptagonal coordinated calcium ion (Ca2+) that obviously is part of the active site of anaCyp40.
Fig. 7
Fig. 7. Topological and structural comparison of anaCyp40 and atCyp38.
a The topological organization of structural elements in anaCyp40 is shown on the left and of atCyp38 (pdb-id: 3rfy) on the right. In anaCyp40 the Q-domain is shown in blue colors and the C domain in red colors. The loop regions interacting with helix α1 are shown as blue lines. β-strands β2- β5 and β10-β13 form the 8-stranded β-barrel. In atCyp38 the structural elements of Q-domain are shown in black and of the C-domain in gray. Strong discrepancies to the topology of anaCyp40 are indicated in red. b The structural comparison of anaCyp40 and atCyp38 from two perspectives shows a very similar organization of the Q domain whereas the similarities in the C-domain are restricted to the β-barrel and the helices surrounding the β-barrel. Compared to the unstructured long loops that connect the helices and β-strands of the β-barrel in atCyp38, the loops in anaCyp40 are shorter and have structural elements like β-hairpins and short β-sheets. Coloring of the structural elements in anaCyp40 is according to Fig. 6. The topological discrepancies are highlighted in red also in the structure of atCyp38.
Fig. 8
Fig. 8. Superimposition of the anaCyp40 C-domain to single-domain cyclophilins.
a The C-domain of anaCyp40 is superimposed to single-domain cyclophilins identified by DALI with an RMSD < 2 Å. Three of the compared domains (1cwa: red; 4jjm: orange; 1qng: blue) have a bound cyclosporin A at the corresponding site of anaCyp40, where the C-terminal peptide from the symmetry-related molecule is bound. The other three remaining domains (1vbt: magenta; 4jjm: orange; 6i42: cyan) have at the same position peptides of different length. b Individual comparison of the substrate binding sites are highlighted.
Fig. 9
Fig. 9. Model of anaCyp40 at the membrane and hypothetical functional models.
a AnaCyp40ΔTM is placed on the membrane (green) in that way that the positively charged surface of the Q-domain interacts with the membrane lipids. In this orientation the N-terminus is close at the membrane, so that the trans membrane helix in the full-length anaCyp40 can be attached to the N-terminus of anaCyp40ΔTM. In this orientation also the substrate binding site is accessible for the substrate of anaCyp40. b The structure of the tetrameric PSI, the dimeric PSII, and the PBS as well as the information on the positioning of the PBS with respect to PSII was used to create a model for the positioning on/in the thylakoid membrane. The different domains of the PBS (black letter) and the positioning of the proteins found to complex with anaCyp40 (purple letter) are indicated. The red circles indicate the maximal dimension of the soluble domain of anaCyp40 that would fit into the cavity in the PBS between PSII and PSI according to the first hypothetical functional model. Note: PBS-PSII-PSI megacomplex formation used here to illustrate a putative function of anaCyp40 is only one mode of complex organization at membranes as current results point toward a flexible arrangement. Hence, reader should keep in mind that this is only one possible ensemble.

Similar articles

Cited by

References

    1. Andrzej G. Peptidylprolyl cis/trans isomerases (immunophilins): biological diversity—targets—functions. Curr. Top. Med. Chem. 2003;3:1315–1347. - PubMed
    1. Schiene-Fischer C. Multidomain peptidyl prolyl cis/trans isomerases. Biochim. Biophys. Acta. 2015;1850:2005–2016. - PubMed
    1. Romano P, Gray J, Horton P, Luan S. Plant immunophilins: functional versatility beyond protein maturation. N. Phytol. 2005;166:753–769. - PubMed
    1. Schreiber SL. Chemistry and biology of the immunophilins and their immunosuppressive ligands. Science. 1991;251:283–287. - PubMed
    1. Stewart DE, Sarkar A, Wampler JE. Occurrence and role of cis peptide bonds in protein structures. J. Mol. Biol. 1990;214:253–260. - PubMed

Publication types

MeSH terms