. 2022 Mar 30;13(1):1702.
doi: 10.1038/s41467-022-28871-y.

Pervasive Transcription-coupled DNA repair in E. coli

Affiliations

Pervasive Transcription-coupled DNA repair in E. coli

Britney Martinez et al. Nat Commun. .

Abstract

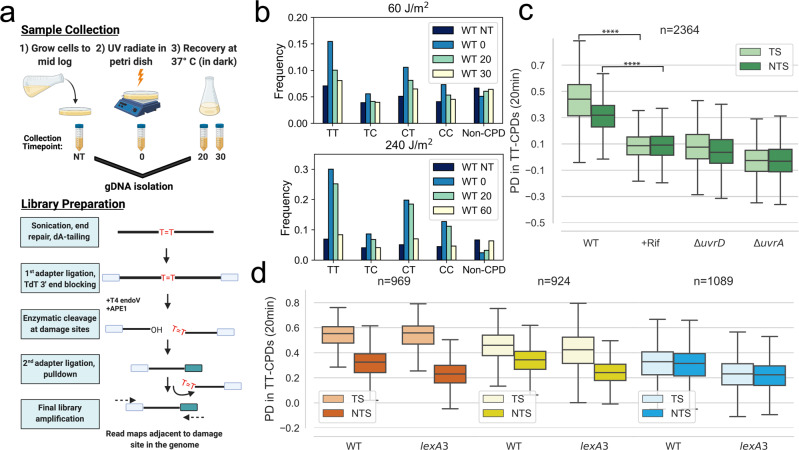
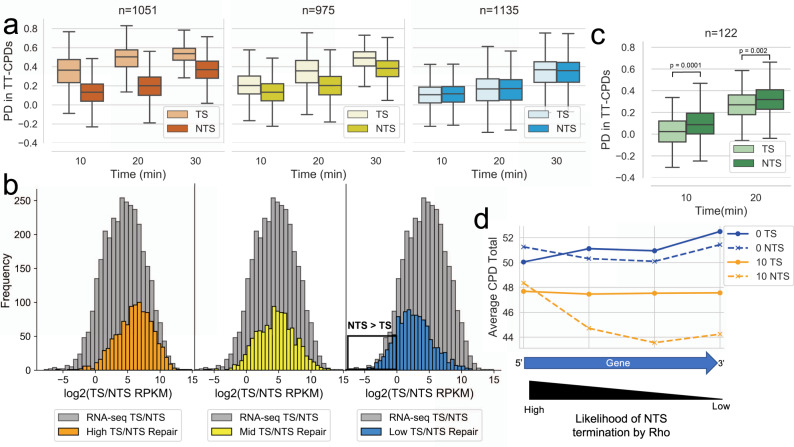
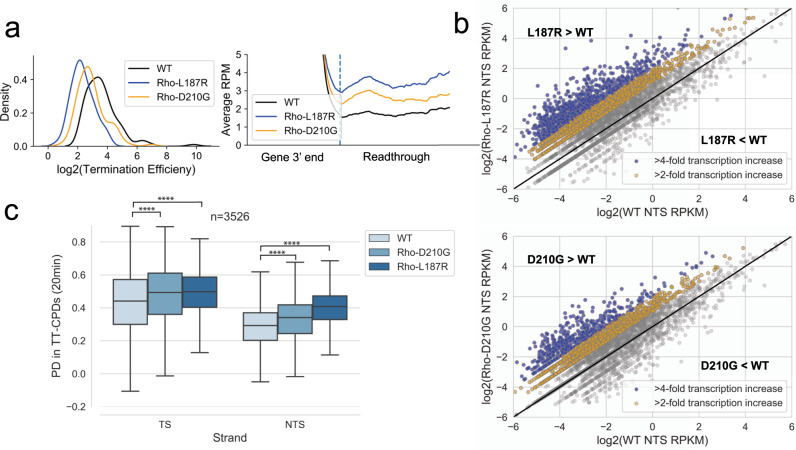
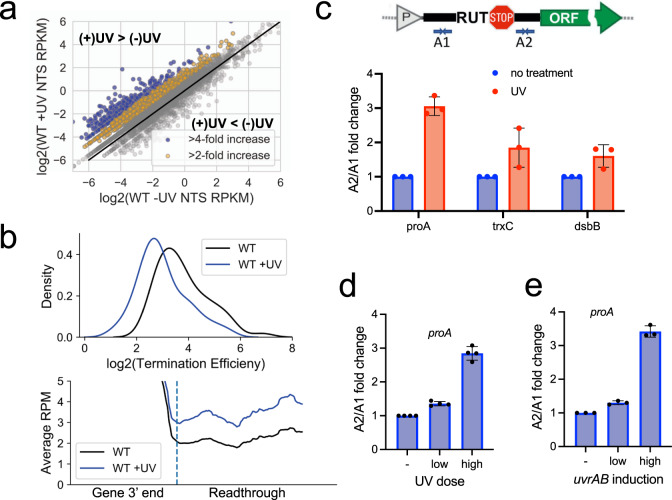
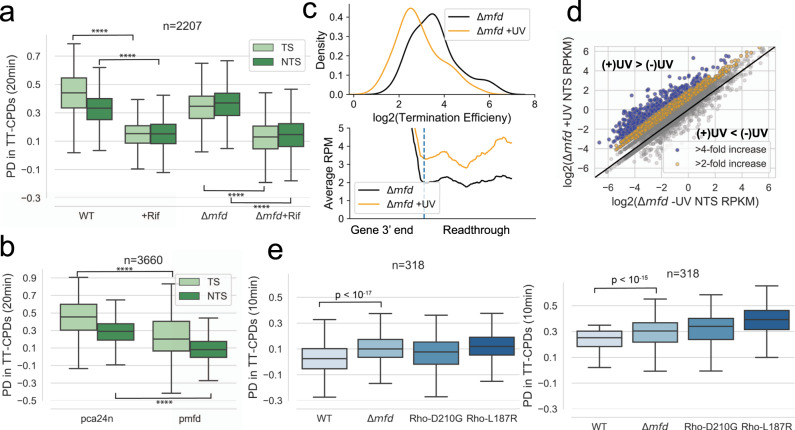
Global Genomic Repair (GGR) and Transcription-Coupled Repair (TCR) have been viewed, respectively, as major and minor sub-pathways of the nucleotide excision repair (NER) process that removes bulky lesions from the genome. Here we applied a next generation sequencing assay, CPD-seq, in E. coli to measure the levels of cyclobutane pyrimidine dimer (CPD) lesions before, during, and after UV-induced genotoxic stress, and, therefore, to determine the rate of genomic recovery by NER at a single nucleotide resolution. We find that active transcription is necessary for the repair of not only the template strand (TS), but also the non-template strand (NTS), and that the bulk of TCR is independent of Mfd - a DNA translocase that is thought to be necessary and sufficient for TCR in bacteria. We further show that repair of both TS and NTS is enhanced by increased readthrough past Rho-dependent terminators. We demonstrate that UV-induced genotoxic stress promotes global antitermination so that TCR is more accessible to the antisense, intergenic, and other low transcribed regions. Overall, our data suggest that GGR and TCR are essentially the same process required for complete repair of the bacterial genome.


Conflict of interest statement

The authors declare no competing interests.

Figures

Fig. 1
Fig. 1. Active transcription is required for the recovery of TS and NTS from CPD-lesions.
a Schematic showing sample preparation and construction of CPD-seq libraries. b The frequency of reads that were adjacent to a potential CPD lesion site (TT, TC, CT, and CC) or a Non-CPD site for each recovery timepoint. Data is shown for a low (60 J/m2) and high (240 J/m2) doses of UV. c The recovery of lesions after 20 min in WT, Rif-treated WT, ΔuvrA and ΔuvrD cells (****p < 10−308). Boxplots show the distribution of the percent decrease in TT-CPDs for each strand in gene bodies that had at least 1.5-fold TT-CPD enrichment at the 0-timepoint over NT-timepoint (see methods, Supplementary Fig. 1). d The recovery of lesions after 20 min in WT and lexA3 mutant cells. Genes were split by transcription level: high = orange, mid = yellow, and low = blue (for details on how genes were split, see Methods). The box shows the interquartile range (IQR), the line shows the median, and the whiskers extend to 1.5xIQR. The top of the box represents the 75th percentile and bottom represents the 25th percentile. n denotes the number of genes in each plot. P-values were calculated using a paired Wilcoxon signed rank test.
Fig. 2
Fig. 2. TCR occurs in sense, antisense, and intergenic regions.
a The recovery of TT-CPD lesions at 10, 20, and 30-min recovery timepoints in WT cells. Genes were split by transcription level based on RNA-seq data: high = orange, mid = yellow, and low = blue (for details on how genes were split, see Methods). b The sense/antisense (TS/NTS) transcription ratio of high (orange), mid (yellow) and low (blue) repair genes. Genes were split into three equal repair levels based on their TS/NTS percent decrease (PD) ratio from CPD-seq data after 20 min of recovery. The grey histogram represents the TS/NTS transcription ratio of all genes. The black box highlights genes with an antisense transcription preference. c The recovery of TT-CPD lesions in genes that have at least a 1.5-fold antisense preference. The box shows the interquartile range (IQR), the line shows the median, and the whiskers extend to 1.5xIQR. The top of the box represents the 75th percentile and bottom represents the 25th percentile. n denotes the number of genes in each plot. P-values were calculated using a paired Wilcoxon signed rank test. d Meta-analysis displaying the TT-CPD total in genes with an antisense transcription preference at their gene end at the 0 min and 10 min timepoint. Each point represents a window encompassing a quarter of the gene.
Fig. 3
Fig. 3. Global antitermination improves genome-wide NER.
a The distribution of the log2 termination efficiency (see Methods) for each Rho-dependent terminator in WT, RhoD210G and RhoL187R strains (left panel). Meta-analysis of the average readthrough past Rho-dependent termination sites in WT, RhoD210G and RhoL187R strains. The dashed line represents the termination site (right panel). b Scatterplots comparing the NTS RPKM (RNA-seq) in WT vs RhoL187R (top) or RhoD210G (bottom) mutants. Genes are colored based on their fold increase in the Rho mutant compared to WT. Blue genes had a greater than 4-fold increase in antisense transcription and yellow genes had a 2-4-fold increase in antisense transcription. c The recovery of TT-CPD lesions in WT, RhoD210G, and RhoL187R strains (****p < 10−77). The box shows the interquartile range (IQR), the line shows the median, and the whiskers extend to 1.5xIQR. The top of the box represents the 75th percentile and bottom represents the 25th percentile. n denotes the number of genes in each plot. P-values were calculated using a paired Wilcoxon signed rank test.
Fig. 4
Fig. 4. UV-induced genotoxic stress increases global antitermination.
a Scatterplot comparing the NTS RPKM (RNA-seq) in WT vs WT + UV (120 J/m2) cells. Genes are colored based on their fold increase after UV exposure compared to without UV. Blue genes had a greater than 4-fold increase in antisense transcription and yellow genes had a 2-4-fold increase in antisense transcription. b The distribution of the log2 termination efficiency (see methods) for each Rho-dependent terminator in WT and WT + UV cells (top). Meta-analysis of the average readthrough past Rho-dependent termination sites in WT and WT + UV cells. The dashed line represents the termination site (bottom). c Schematic showing the location of the qPCR primers A1 and A2 relative to the RUT and termination site (top). The A1/A2 fold-change at three different native Rho terminators after UV exposure (bottom). d The A1/A2 fold change at the proA terminator after exposure to a high or low UV dose. e The A1/A2 fold change at the proA Rho-depended terminator after high or low UvrAB induction. Values are means ± SD from three independent replicates.
Fig. 5
Fig. 5. The role of Mfd in repair.
a The percent decrease in TT-CPDs of the TS and NTS of gene bodies in WT, WT + Rif, Δmfd and Δmfd + Rif. (****p < 10−277). b The percent decrease in TT-CPDs of the TS and NTS of gene bodies in cells overexpressing Mfd. (****p < 10−308). c The distribution of the log2 termination efficiency (see methods) at Rho-dependent terminators in the absence or presence of UV exposure in Δmfd cells (top). Meta-analysis of readthrough (see methods) past Rho-dependent termination sites in the absence or presence of UV exposure in Δmfd cells (bottom). d Scatterplot comparing the NTS RPKM (RNA-seq) in Δmfd vs Δmfd + UV (120 J/m2) cells. Genes are colored based on their fold increase after UV exposure compared to without UV. Blue genes had a greater than 4-fold increase in antisense transcription and yellow genes had a 2-4-fold increase in antisense transcription. e The percent decrease in TT-CPDs of the NTS in gene bodies where Mfd deletion increases NTS transcription. The box shows the interquartile range (IQR), the line shows the median, and the whiskers extend to 1.5xIQR. The top of the box represents the 75th percentile and bottom represents the 25th percentile. n denotes the number of genes in each plot. P-values were calculated using a paired Wilcoxon signed rank test.

Similar articles

Cited by

References

    1. Hanawalt PC, Spivak G. Transcription-coupled DNA repair: two decades of progress and surprises. Nat. Rev. Mol. Cell Biol. 2008;9:958–970. - PubMed
    1. Kisker C, Kuper J, Van Houten B. Prokaryotic nucleotide excision repair. Cold Spring Harb. Perspect. Biol. 2013;5:a012591–a012591. - PMC - PubMed
    1. Hanawalt, P. C. & Haynes, R. H. The repair of DNA. Scientific American216, 36–43 (1967). - PubMed
    1. Orren DK, Sancar A. The (A)BC excinuclease of Escherichia coli has only the UvrB and UvrC subunits in the incision complex. Proc. Natl Acad. Sci. USA. 1989;86:5237–5241. - PMC - PubMed
    1. Van Houten B, Gamper H, Hearst JE, Sancar A. Analysis of sequential steps of nucleotide excision repair in Escherichia coli using synthetic substrates containing single psoralen adducts. J. Biol. Chem. 1988;263:16553–16560. - PubMed

Publication types