. 2022 Mar 30;12(1):5418.
doi: 10.1038/s41598-022-09218-5.

Detection and quantification of infectious severe acute respiratory coronavirus-2 in diverse clinical and environmental samples

Affiliations

Detection and quantification of infectious severe acute respiratory coronavirus-2 in diverse clinical and environmental samples

Yi-Chan Lin et al. Sci Rep. .

Abstract

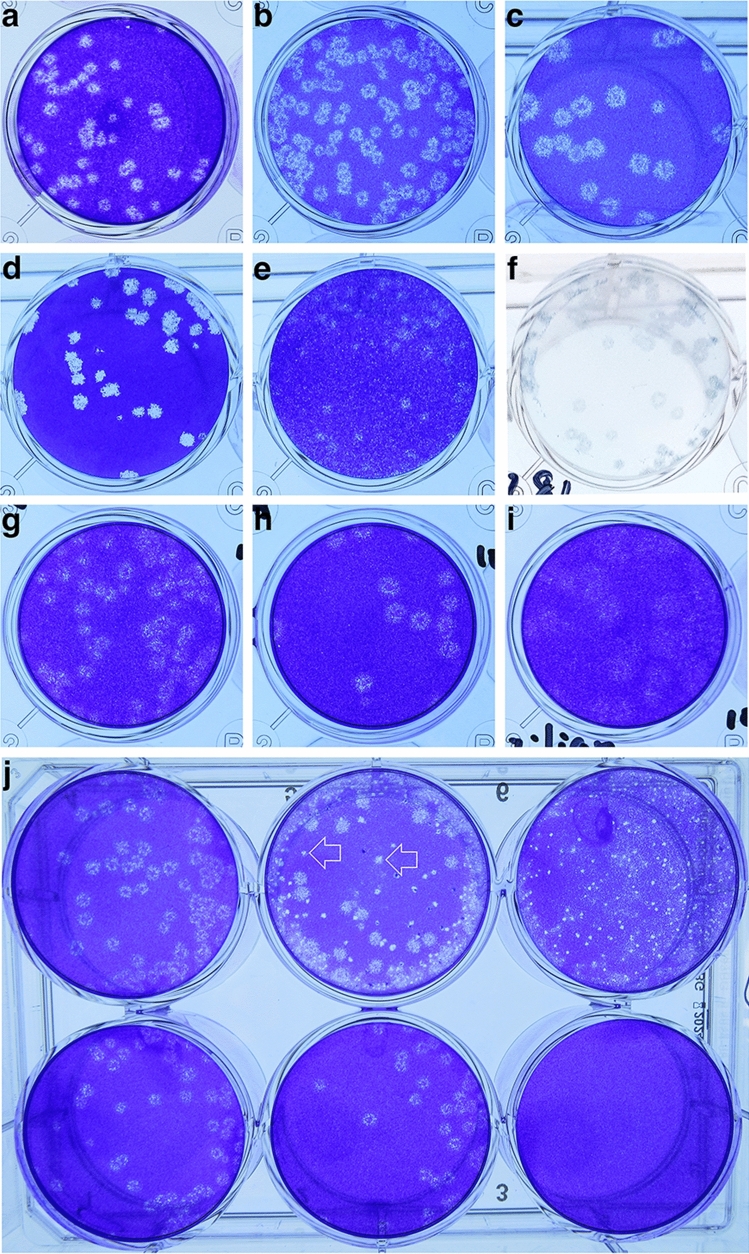
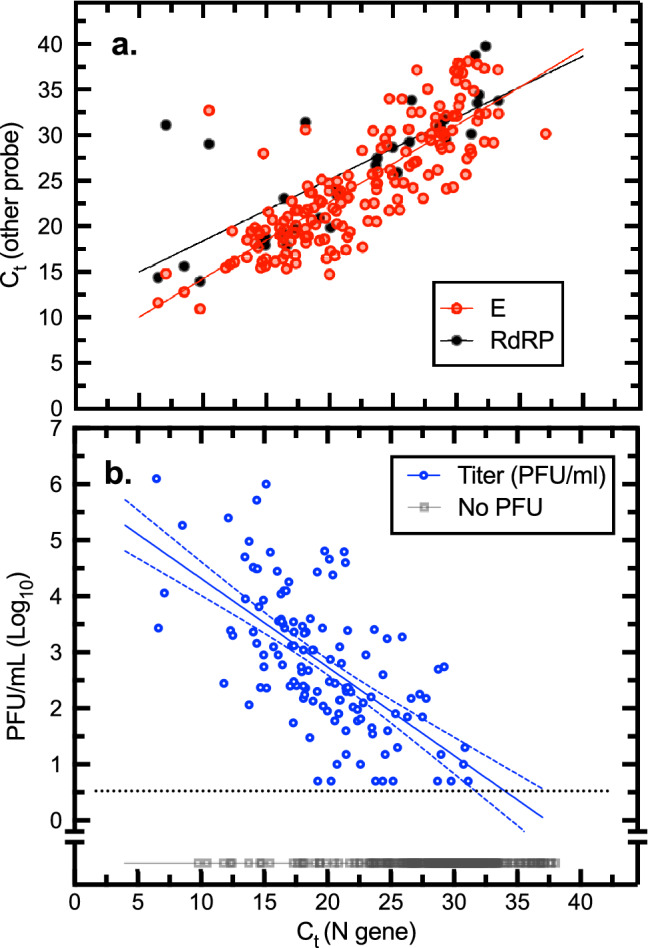
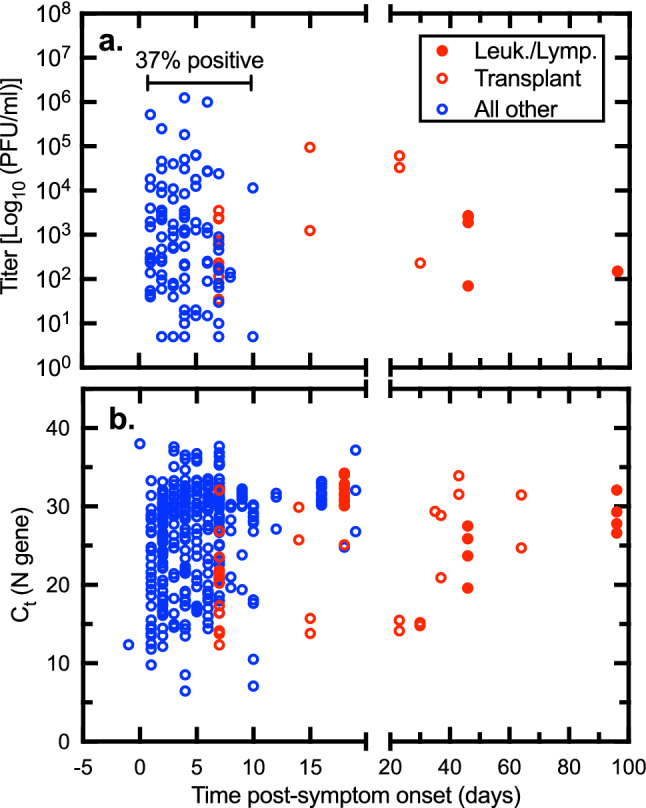
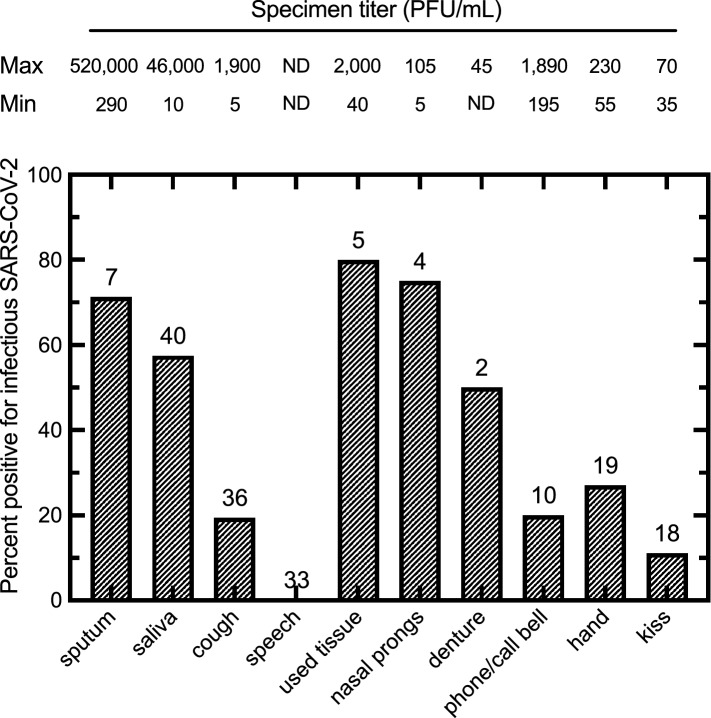
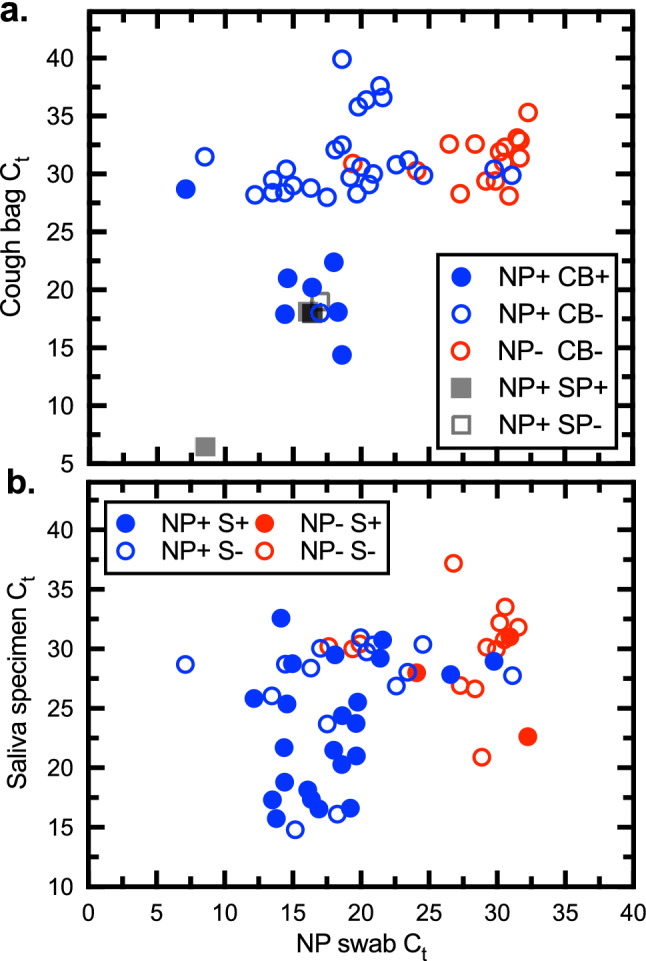
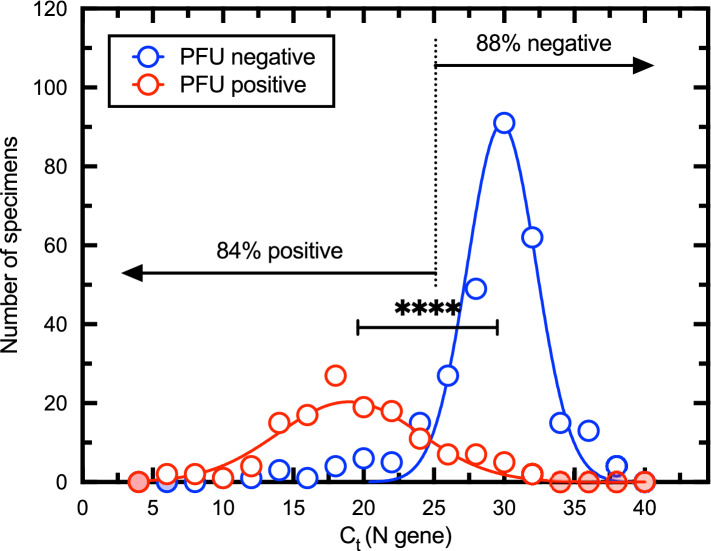
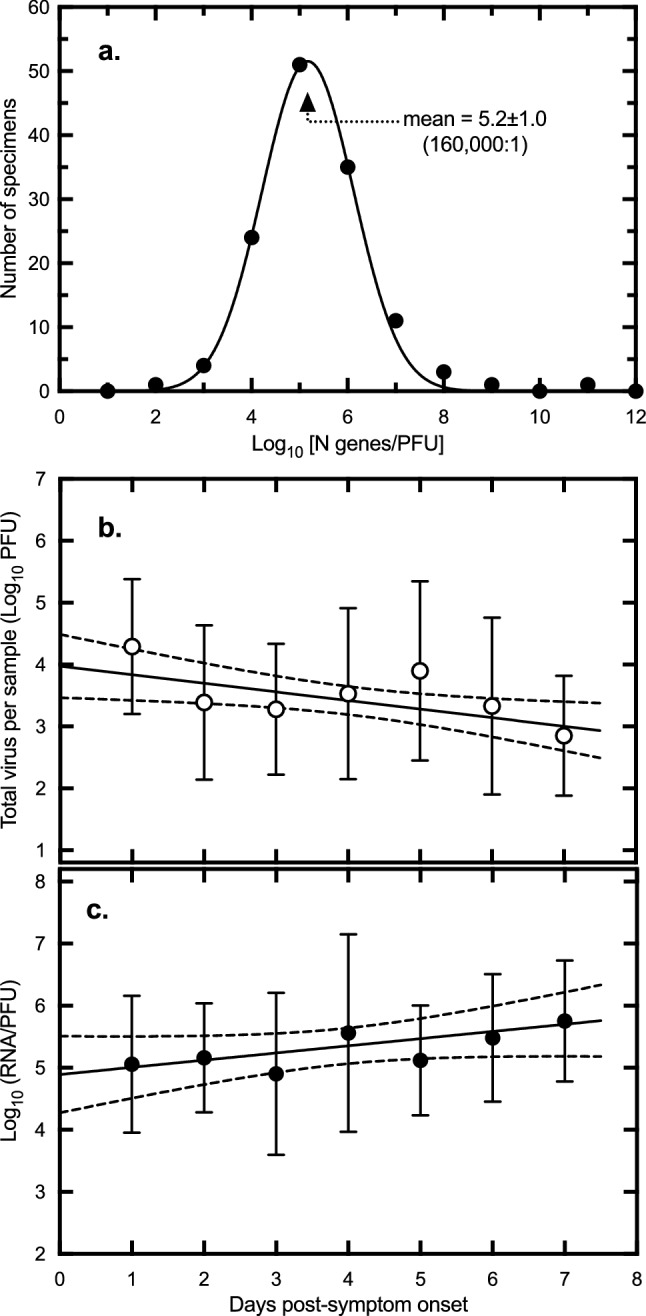
To explore the potential modes of Severe Acute Respiratory Coronavirus-2 (SARS-CoV-2) transmission, we collected 535 diverse clinical and environmental samples from 75 infected hospitalized and community patients. Infectious SARS-CoV-2 with quantitative burdens varying from 5 plaque-forming units/mL (PFU/mL) up to 1.0 × 10⁶ PFU/mL was detected in 151/459 (33%) of the specimens assayed and up to 1.3 × 10⁶ PFU/mL on fomites with confirmation by plaque morphology, PCR, immunohistochemistry, and/or sequencing. Infectious virus in clinical and associated environmental samples correlated with time since symptom onset with no detection after 7-8 days in immunocompetent hosts and with N-gene based Ct values ≤ 25 significantly predictive of yielding plaques in culture. SARS-CoV-2 isolated from patient respiratory tract samples caused illness in a hamster model with a minimum infectious dose of ≤ 14 PFU. Together, our findings offer compelling evidence that large respiratory droplet and contact (direct and indirect i.e., fomites) are important modes of SARS-CoV-2 transmission.


Conflict of interest statement

All authors have completed the ICMJE uniform disclosure form at www.icmje.org/coi_disclosure.pdf and declare: DHE has received grants from World Health Organization, grants from University of Calgary/Alberta Health Services, grants from Canadian Institutes for Health Research, grants from Li Ka Shing Institute of Virology, grants from Natural Sciences and Engineering Research Council of Canada, grants and other from Singletto Inc., during the conduct of the study; grants and personal fees from Tonix Pharmaceuticals, grants from TESER Industries, grants from Canadian Blood Services, outside the submitted work; JMC received funding from Alberta Health Services and grants from the University of Calgary for SARS-CoV-2 research during the conduct of the study and a grant from Pfizer for a Staphylococcus aureus vaccine study for which all funding was provided only to the University of Calgary. JMC also received grants from the WHO for a study using integrated human factors and ethnography approaches to identify and scale innovative IPC guidance implementation supports in primary care with a focus on low-resource settings and using drone aerial systems to deliver medical supplies and PPE to remote First Nations communities during the COVID-19 pandemic, outside the scope of the submitted work and non-financial support from the Centers for Disease Prevention and Control for attendance at a Think Tank Meeting in 2019. JMC is a member and Chair of the WHO Infection Prevention and Control Research and Development Expert Group for COVID-19 and a member of the WHO Health Emergencies Programme (WHE) Ad-hoc COVID-19 IPC Guidance Development Group, both of which provide multidisciplinary advice to the WHO, for which no funding is received and from which no funding recommendations are made for any WHO contracts or grants. JMC is also a member of the Cochrane Acute Respiratory Infections Group; no other relationships or activities that could appear to have influenced the submitted work.

Figures

Figure 1
Figure 1
SARS-CoV-2 plaque morphology. (a–c) Variation in plaque sizes when clinical samples are plated on Vero CCL-81 cells. Note the characteristic halo structure. (d) SARS-CoV-2 plaques on Vero E6/TMPRSS2 cells. (e–f) SARS-CoV-2 plaques on CCL-81 cells stained with crystal violet (e) and immunohistochemical staining with an anti-SARS-CoV-2 spike antibody (f). (g–i) SARS-CoV-2 variants of concern on Vero CCL81 cells (g: Alpha; h: Beta; i: Gamma). j Patient samples passed through 0.2 mm filters to remove bacterial and fungal contamination. Top row: unfiltered samples; Bottom row: filtered samples. Arrows show examples of false plaques caused by growth of bacteria/fungi on the cell monolayers. Figure prepared using Photoshop v23.0 (https://www.adobe.com).
Figure 2
Figure 2
SARS-CoV-2 detection using PCR and plaque assays. (a) Comparison of reverse transcriptase qPCR assays. At the mid-point of the plot, the N gene-based assay generates Ct values that are about two values lower that Ct measured using E or RDRP gene primers. The solid lines were calculated from a linear regression (y = 0.84x + 5.9, goodness of fit r2 = 0.67; y = 0.68 + 11.6, goodness of fit r2 = 0.59) for E and RdRP assays, respectively. (b) Relationships between N gene-based Ct values and virus titer measured as plaque forming units (PFU). The samples exhibited a wide range of virus titers varying from > 106 PFU/mL to the limit of detection (~ 5 PFU/mL). A linear regression fitted to the log10-transformed data is also shown (y =  − 0.16x + 5.9; r2 = 0.41) along with the 95% confidence intervals. Specimens bearing no detectable infectious SARS-CoV-2 virus are also plotted for purposes of comparison (black squares). Most of the specimens (97%) were titered on Vero CCL-81 cells. Figure prepared using Prism v9.3 (https://www.graphpad.com).
Figure 3
Figure 3
Impact of sample timing on SARS-CoV-2 virus detection. The time post-onset was calculated from interviews and/or chart review. (a) Virus titer where it could be detected. (b) All the Ct measurements acquired over the study. In most cases, the capacity to detect virus drops off precipitously about a week after case onset (blue data points). However, both RNA (lower panel) and PFU (upper panel) are detected for many days or weeks later where the patient is immunocompromised (red data points). Figure prepared using Prism v9.3 (https://www.graphpad.com).
Figure 4
Figure 4
Percentage of clinical and environmental samples positive for infectious SARS-CoV-2 from patients with positive NP or TS by infectious titer. The number of samples acquired in each category are indicated above each bar, along with the minimum and maximum infectious titer (PFU/mL) observed for each sample along the top of the figure. Not all sample types were collected from every patient. Sputum indicates productive cough samples. ND = None detected. Figure prepared using Prism v9.3 (https://www.graphpad.com).
Figure 5
Figure 5
Stability of SARS-CoV-2. (a) Saliva from a COVID-19 patient, or saliva mixed with DMEM + serum, were left in open Petri dishes in a patient care room. Image showing the effects of leaving a saliva sample (dish 1), or saliva mixed with DMEM + serum (dish 2) for 2 h. The saliva specimen dried completely. (b) Effect of standing time and drying on virus titers. The two control samples (blue bars) were stored on ice in closed tubes during the two-hour experiment. (c) Representative patient-contacted surfaces were acquired from the patient care setting and transferred for testing without further treatment beyond everyday maintenance and cleaning. Some were partly disassembled to facilitate safe handling and access. An endotracheal tube sample, containing 1 × 106 PFU/mL SARS-CoV-2 diluted in DMEM, was applied in three 10 µL volumes to each item and either retrieved immediately, or stored in a biocontainment hood for the indicated times before recovery and plaque assay. The figure shows a linear regression applied to the log10-transformed plaque counts. The half-lives were separately calculated from a non-linear fit to the untransformed data (not shown) and ranged from 3 min (digital device cover) to 82 min (keyboard). Figure assembled using Illustrator v26.0 (https://www.adobe.com) and Prism v9.3 (https://www.graphpad.com).
Figure 6
Figure 6
Infectious SARS-CoV-2 in saliva, sputum, and cough specimens. (a) Virus samples were acquired from NP swabs as well as cough bag samples (CB), sputum (SP), or saliva (S). Samples determined to contain infectious virus are indicated with solid-colour coding. (b) Virus samples were acquired from NP swabs as well as saliva. A Ct ≤ 25 in the NP swab predicts that about 1/3–1/2 of the cough/sputum and saliva specimens will also bear infectious virus, respectively. Figure prepared using Prism v9.3 (https://www.graphpad.com).
Figure 7
Figure 7
Relationship between Ct and positive plaque assays. The specimens were divided into plaque-positive, and plaque-negative categories and the distribution of Ct values calculated using bin steps of two. A non-linear fit of two Gaussian curves to these data is also shown. A sample with a Ct ≤ 25 is 84% likely to bear infectious material while samples with Ct > 25 are 88% negative. An unpaired t-test, using Welch’s correction for unequal variances and sample sizes, indicates that the two means (19.6 ± 5.1 SD versus 29.2 ± 4.2 SD) are significantly different (two-tailed P < 0.0001). Red or blue filled shading indicates that the binning process counted no specimens in these bins. Figure prepared using Prism v9.3 (https://www.graphpad.com).
Figure 8
Figure 8
Relationship between viral RNA quantity, PFU, and sample timing. (a) The ratio of RNA to PFU was calculated using the virus titer plus a determination of the number of N-gene copies across all of the specimens. The ratios were log10 transformed and the distribution calculated across bin steps of one log10. A non-linear fit of a Gaussian curve to these data is also shown, centered on a mean of 5.2 ± 1.0 SD. This represents 105.2 = 160,000 RNA copies per PFU. (b) The total quantity of virus in each infectious specimen was calculated using the titer (PFU/mL) and the known collection volumes (i.e., specimen + carrier/diluent). These values were then averaged across all of the samples for each of the indicated days. The plot shows a linear regression fitted to the log10-transformed data along with the 95% confidence intervals (y =  − 0.14x + 4.0, goodness of fit r2 = 0.05). The negative slope is significantly non-zero (P = 0.015, F-test). Error bars represent standard deviation. The average virus load declined about tenfold over the course of a week beginning at ~ 104.0 PFU/mL on a hypothetical day zero. (c) The relative infectivity was calculated using the virus titer (PFU/mL) and specific quantity of virus RNA/mL in each sample. The plot shows a linear regression fitted to the log10-transformed data along with the 95% confidence intervals (y = 0.12x + 4.9; goodness of fit r2 = 0.04). The positive slope is significantly non-zero (P = 0.032, F-test). Error bars represent standard deviation. The ratio of RNA/PFU increased about eightfold over the same seven days, starting at ~ 104.9 RNA/PFU on day zero. Figure prepared using Prism v9.3 (https://www.graphpad.com).
Figure 9
Figure 9
Virulence testing in Syrian hamsters. Two of the virus specimens (56B and 72B) were plaque purified and expanded to higher titers with one passage. The two stocks were then used to inoculate four groups of hamsters (4 per group) with the indicated doses of virus. Four control animals were also inoculated by the same intranasal route, with an equal volume (100 µL total) of serum-free media. (a) Shows the weight change relative to the starting weight for the animals in each of the five groups. Error bars represent standard error of the mean. A nasal swab was collected from each animal on days 1, 3 and 6, post-inoculation, and assayed for virus by plaque assay and virus RNA by qPCR (b and c). Both virus specimens produced weight loss and high titers of intranasal virus were detected at days 1 and 3 post-infection. Characteristically the lower doses (14 PFU for 56B and 30 PFU for 72B) yielded the most virus on day 3 post-infection, whereas the higher doses induced the highest levels of infection immediately after challenge, on day 1. The RNA is more persistent than virus, and it could still be detected 6 days post-infection in all of the infected animals, whereas no virus could be detected at this date. The animals were euthanized at day 14. The dashed lines show the limits of virus and RNA detection (LOD) in nasal swabs. Figure prepared using Prism v9.3 (https://www.graphpad.com).

References

    1. Dhama K, et al. Coronavirus disease 2019-COVID-19. Clin. Microbiol. Rev. 2020;33:e00028–e120. - PMC - PubMed
    1. Centers for Disease Control and Prevention. Public health activity guidance. Centers for Disease Control and Preventionhttps://www.cdc.gov/coronavirus/2019-ncov/hcp/non-covid-19-client-intera... (2020).
    1. World Health Organization. Prevention, identification and management of health worker infection in the context of COVID-19: interim guidance. WHO Document Number: WHO/2019-nCoV/HW_infection/2020 (2020).
    1. World Health Organization. Infection prevention and control of epidemic- and pandemic-prone acute respiratory infections in health care (2014). - PubMed
    1. Port JR, et al. SARS-CoV-2 disease severity and transmission efficiency is increased for airborne compared to fomite exposure in Syrian hamsters. Nat. Commun. 2021;12:4985. - PMC - PubMed

Publication types

Grants and funding