. 2022 Mar 30;12(1):5398.
doi: 10.1038/s41598-022-09348-w.

Comparison of MRI T1, T2, and T2* mapping with histology for assessment of intervertebral disc degeneration in an ovine model

Affiliations

Comparison of MRI T1, T2, and T2* mapping with histology for assessment of intervertebral disc degeneration in an ovine model

Nora Bouhsina et al. Sci Rep. .

Abstract

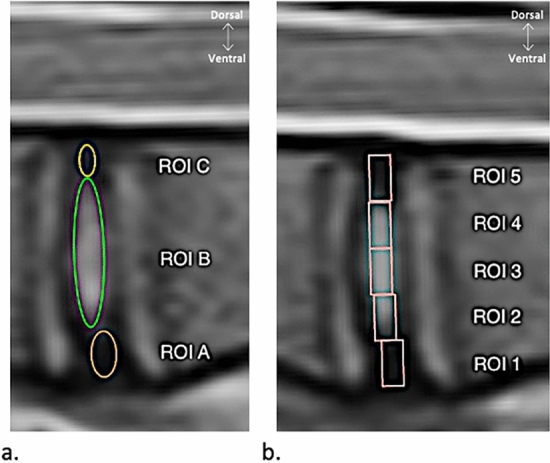
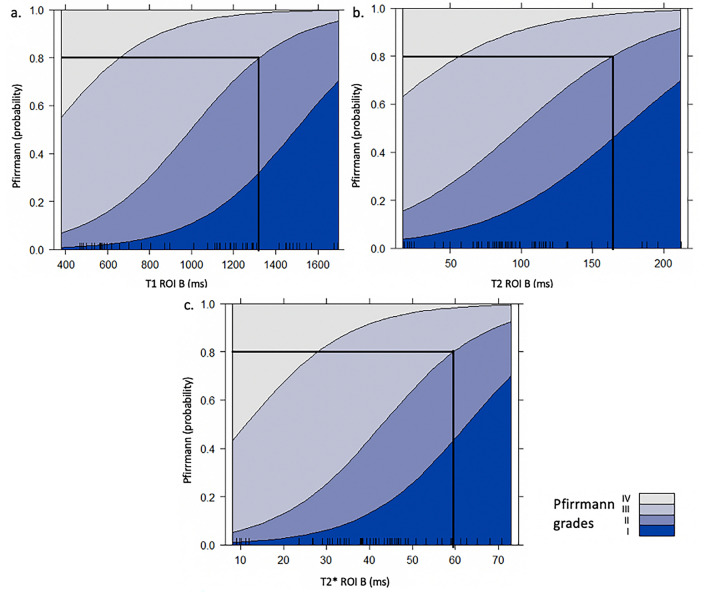
An easy, reliable, and time-efficient standardized approach for assessing lumbar intervertebral disc (IVD) degeneration with relaxation times measurements in pre-clinical and clinical studies is lacking. This prospective study aims to determine the most appropriate method for lumbar IVD degeneration (IDD) assessment in sheep by comparing three quantitative MRI sequences (variable-flip-angle T1 mapping, and multi-echo T2 and T2* mapping), correlating them with Pfirrmann grading and histology. Strong intra- and interrater agreements were found for Nucleus pulposus (NP) regions-of-interest (ROI). T1, T2, and T2* mapping correlated with Pfirrmann grading and histological scoring (p < 0.05) except for the most ventral rectangular ROI on T2 maps. Correlations were excellent for all of the T1 ROIs and the T2* NP ROIs. Highly significant differences in T1 values were found between all Pfirrmann grades except between grades I/II and between grades III/IV. Significant differences were identified in the T2 and the T2* values between all grades except between grades I/III. T1, T2, and T2* relaxation times measurements of the NP are an accurate and time-efficient tool to assess lumbar IDD in sheep. Variable-flip-angle T1 mapping may be further considered as a valuable method to investigate IDD and to assess the efficacy of regenerative treatments in longitudinal studies.


Conflict of interest statement

The authors declare no competing interests.

Figures

Figure 1
Figure 1
The region-of-interest (ROI) drawing methods used to delimitate the different areas of ovine lumbar discs on mid-sagittal conventional T2-weighted MRI sequences. (a) 3-ROIs oval method with ROI A corresponding to the ventral Annulus fibrosus (AF), ROI B to the Nucleus Pulposus (NP), and ROI C to the dorsal AF. (b) 5-ROIs equal-oblong method with ROI 1 corresponding to the ventral AF, ROI 2 to the junction between the ventral AF and the NP, ROI 3 to the NP, ROI 4 to the junction between the NP and the dorsal AF, and ROI 5 to the dorsal AF.
Figure 2
Figure 2
Mid-sagittal T2-weighted sequences and corresponding T1, T2, and T2* maps of lumbar ovine intervertebral discs with different Pfirrmann grades. Each pixel represents the quantitative relaxation time of T1, T2, or T2*. Pfirrmann grade I is identified by a homogeneous section that is isointense to the cerebrospinal fluid representing the Nucleus pulposus (NP), with a clear distinction between this structure and the Annulus fibrosus (AF). On the map images, the NP has a high relaxation time value, represented in red images on the color maps, while the AF, which is less hydrated, has low green relaxation time values. As the degenerative process involves a loss of the macromolecular structure of the disc and a decrease in its water content, the relaxation times in the NP and the AF decline. Pfirrmann grade IV is identified by an inhomogeneous central section, hypointense to the cerebrospinal fluid, with a loss of distinction between the NP and the AF and low relaxation time values in the AF and the degenerated NP, for which the pixels appear blue or green on the color maps.
Figure 3
Figure 3
T1 relaxation time values in the Nucleus pulposus (NP) of ovine intervertebral discs according to the modified Boos’ score and the Pfirrmann grade. The mean T1 relaxation time of the NP was measured by regions-of-interest (ROIs) that included the NP or a part of the NP of each lumbar ovine disc on the sagittal T2-weighted image and by copying this ROI onto the corresponding T1 mapping image. Equal-oblong ROIs delimitated (a) the junction between the NP and the ventral Annulus fibrosus (AF) (T1 ROI 2), (b) the NP (T1 ROI 3), and (c) the junction between the NP and the dorsal AF (T1 ROI 4). (d) A manually drawn oval delineated the NP (T1 ROI B). The modified Boos’ scoring was negatively correlated with the NP values measured for ROIs 2, 3, 4, and B on the T1 mapping images (p < 0.001).
Figure 4
Figure 4
T2 relaxation time values in the Nucleus pulposus (NP) of ovine intervertebral discs according to the modified Boos’ score and the Pfirrmann grade. The mean T2 relaxation time of the NP was measured by regions-of-interest (ROIs) that included the NP or a part of the NP of each lumbar ovine disc on the sagittal T2-weighted image and by copying this ROI onto the corresponding T2 mapping image. Equal-oblong ROIs delimitated (a) the junction between the NP and the ventral Annulus fibrosus (AF) (T2 ROI 2), (b) the NP (T2 ROI 3), and (c) the junction between the NP and the dorsal AF (T2 ROI 4). (d) A manually drawn oval delineated the NP (T2 ROI B). The modified Boos’ scoring was negatively correlated with the NP values measured for ROIs 2, 3, 4, and B on the T2 mapping images (p < 0.001).
Figure 5
Figure 5
T2* relaxation time values in the Nucleus pulposus (NP) of ovine intervertebral discs according to the modified Boos’ score and the Pfirrmann grade. The mean T2* relaxation time of the NP was measured by regions-of-interest (ROIs) that included the NP or a part of the NP of each lumbar ovine disc on the sagittal T2-weighted image and by copying this ROI onto the corresponding T2* mapping image. Equal-oblong ROIs delimitated (a) the junction between the NP and the ventral Annulus fibrosus (AF) (T2* ROI 2), (b) the NP (T2* ROI 3), and (c) the junction between the NP and the dorsal AF (T2* ROI 4). (d) A manually drawn oval delineated the NP (T2* ROI B). The modified Boos’ scoring was negatively correlated with the NP values measured for ROIs 2, 3, 4, and B on the T2* mapping images (p < 0.001).
Figure 6
Figure 6
Pfirrmann score probabilities for the manually drawn region-of-interest (ROI) that delimitates the Nucleus pulposus (NP) designated ROI B on the MR quantitative (a) T1, (b) T2, and (c) T2* mapping sequences. (a) If the T1 ROI B relaxation time value exceeds 1,320 ms, the probability of the NP being scored a Pfirrmann grade I or II is over 0.8. (b) If the T2 ROI B relaxation time value exceeds 164 ms, the probability of the NP being scored a Pfirrmann grade I or II is over 0.8. (c) If the T2* ROI B relaxation time value exceeds 59 ms, the probability of the NP being scored a Pfirrmann grade I or II is over 0.8.

Similar articles

Cited by

References

    1. Andersson GBJ. Epidemiological features of chronic low-back pain. Lancet. 1999;354:581–585. - PubMed
    1. Geurts JW, Willems PC, Kallewaard JW, Van Kleef M, Dirksen C. The impact of chronic discogenic low back pain: Costs and patients’ burden. Pain Res. Manag. 2018;2018:1–8. - PMC - PubMed
    1. Kigozi J, et al. Factors associated with costs and health outcomes in patients with Back and leg pain in primary care: A prospective cohort analysis. BMC Health Serv. Res. 2019;19:1–9. - PMC - PubMed
    1. Luoma K, et al. Low back pain in relation to lumbar disc degeneration. Spine (Phila Pa 1976) 2000;25:487–492. - PubMed
    1. De Schepper EIT, et al. The association between lumbar disc degeneration and low back pain: The influence of age, gender, and individual radiographic features. Spine (Phila Pa 1976) 2010;35:531–536. - PubMed

Publication types