. 2022 May;36(5):1237-1252.
doi: 10.1038/s41375-022-01541-0. Epub 2022 Mar 30.

RAS activation induces synthetic lethality of MEK inhibition with mitochondrial oxidative metabolism in acute myeloid leukemia

Affiliations

RAS activation induces synthetic lethality of MEK inhibition with mitochondrial oxidative metabolism in acute myeloid leukemia

Justine Decroocq et al. Leukemia. 2022 May.

Abstract

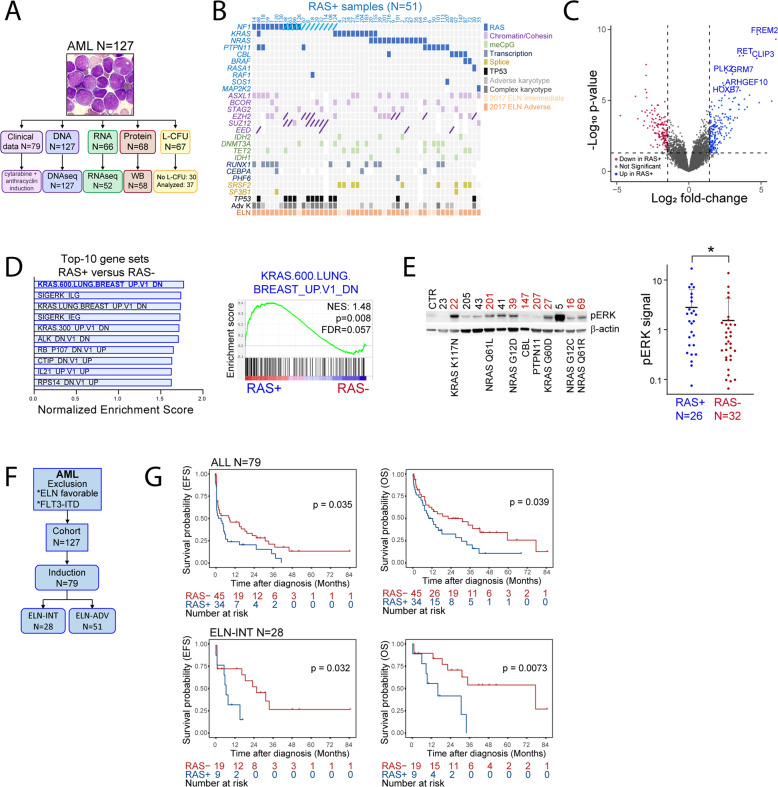
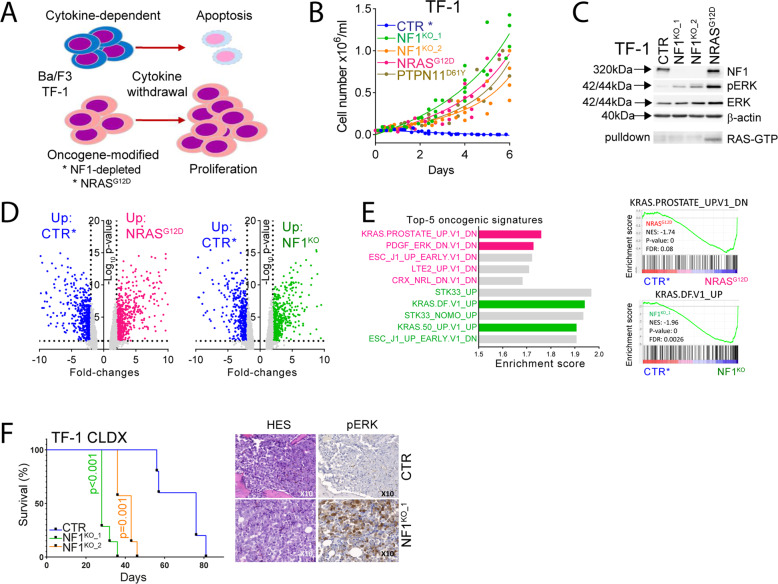
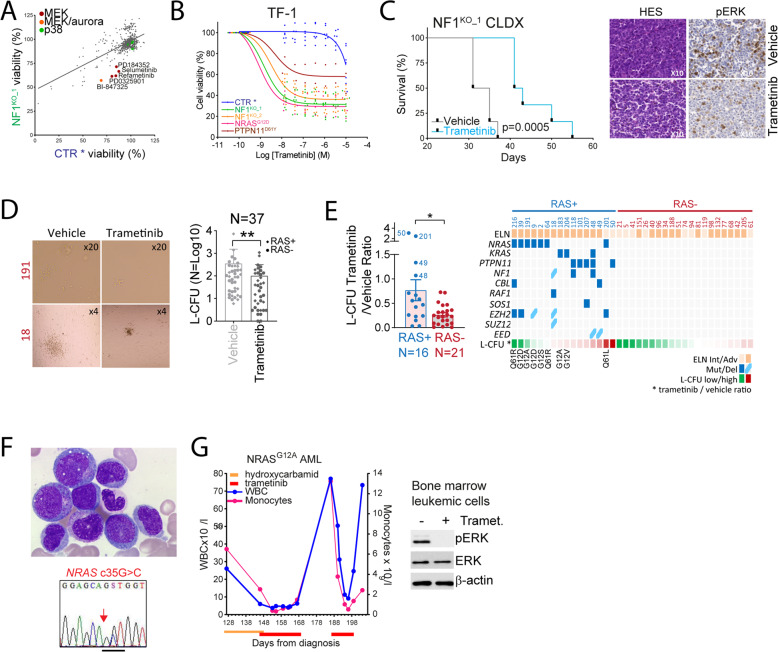
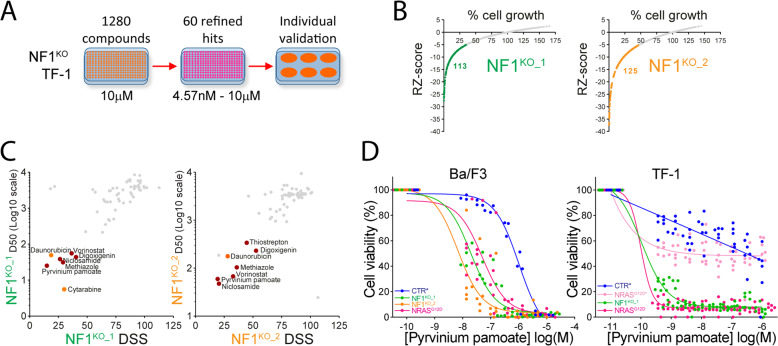
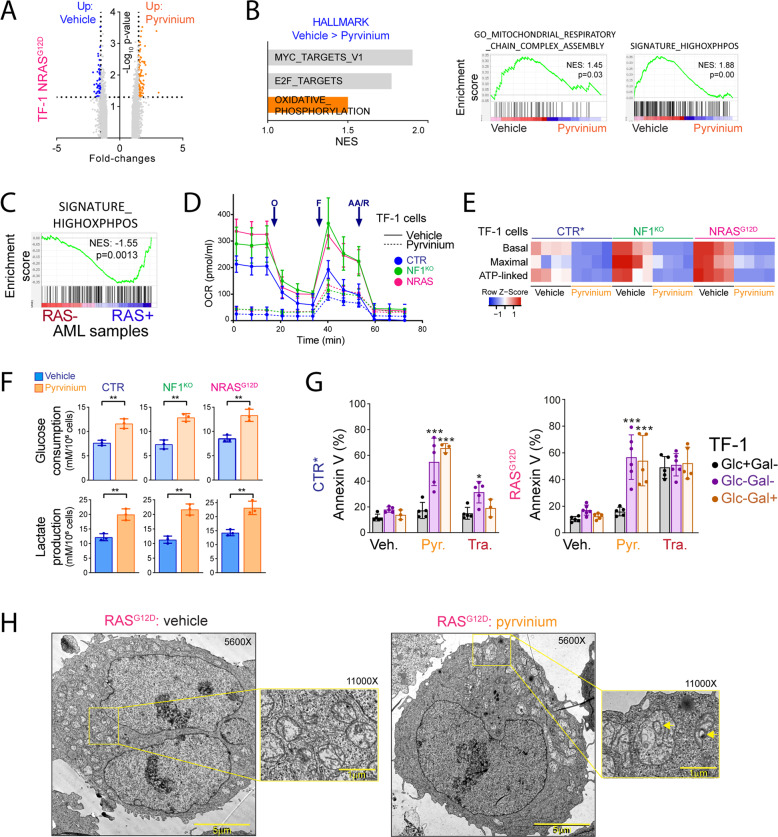
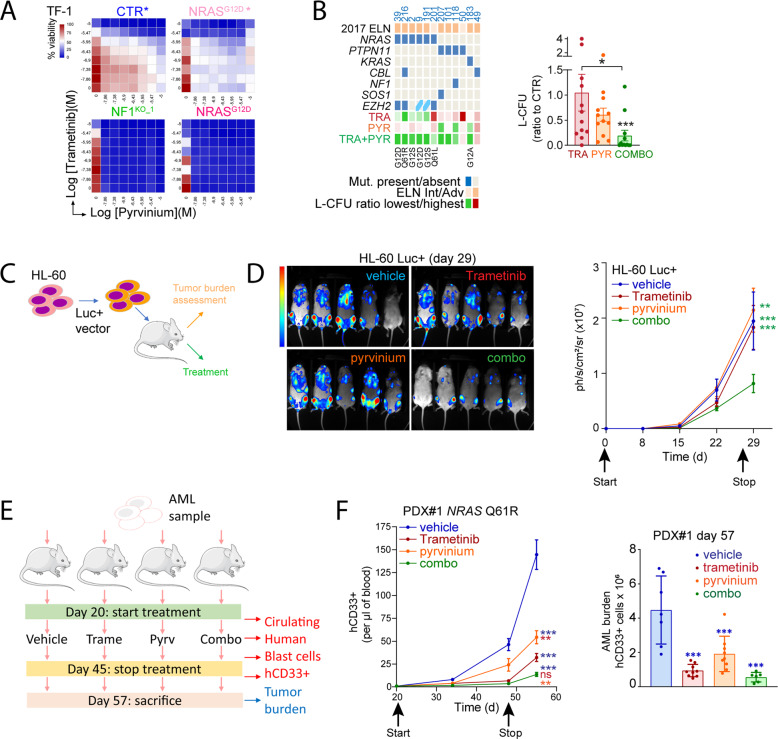
Despite recent advances in acute myeloid leukemia (AML) molecular characterization and targeted therapies, a majority of AML cases still lack therapeutically actionable targets. In 127 AML cases with unmet therapeutic needs, as defined by the exclusion of ELN favorable cases and of FLT3-ITD mutations, we identified 51 (40%) cases with alterations in RAS pathway genes (RAS+, mostly NF1, NRAS, KRAS, and PTPN11 genes). In 79 homogeneously treated AML patients from this cohort, RAS+ status were associated with higher white blood cell count, higher LDH, and reduced survival. In AML models of oncogenic addiction to RAS-MEK signaling, the MEK inhibitor trametinib demonstrated antileukemic activity in vitro and in vivo. However, the efficacy of trametinib was heterogeneous in ex vivo cultures of primary RAS+ AML patient specimens. From repurposing drug screens in RAS-activated AML cells, we identified pyrvinium pamoate, an anti-helminthic agent efficiently inhibiting the growth of RAS+ primary AML cells ex vivo, preferentially in trametinib-resistant PTPN11- or KRAS-mutated samples. Metabolic and genetic complementarity between trametinib and pyrvinium pamoate translated into anti-AML synergy in vitro. Moreover, this combination inhibited the propagation of RA+ AML cells in vivo in mice, indicating a potential for future clinical development of this strategy in AML.


Conflict of interest statement

The authors declare no competing interests.

Figures

Fig. 1
Fig. 1. Landscape and clinical correlations of RAS pathway alterations in AML.
A From 127 primary AML samples, we obtained DNA, RNA and protein samples in 127, 66, and 68 cases, respectively. After quality check, 127, 52, and 58 specimens were used for DNA sequencing (DNAseq), RNA sequencing (RNAseq) and Western blots (WB), respectively. L-CFU assays were performed in 69 cases, among which 37 generated more than five colonies (Analyzed samples). Clinical records were obtained in 79 cases having received an intensive chemotherapy regimen (cytarabine + anthracyclin induction). B Next-generation sequencing (NGS) in 51 RAS+ diagnosis samples of AML patients. RAS+ mutations (in blue) are represented when detected in at least one sample, and myeloid neoplasm-related mutations when occurring in at least five samples, regardless the number of mutations detected for a given gene. Variants are indicated by colored squares and deletions by an inclined line. Molecular categories are represented by a color code as indicated in the legend. Cytogenetics (complex and/or adverse karyotype versus others) and European leukemia network 2017 (ELN) risk category (intermediate or adverse) are indicated. C Gene expression profiling by RNA sequencing in 58 AML cases using a volcano plot representation of differential gene expression between RAS+ and RAS− cases. Genes with significant differential expression (cutoff fold-change = 1.5 and p-value 0.05) are highlighted in blue (up in RAS+ ) or in red (up in RAS−), and the names of RAS−related genes among the top-20 differentially expressed between RAS+ and RAS− samples are provided. D Left panel: top-10 gene sets significantly enriched in the transcriptomic analysis of RAS+ versus RAS− samples using the oncogenic signature gene set from GSEA. Right panel: representative enrichment plot of the KRAS.600 signature. E Protein extracts from 58 AML samples were analyzed by Western blot for ERK phosphorylation. Left panel: representative Western blots with RAS+ cases indicated in red along with type of mutation. CTR indicate a control sample (from an AML patient) used for normalization across Western blots. Right panel: quantification of phospho-ERK relative to β-actin (used as loading control) signal intensities. Ratio obtained for each sample (26 RAS+ and 32 RAS−) was normalized to the ratio obtained for the CTR sample for each membrane, separately. F After exclusion of ELN favorable risk category and FLT3-ITD positive cases, 127 AML cases were included, and among them 79 (62%) were homogeneously treated by an anthracycline- and cytarabine-based induction chemotherapy, including 28 and 51 from the ELN intermediate (INT) and adverse (ADV) risk category. G Event-free and overall survival (EFS, left panels and OS, right panels, respectively) of the whole cohort of intensively treated AML patients (N = 79, upper panels) and of ELN INT patients (N = 28, lower panels) dependent on RAS+ status.
Fig. 2
Fig. 2. Modelization of RAS pathway gene alterations revealed oncogenic addiction in AML.
A Schematic representation of cytokine-dependent cell lines models. TF-1 and Ba/F3 cell lines are cytokine-dependent (GM-CSF and IL-3, respectively). Cytokine starvation induces cell-cycle arrest and apoptosis in these cells. Activation of oncogenic pathways—such as RAS signaling—allow cytokine-independent growth of these cells. TF-1 cells were genetically modified to induce RAS activation. Two different guides of NF1-targeting CRISPR/Cas9 (NF1KO_1 and NF1KO_2), NRASG12D, and PTPN11D61Y constructs were transduced to TF-1 cells using lentivirus. Control cells (CTR) were transduced with a lentivirus expressing a non-targeting sgRNA. B Cell counting during six days after cytokine starvation in the modified TF-1 cell lines. C Immunoblotting of total cell lysates and of RAS-RAF1 pulldowns from CTR, NF1KO_1, NF1KO_2 and NRASG12D TF-1 cell lines with antibodies directed against NF1, phospho-ERK, ERK, RAS and β-actin. Black arrows indicate molecular weight of each proteins. Gene expression profiling by microarrays in CTR, NF1KO_1, and NRASG12D TF-1 cells. D Volcano plot representation of differential gene expression between control (cultured with GM-CSF, as indicated by *, in blue) and NRASG12D (left panel, in pink) or NF1KO_1 (right panel, in green). E Left panel: representation of the top-5 most significantly enriched gene expression signatures in the NRASG12D (in pink) or NF1KO_1 (in green) versus CTR* comparisons. Right panel: representative enrichment plots. F NOD/SCID gamma-null (NSG) mice were xenografted with 2 × 106 cells from the CTR, NF1KO_1 or NF1KO_2 TF-1 cell lines. Left panel. Survival curves of the CTR (N = 5), NF1KO_1 (N = 7) and NF1KO_2 (N = 7) groups. Right panel. Hematoxylin-eosin staining (HES) and phospho-ERK immunohistochemistry (IHC) of paraffin-embedded bone marrow samples from those mice. Images were captured using the slide scanner and software Zeiss Axioscan.Z1 (Carl Zeiss AG) at a tenfold magnification (×10).
Fig. 3
Fig. 3. Heterogeneous activity of MEK inhibitors against RAS+ AML.
A We applied the target selective inhibitors library (592 unique compounds) to CTR and NF1KO_1 TF-1 cells for 48 h, before cell viability quantification using the uptiblue fluorescent reagent. Each dot on the graph represents the mean of three independent experiments. B Dose–response curves of the MEK inhibitor trametinib (from 10−6 to 13.7 × 10−9 M) on CTR, NF1KO_1, NF1KO_2, NRASG12D, PTPN11WT, and PTPN11D61Y TF-1 cell lines. CTR and PTPN11WT cells were cultured with GM-CSF as indicated by *, while the remaining were not, and cell viability was measured by the uptiblue reagent. C NSG mice were xenografted with 2 × 106 cells from the NF1KO_1 TF-1 cell line (CLDX: cell line-derived xenograft) and vehicle or 0.5 mg/kg/d trametinib were given daily by oral gavage from day 8 post-transplant. Left panel: survival curves of this experiment (N = 6 in each group). Leukemia colony forming units (L-CFU) assays of primary samples from AML patients incubated with vehicle or 50 nM trametinib for 7 days. D Left panel: representative pictures of L-CFU in RAS+ (numbers in red) or RAS− samples at an ×4 or ×20 magnification as indicated. Right panel: comparison of the L-CFU number between vehicle- and trametinib-treated samples (N = 39). RAS+ and RAS− samples are identified by a diamond and a circle, respectively. E Left panel: histograms represent L-CFU ratio between trametinib and vehicle conditions in RAS+ and RAS− samples (N = 16 and 23, respectively). Right panel: representation of the L-CFU assays results dependent on NRAS, KRAS, PTPN11, NF1, and CBL mutational status. Type of amino acid substitutions are provided for NRAS and KRAS mutations. Description of the case of a NRASG12A-mutated AML patient treated with trametinib. F Upper panel: May-Grünwald-Giemsa staining of bone marrow aspirate smears at a ×100 magnification. Lower panel: Sanger sequencing of bone marrow AML cells focusing on the region surrounding the c35G>C substitution. G Left panel: evolution of the white blood cell count (WBC) and monocyte count dependent on time. Therapeutic interventions are indicated. Right panel: bone marrow sample cultured ex vivo with vehicle or 25 nM trametinib for 24 h. Vertical bars indicate standard deviations. *p < 0.05.
Fig. 4
Fig. 4. Identification of pyrvinium pamoate as anti-leukemic compound active in RAS+ AML.
A Schematic representation of high-density pharmacological screen in NF1 KO TF-1 cells. B First screen using the PCL library of 1280 compounds at 10μM and CellTiter-Glo® cell viability reagent after 72 h of incubation. Results are represented for each compound (identified by a single dot) by the relation between their robust Z-score value (RZ-score) in Y-axis and the percentage of cell growth in X-axis. Compounds with a RZ-score ≤ −5 (retained for further analysis) are highlighted in red. C Second screen performed with serial dilutions of the top-60 compounds from the first screen in NF1 KO TF-1 cells. Results are presented for each compound illustrated by a dot as the correspondence between their median effective dose (ED50, represented using a Log10 scale) and drug sensitivity score (DSS). The best hits are highlighted in red, and the classical AML chemotherapies (daunorubicin and cytarabine) are highlighted in orange. D Dose-range experiments using log-dilutions (10−5 to 10−8 M) of pyrvinium pamoate in CTR (non-targeting sgRNA), NF1KO-1, NF1KO_2 and NRASG12D Ba/F3 cells (left panel) or TF-1 (right panel) cells during 48 h. * indicate culture in the presence of IL-3 (Ba/F3 cells) or GM-CSF (TF-1 cells). Results in the control condition of each compound were normalized to all control conditions across each plate.
Fig. 5
Fig. 5. Pyrvinium pamoate targets mitochondrial respiration in AML.
A Gene expression profiling using microarrays in NRASG12D TF-1 cells incubated with vehicle or pyrvinium for 6 h. Genes with significant changes (fold-change ≥ 1.5 and p-value < 0.05) between the Vehicle and Pyrvinium conditions are highlighted (up in Pyrvinium in orange, up in Vehicle in blue). B Left panel: representation of the three significantly enriched Hallmark gene sets in Vehicle compared to Pyrvinium conditions based on their normalized enrichment score (NES). Right panel: representation of two enrichment plots of mitochondrial respiration and oxidative phosphorylation gene sets. C Enrichment plot using the high OxPhos signature from the transcriptomic analysis of RAS + versus RAS- AML samples. CTR, NF1KO_1 or NRASG12D TF-1 cells were incubated during 6 h with vehicle (CTR) or 500 nM pyrvinium pamoate in bioenergetic analysis assays measuring the oxygen consumption rate (OCR). D OCR evolution dependent on time. O: olygomycin; F: FCCP; AA/R: antimycin A/rotenone. E Heatmap representation of calculated basal, maximal and ATP-linked OCR. F Glucose consumption and lactate production in CTR, NF1KO, and NRASG12D TF-1 cells incubated with vehicle or pyrvinium for 24 h. G Apoptosis measured by flow cytometry annexin V binding assays in CTR (cultured with GM-CSF as indicated by *) or NRASG12D TF-1 cells incubated with vehicle, 750 nM pyrvinium or 25 nM trametinib in standard (Glc+ Gal+), glucose deficient (Glc-Gal-) or glucose-deficient and galactose-supplemented (Glc-Gal+) culture medium. H NRASG12D TF-1 cells were incubated 6 h with vehicle or 500 nM pyrvinium. Electron microscopy was performed at a 5600× or 11,000× magnification, as indicated. The size scale is provided for each image. Vertical bars indicate standard deviations. *p < 0.05; **p < 0.01; ***p < 0.001.
Fig. 6
Fig. 6. Synergy between the MEK inhibitor trametinib and pyrvinium pamoate in RAS activated cells.
A Combination drugs dose-range assays in CTR (with GM-CSF as indicated by *), NF1 KO and NRASG12D (without or with GM-CSF) TF-1 cells incubated with pyrvinium and/or trametinib for 48 h. Heat maps provided the combined results of three independent experiments. B L-CFU assays in RAS + primary AML samples incubated with vehicle, 50 nM trametinib, 250 nM pyrvinium pamoate or trametinib/pyrvinium combination during 7 days. Left panel: individual data for ELN risk category and NRAS, PTPN11, KRAS, CBL, and SOS1 mutations on the 12 samples. Type of amino acid substitutions are provided for NRAS and KRAS mutations. Right panel: pool of the individual values on L-CFU (presented as a ratio between L-CFU number in each condition relative to the vehicle-treated condition). In vivo luminescence assays using the HL-60 cell line. C Experimental plan: the HL-60 cell line transduced with a vector expressing luciferase (HL-60 Luc+) was injected into immunodeficient NSG recipient mice. Treatment with vehicle, 0.25 mg/kg/d trametinib (oral gavage, OG), 0.5 mg/kg pyrvinium (intraperitoneal injection, IP) or combination of trametinib and pyrvinium started the day of transplantation (N = 5 mice per treatment group). Tumor burden was measured using a luminescent camera every week. D Left panel: images captured at day 29 from treatment onset in the four experimental groups. Right panel: quantification of the luminescent signal representing HL-60 Luc+ tumor burden from treatment onset during 4 weeks. Patient-derived xenograft (PDX) experiment in immunodeficient NSG mice recipients. E Experimental plan: AML cells were propagated to nine mice per experimental group (vehicle, trametinib, pyrvinium and combination) and treatment started 20 days after transplantation when human AML cells were detected in mice peripheral blood. Treatment with vehicle, 0.25 mg/kg/d trametinib (OG), 0.25 mg/kg/d pyrvinium (IP) or combination of trametinib and pyrvinium was given by daily oral gavage during 25 days and then discontinued. F Left panel: disease propagation was monitored every 2 weeks by flow cytometry with antihuman (h)CD33 antibody in mice peripheral blood. Right panel: tumor burden was assessed at the end of the experiment on total bone marrow and spleen using anti-hCD33 antibody. Vertical bars indicate standard deviations. ***p < 0.001.

Similar articles

Cited by

References

    1. Raj RV, Abedin SM, Atallah E. Incorporating newer agents in the treatment of acute myeloid leukemia. Leuk Res. 2018;74:113–20. - PubMed
    1. Cox AD, Fesik SW, Kimmelman AC, Luo J, Der CJ. Drugging the undruggable RAS: mission possible? Nat Rev Drug Discov. 2014;13:828–51. - PMC - PubMed
    1. Simanshu DK, Nissley DV, McCormick F. RAS proteins and their regulators in human disease. Cell. 2017;170:17–33. - PMC - PubMed
    1. Wang T, Yu H, Hughes NW, Liu B, Kendirli A, Klein K, et al. Gene essentiality profiling reveals gene networks and synthetic lethal interactions with oncogenic Ras. Cell. 2017;168:890–903.e15. - PMC - PubMed
    1. Ostrem JML, Shokat KM. Direct small-molecule inhibitors of KRAS: from structural insights to mechanism-based design. Nat Rev Drug Discov. 2016;15:771–85. - PubMed

Publication types

MeSH terms

Substances