. 2022 Apr;23(4):518-531.
doi: 10.1038/s41590-022-01166-6. Epub 2022 Mar 30.

Neutrophils direct preexisting matrix to initiate repair in damaged tissues

Affiliations

Neutrophils direct preexisting matrix to initiate repair in damaged tissues

Adrian Fischer et al. Nat Immunol. 2022 Apr.

Abstract

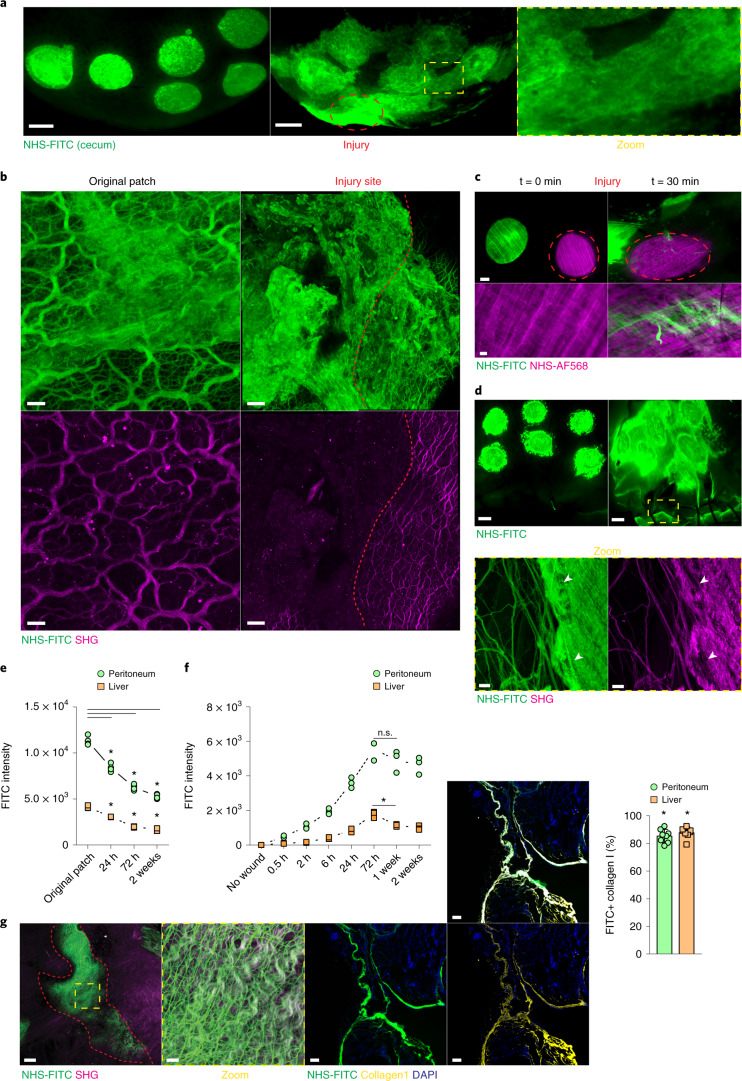
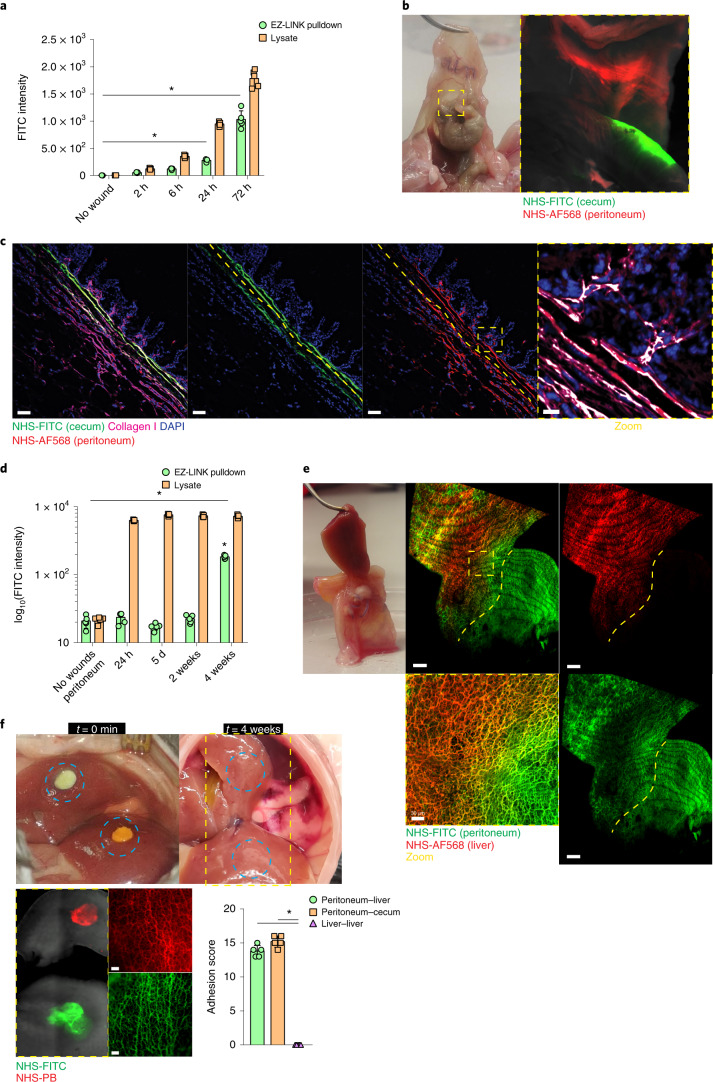
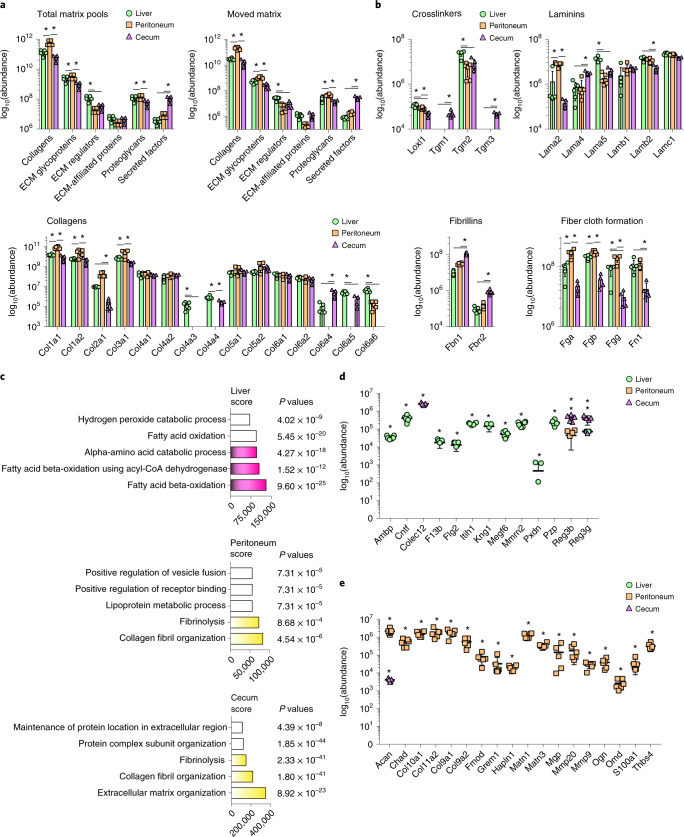
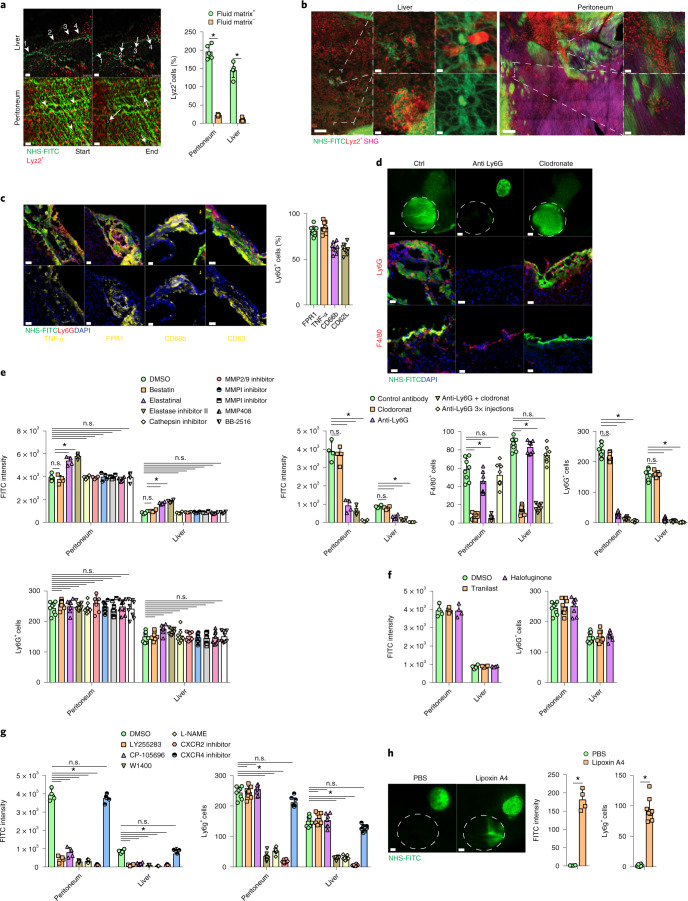
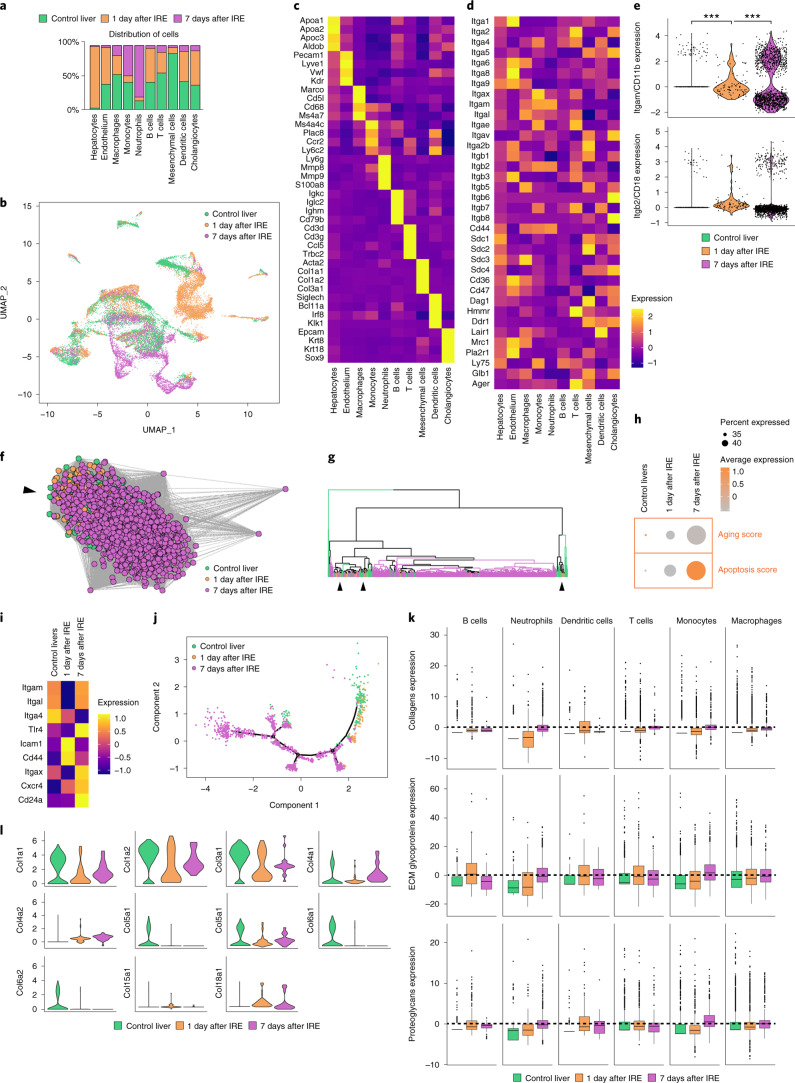
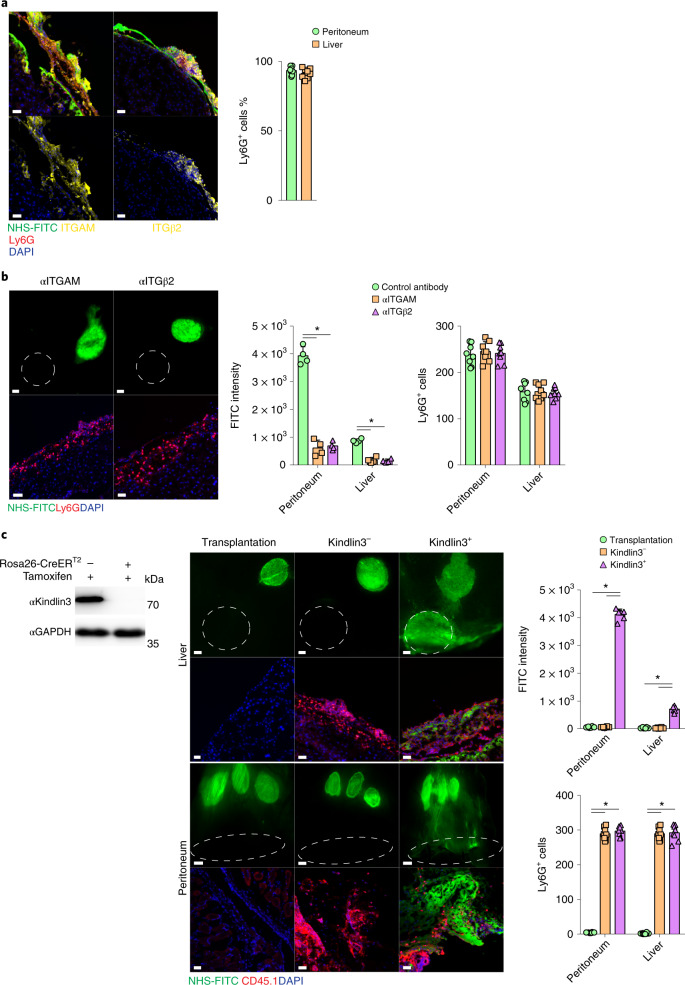
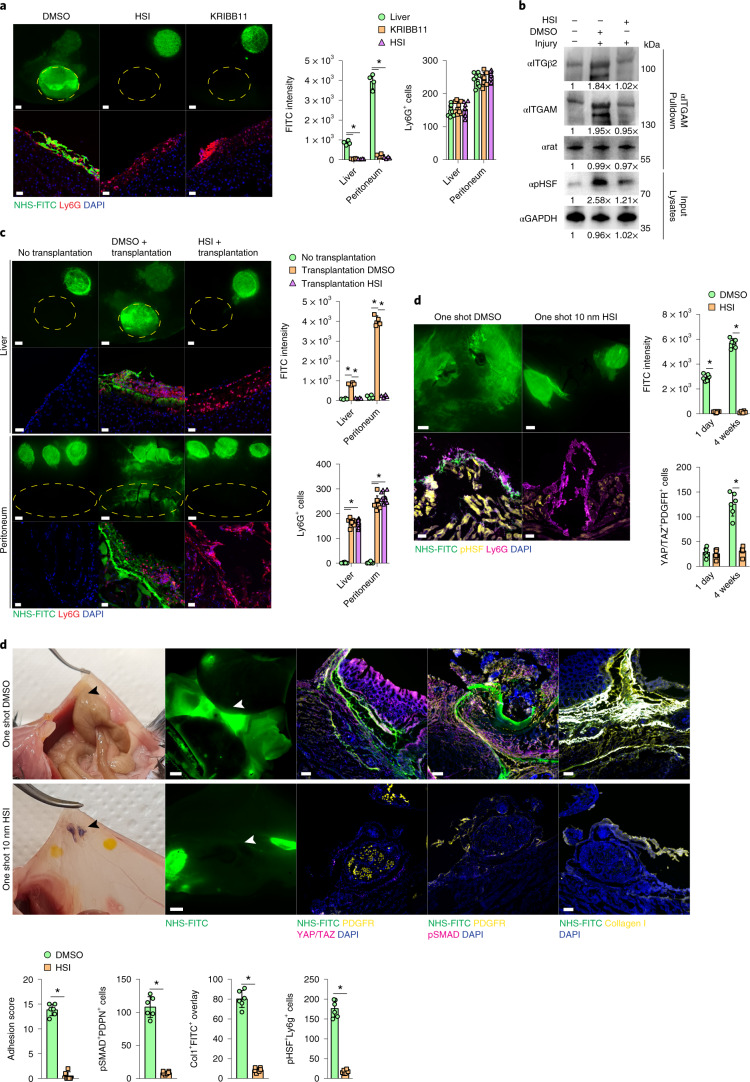
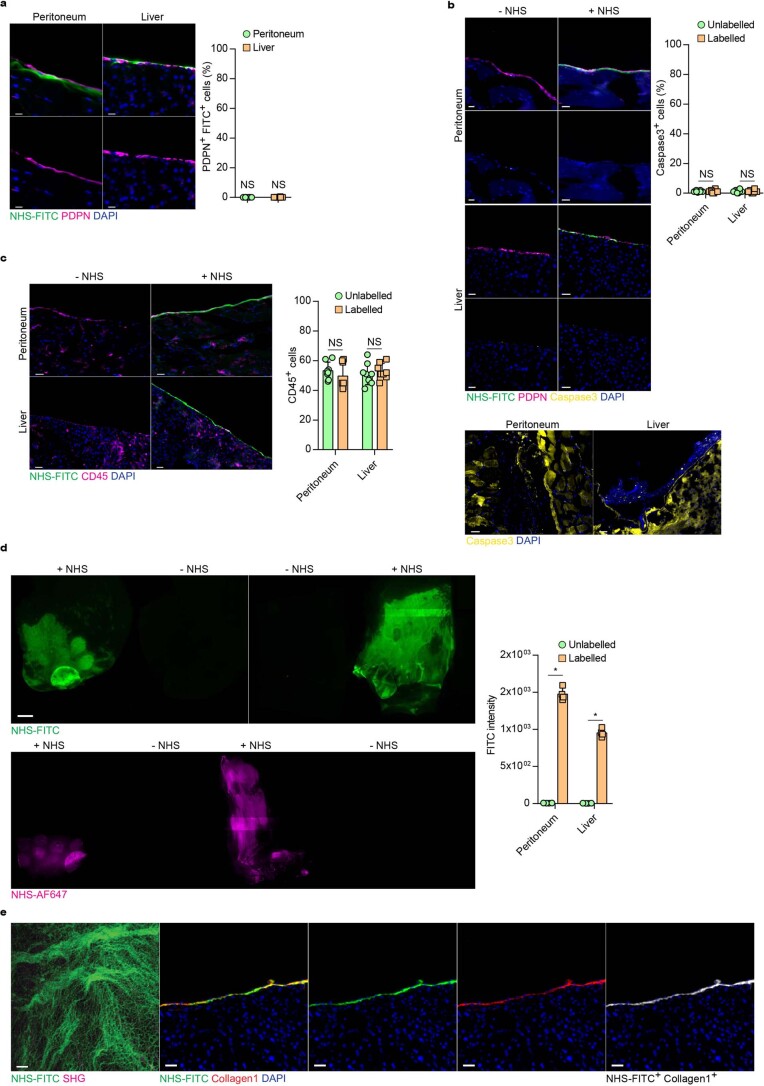
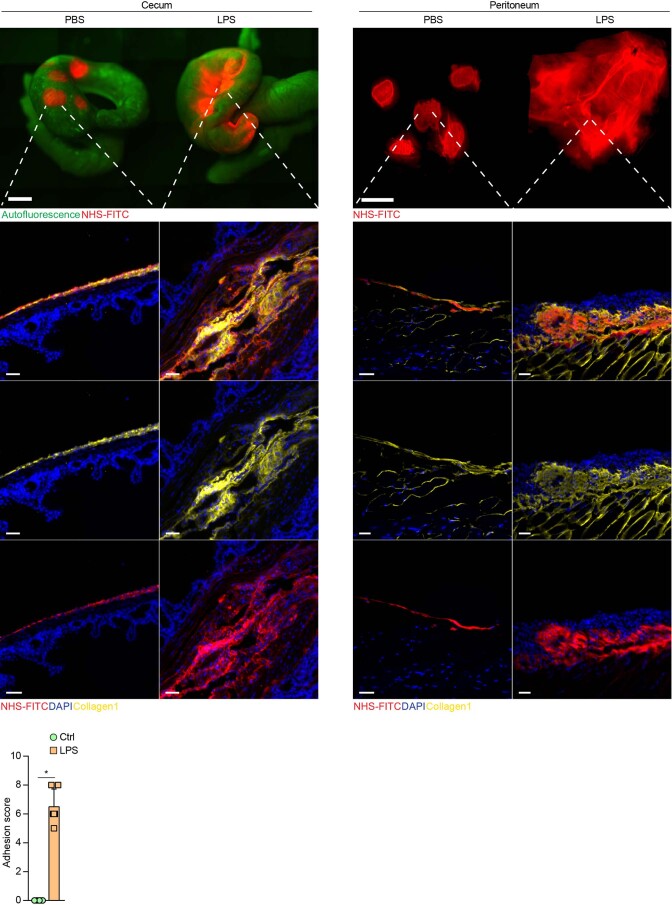
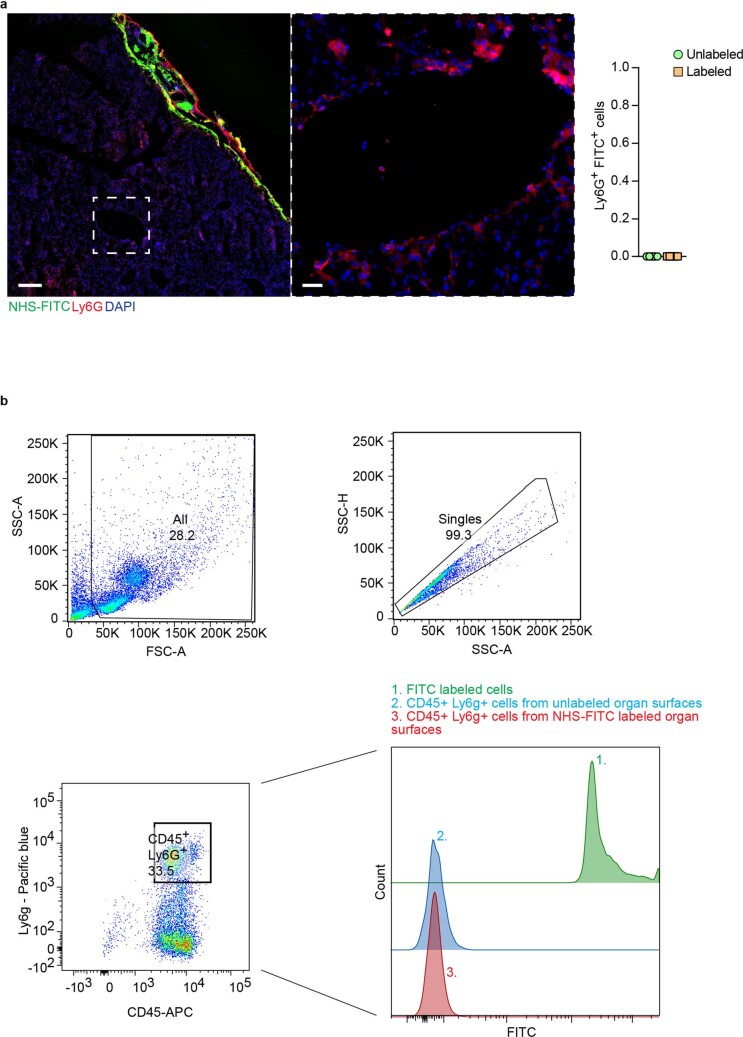
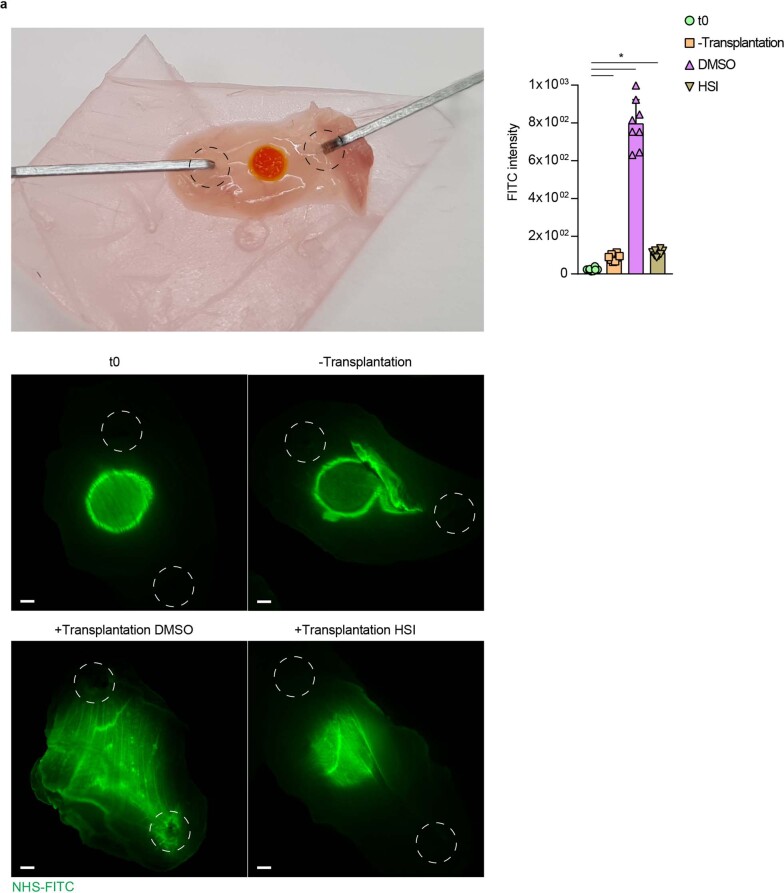
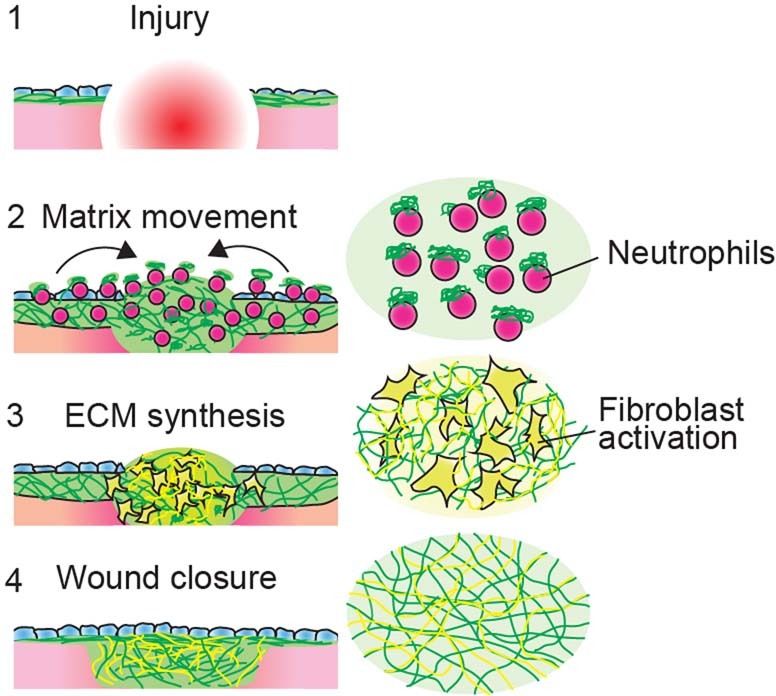
Internal organs heal injuries with new connective tissue, but the cellular and molecular events of this process remain obscure. By tagging extracellular matrix around the mesothelium lining in mouse peritoneum, liver and cecum, here we show that preexisting matrix was transferred across organs into wounds in various injury models. Using proteomics, genetic lineage-tracing and selective injury in juxtaposed organs, we found that the tissue of origin for the transferred matrix likely dictated the scarring or regeneration of the healing tissue. Single-cell RNA sequencing and genetic and chemical screens indicated that the preexisting matrix was transferred by neutrophils dependent on the HSF-integrin AM/B2-kindlin3 cascade. Pharmacologic inhibition of this axis prevented matrix transfer and the formation of peritoneal adhesions. Matrix transfer was thus an early event of wound repair and provides a therapeutic window to dampen scaring across a range of conditions.


Conflict of interest statement

The authors declare no competing interests.

Figures

Fig. 1
Fig. 1. Surface injury induces organ-wide matrix transfer.
a, Representative images from a liver surface marked with NHS-FITC at 24 hours p.i. Scale bar, 2,000 µm. b, Representative images of transferred matrix from the original patch and at a distal wound site. Wound area depicted in yellow. Scale bars: wound, 50 µm; original patch, 15 µm. c, Representative images of fate mapping of peritoneal surface ECM after brushing injury. Scale bars: overview, 1,000 µm; high magnification, 100 µm. d, Representative images showing that peritoneal surface ECM flows towards the laparotomy site. Scale bars: stereomicroscope, 2,000 µm; multiphoton, 15 µm. e, Fluorometric measurements of transferred matrix from original patch sites over time. n = 4 biological replicates (C57BL/6J wild-type (WT) mice). Data represent mean ± s.d. One-way ANOVA was used for the multiple comparisons testing, with Tukey’s test: *P < 0.05. f, Fluorometric measurements of transferred matrix into distal wound sites over time. n = 3 biological replicates (0.5 h, 2 h, 24 h, 2 weeks) and n = 4 (no wound, 6 h, 72 h, 1 week), (C57BL/6J WT mice). Data are mean ± s.d.. Two-tailed Mann–Whitney: *P < 0.05. n.s., P = 0.3429. g, Laparotomy closure in matrix fate mapping after 2 weeks. Scale bar: overview, 50 µm; high magnification, 15 µm. Percentage of FITC+ collagen I at the distal laparotomy site after 2 weeks. Scale bar, 50 µm. Data represent mean ± s.d. Two-tailed Mann–Whitney: *P < 0.05. Data in ad and g were selected as representative of six biological replicates (C57BL/6J WT mice) and three independent experiments. Source data
Fig. 2
Fig. 2. Transferred matrix regenerates connective tissues in wounds.
a, Fluoreometric analysis of samples derived from liver wounds distantly labeled with EZ-LINK-biotin and NHS-FITC at 2, 6, 24 and 72 hours p.i.; uninjured tissue acted as control. Data represent mean ± s.d. Two-tailed Mann–Whitney: *P < 0.05. n = 4 biological replicates (C57BL/6J WT mice) and 3 independent experiments. b, Representative images of a postoperative adhesion site between peritoneum (NHS-AF568+) and cecum (NHS-FITC+) at 4 weeks p.i. Both organs were locally labeled and brushed at distal sites opposing each other. n = 5 biological replicates (C57BL/6J WT mice) and 4 independent experiments. c, Representative immunolabel images of a postoperative adhesion site between peritoneum (NHS-AF568+) and cecum (NHS-FITC+) at 4 weeks p.i. Both organs were locally labeled and brushed at distal sites opposing each other. n = 5 biological replicates (C57BL/6J WT mice) and 4 independent experiments. Scale bars: overview, 100 µm; zoom, 10 µm. d, Fluoreometric analysis of samples derived from adhesion samples between peritoneum (EZ-LINK-biotin+) and cecum (NHS-FITC+) at 24 hours, 5 days, 2 weeks and 4 weeks p.i.; uninjured peritoneum acted as control. Data represent mean ± s.d. Two-tailed Mann–Whitney; *P < 0.05. n = 5 biological replicates (C57BL/6J WT mice) and 3 independent experiments. e, Representative images of a postoperative adhesion site between peritoneum (NHS-FITC+) and liver (NHS-AF568+) at 4 weeks p.i. Both organs were locally labeled and brushed at distal sites opposing each other. n = 5 biological replicates (C57BL/6J WT mice) and 4 independent experiments. Scale bars: overview, 200 µm; zoom, 20 µm. f, Representative images of NHS-FITC+ and NHS-PB+ liver lobes with opposing wound sites at 4 weeks p.i. n = 5 biological replicates (C57BL/6J WT mice) and 3 independent experiments. Scale bar, 50 µm. Intraorgan adhesions were scored according to Supplementary Table 1. Data represent mean ± s.d. Two-tailed Mann–Whitney: *P < 0.05. Source data
Fig. 3
Fig. 3. Transferred matrix provides many raw components for tissue repair.
a, Mass-spectrometry analysis of matrisomal proteins derived from pulled-down NHS-EZ-Link marked organ surface ECM. Total matrix pools represent combined total amounts of original label and wound site at 24 hours p.i. Data represent mean ± s.d. One-way ANOVA was used for multiple comparisons testing, with Tukey’s test: *P < 0.05. b, Highlighted matrisomal protein groups derived from pulled down NHS-EZ-Link in wounds 24 hours p.i. from a. c, Gene ontology analysis of matrisomal genes via EnrichR webtool. Data represent the combined score. P values of Fisher’s exact tests are indicated. d,e, Matrisomal proteins classified on the basis of Uniprot entries in proregenerative and profibrotic categories. Data represent mean ± s.d. One-way ANOVA was used for multiple comparisons testing, with Tukey’s test: *P < 0.05. n = 6 biological replicates for peritoneum and liver, n = 5 biological replicates for cecum (all C57BL/6J WT mice); 3 independent experiments. Source data
Fig. 4
Fig. 4. Active neutrophils actively transport matrix by swarming.
a, Snapshots of Supplementary Movies 7 and 8: Lyz2+ (red) cells on liver are shown, and peritoneal surfaces single cells are highlighted with arrows. n = 5 biological replicates and 3 independent experiments. Two-tailed Mann–Whitney: *P < 0.05. Scale bars, 50 µm. b, Representative images of NHS-FITC-labeled liver and peritoneal surfaces in Lyz2Cre;Ai14 mice at 24 hours p.i. n = 5 biological replicates and 3 independent experiments. Scale bars: overview, 50 µm; zoom, 5 µm. c, Representative images showing the ratio of TNF-α+, FPR1+, CD63+, CD62L+ and CD66b+ and Ly6G+ neutrophils in wound areas at 24 hours p.i. n = 6 biological replicates (all C57BL/6J WT mice) and 4 independent experiments. Scale bar: 50 µm. d, Representative images from liver surfaces of animals treated with anti-Ly6G antibody or clodronate marked with NHS-FITC at 24 hours p.i. n = 5 biological replicates (all C57BL/6J WT mice) and 3 independent experiments. Two-tailed Mann–Whitney: *P < 0.05. Scale bars: overview, 500 µm; histology, 30 µm. eg, Fluorometric measurements of transferred FITC+ matrix in wounds in animals treated with protease (e), collagen-synthesis (f) or neutrophil-swarming inhibitors (g) at 24 hours p.i. Quantification of Ly6G+ cells in wounds at 24 hours p.i. n = 5 biological replicates (all C57BL/6J WT mice) and 3 independent experiments. Two-tailed Mann–Whitney: *P < 0.05. h, Representative images from liver surfaces of animals locally treated with lipoxin 4A marked with NHS-FITC at 24 hours p.i. Quantification of Ly6G+ cells in wounds at 24 hours p.i. n = 4 biological replicates (all C57BL/6J WT mice) and 4 independent experiments. Two-tailed Mann–Whitney: *P < 0.05. Scale bar: overview, 500 µm. Source data
Fig. 5
Fig. 5. Single-cell transcriptomics of liver wounds identifies 17 major cellular lineages.
a, Single-cell sequencing data of adult mouse livers subjected to irreversible electroporation, showing distribution of cells per cluster, colored by experimental condition. b, UMAP of a. c, Scaled heatmap (yellow, high; purple, low) of cell-lineage markers used to identify the different cell populations. d, Scaled heatmap (yellow, high; purple, low) of all ECM receptors expressed in the different liver lineages. e, Violin plots showing the expression of Itgb2 and Itgam in the neutrophil cluster. Two sample t-test. f, Inferred lineage relationship among neutrophils in an adjacency network on the basis of pairwise correlations between cells. Black arrow indicates point of heterogeneity. g, Hierarchical clustering on neutrophilic genes identified by principal component analysis (PCA). Black arrows indicate points of heterogeneity. h, Aging and apoptosis score based on the total expression of age-related genes (listed in d) and apoptosis genes (GO:0097193). i, Scaled heatmap (yellow, high; purple, low) of all age-related genes (see Methods). j, Monocle pseudotemporal ordering based on genes identified by PCA revealing neutrophilic maturation. k, Cumulative expression score of genes that fall under the core matrisome, further categorized into collagens (top), glycoproteins (middle) and proteoglycans (bottom). l, Mesenchyme cell cluster, showing gene expressions (violin plots) of all collagens exceeding an expression threshold of 2.0. ***P < 0.001. Box plots represent the median, interquartile range (IQR), minimum (25th percentile, 1.5 × IQR) and maximum (75th percentile, 1.5 × IQR). Source data
Fig. 6
Fig. 6. Integrin AM and B2 in neutrophils orchestrate matrix transfer.
a, Representative immunohistological stainings of organ wounds 24 hours after injury. n = 6 biological replicates (C57BL/6J WT mice). Data are representative of 4 independent experiments. Histology, 50 µm. Two-tailed Mann–Whitney: *P < 0.05. b, Representative images from liver surfaces of animals treated with ITGAM- and ITGβ2-blocking antibodies marked with NHS-FITC at 24 hours p.i. and quantification of Ly6G+ cells in wounds post 24 hours. n = 6 biological replicates (C57BL/6J WT mice). Data are representative of 4 independent experiments. Two-tailed Mann–Whitney: *P < 0.05. Scale bar: overview, 500 µm; histology, 30 µm. c, Representative images from organ surfaces of neutrophil-depleted animals marked with NHS-FITC at 24 hours p.i. Purified neutrophils were derived from Cre or Cre+ R26CreER;floxKindlin3flox mice treated with tamoxifen before transplantation into the abdomen. Successful recombination was verified via immunoblot analysis. n = 5 biological replicates of 4 independent experiments. Scale bar: overview, 500 µm; histology, 30 µm. Source data
Fig. 7
Fig. 7. Neutrophils direct matrix transfer.
a, Representative images from liver surfaces of animals treated with HSIs marked with NHS-FITC at 24 hours p.i. n = 4 biological replicates (C57BL/6J WT mice) and 3 independent experiments. Two-tailed Mann–Whitney: *P < 0.05. Scale bar: overview, 500 µm; histology, 30 µm. b, Representative immunoblots of lysates and immunoprecipitations derived from purified wound neutrophils. n = 4 biological replicates (C57BL/6J WT mice) and 3 independent experiments. Quantifications are relative to controls. c, Representative images from organ surfaces of neutrophil-depleted animals marked with NHS-FITC 24 hours p.i. Purified neutrophils were pretreated with DMSO or HSI before transplantation into the abdomen. n = 4 biological replicates (C57BL/6J WT mice) and 3 independent experiments. Two-tailed Mann–Whitney: *P < 0.05. Scale bar: overview, 500 µm; histology, 30 µm. Scale bar: overview, 500 µm; histology, 30 µm. d, Representative images from postoperative adhesions of HSI-pretreated animals with NHS-FITC labeled peritoneum 1 day p.i. n = 6 biological replicates (C57BL/6J WT mice) and 4 independent experiments. Two-tailed Mann–Whitney: *P < 0.05. Scale bars: overview, 2,000 µm; histology, 100 µm. e, Representative images from post operative adhesions of HSI-pretreated animals with NHS-FITC-labeled peritoneum at 4 weeks p.i. n = 6 biological replicates (C57BL/6J WT mice). Two-tailed Mann–Whitney: *P < 0.05; n.s., not significant. Adhesions were scored according to Supplementary Table 1. Data are representative of four independent experiments. Scale bars: overview, 2,000 µm; histology, 100 µm.
Extended Data Fig. 1
Extended Data Fig. 1. NHS esters enable stable, non-toxic, labeling of organ surface ECM.
a-c, Representative immunohistological stainings for NHS labelling, cell death (Caspase3) and immune cell (CD45) amount in control and NHS-labeled organ surfaces. Peritoneal closure and liver electroporation acted as positive control for Caspase3 stainings. n = six biological replicates. (C57BL/6 J WT mice) and three independent experiments. d, Representative images from liver and peritoneal surfaces of animals locallylabelled with NHS-FITC or NHS-AF647 24 hours post injury. n = four biological replicates. Scale bar: 2000 µm. Fluorometer based analysis of FITC signals detected in wounds 24 hours after injury quantified signal to autofluorescence ratio. n = four biological replicates and three independent experiments. Data represented are mean ± SD. Two-tailed Mann–Whitney; * P < 0.05. e, Representative multiphoton and immunohistological images of a liver wound 2 weeks after injury. n = six biological replicates. Scale bar: Multiphoton: 50 µm; Histology: 50 µm. Two-tailed Mann–Whitney; * P < 0.05; ns= not significant. n = six biological replicates. (C57BL/6 J WT mice) and four independent experiments. Source data
Extended Data Fig. 2
Extended Data Fig. 2. Fluid matrix mediated wound closure is supplemented days later by de novo ECM synthesis.
a-d, Representative immunohistological images of peritoneal and liver wounds of animals injected with non-canonical amino acids (ncAAS; magenta) and locally labeled with NHS-FITC, samples were collected three days and 2 weeks after injury. n = six biological replicates (C57BL/6 J WT mice) and three independent experiments. Overview: 100 µM; Highlight: 50 µM. Two-tailed Mann–Whitney; * P < 0.05; NS = not significant. Source data
Extended Data Fig. 3
Extended Data Fig. 3. Fibrous postsurgical adhesions consist of transferred matrix elements.
a, Schematic Visualization of adventitial and serosal connective tissue layers identified transferred matrix. b, Representative immunofluorescence images of histological sections of three biological replicates of murine and human abdominal postsurgical adhesions. Murine peritonea were labeled with NHS-AF568 cecum was labeled with NHS-FITC. Mice were sacrificed 4 weeks after surgery. n = six C57BL/6 J WT mice and four independent experiments. Human adhesion tissue was collected from ten different patients with abdominal adhesions during adhesiolysis. Scale bar: 20 µm. Source data
Extended Data Fig. 4
Extended Data Fig. 4. Mesothelial cells are a source for transferred ECM.
a, Overview of CNA35 reporter system. Transduced mesothelial cells express CNA35 fused to mCherry, which binds to collagens. Representative immunostainings five days after intra peritoneal injection of CNA35 reporter system. Scale bar: 20 µm. n = six C57BL/6 J WT mice and three independent experiments. b, Representative light sheet images of laparotomy closure of animals transduced with CNA35-mcherry reporter and NHS-FITC surface label 24 hours post injury. n = six C57BL/6 J WT mice and three independent experiments. Scale bar: 500 µm. c, Representative histology images of animals transduced with CNA35-mcherry reporter and NHS-FITC surface label 24 hours post injury. n = six C57BL/6 J WT mice and three independent experiments. Scale bar: 50 µm. d, Quantification of FITC + CNA35 + double positive signal from c. n = six C57BL/6 J WT mice and three independent experiments. e, Representative immunohistological stainings of NHS-FITC labelled livers 24 hours and 1 week after injury. n = six C57BL/6 J WT mice and three independent experiments. Histology: 50 µm. Two-tailed Mann–Whitney; * P < 0.05. Source data
Extended Data Fig. 5
Extended Data Fig. 5. Matrix movements on organ surfaces are independent of EN1 + fibroblasts.
a, Representative immunohistological stainings of organ wounds 24 hours after injury. Quantification of Ly6G+ neutrophils and PDGFR + NCad+ fibroblasts in organ wounds 24 hours post injury. n = six C57BL/6 J WT mice and three independent experiments. Scale bar: 50 µm. Two-tailed Mann–Whitney; * P < 0.05. b, Representative immunohistological stainings of EN1Cre;R26mTmG transgenic mouse organ wounds 24 hours after injury. Skin histology acts as EN1 reporter control, showing EN1+ cells in skin wounds as previously reported. n = six mice and four independent experiments. Scale bar: 50 µm. c, Representative images of organ surfaces in the presence of N-cadherin inhibitor Exherin post 24 hours after injury. n = four C57BL/6 J WT mice and three independent experiments. Two-tailed Mann–Whitney; NS = not significant. Scale bar: 500 µm. Source data
Extended Data Fig. 6
Extended Data Fig. 6. Sterile inflammation activates matrix transfer and organ fibrosis.
Representative images of locally NHS labeled Organ surfaces followed by lipopolysaccharide injections five days after, samples were collected one week post LPS injection. n = six C57BL/6 J WT mice and four independent experiments. Stereomicroscope: Scale bar: 2000 µm. Histology: 30 µm. Adhesions were scored according to extended table 1. Two-tailed Mann–Whitney; * P < 0.05. Source data
Extended Data Fig. 7
Extended Data Fig. 7. Neutrophils transport matrix directionally.
a, Representative images from livers surfaces with NHS-FITC 24 hours post injury. n = four biological replicates. Scale bar: Overview 500 µm; Histology: 30 µm. b, Flow cytometry analysis of blood from mice 24 hours after surgery and organ surface label. CD45+ and Ly6G+ were sorted for FITC+ signal, FITC labeled cells acted as positive control. n = five biological replicates and three independent experiments. Source data
Extended Data Fig. 8
Extended Data Fig. 8. Neutrophils orchestrate matrix transfer via active HSF signaling ex vivo.
a, Representative images from cultivated NHS-FITC labelled peritoneal biopsy punches in the presence of neutrophils. Scale bar: 500 µm. n = five biological replicates and five independent experiments. Two-tailed Mann–Whitney; * P < 0.05; NS = not significant. Source data
Extended Data Fig. 9
Extended Data Fig. 9. Model of organ surface wound healing.
a, Local wounding leads to recruitment of neutrophils carrying fluid matrix. This matrix provides a provisional wound closure, after a few days active fibroblasts provide a new deposition of extra cellular matrix, which is integrated into the fluid matrix.

Comment in

Similar articles

Cited by

References

    1. Eming, S. A., Martin, P. & Tomic-Canic, M. Wound repair and regeneration: mechanisms, signaling, and translation. Sci. Transl. Med. 6, 265sr6 (2014). - PMC - PubMed
    1. Avishai E, Yeghiazaryan K, Golubnitschaja O. Impaired wound healing: facts and hypotheses for multi-professional considerations in predictive, preventive and personalised medicine. EPMA J. 2017;8:23–33. doi: 10.1007/s13167-017-0081-y. - DOI - PMC - PubMed
    1. Guo S, DiPietro LA. Critical review in oral biology & medicine: factors affecting wound healing. J. Dent. Res. 2010;89:219–229. doi: 10.1177/0022034509359125. - DOI - PMC - PubMed
    1. Nussbaum SR, et al. An economic evaluation of the impact, cost, and medicare policy implications of chronic nonhealing. Wounds Value Heal. 2018;21:27–32. doi: 10.1016/j.jval.2017.07.007. - DOI - PubMed
    1. Shetty, A. & Syn, W. Health and economic burden of nonalcoholic fatty liver disease in the united states and its impact on veterans. Fed. Pract.36, 14–19 (2019). - PMC - PubMed

Publication types