. 2022 Apr;604(7904):152-159.
doi: 10.1038/s41586-022-04530-6. Epub 2022 Mar 30.

Crucial role and mechanism of transcription-coupled DNA repair in bacteria

Affiliations

Crucial role and mechanism of transcription-coupled DNA repair in bacteria

Binod K Bharati et al. Nature. 2022 Apr.

Abstract

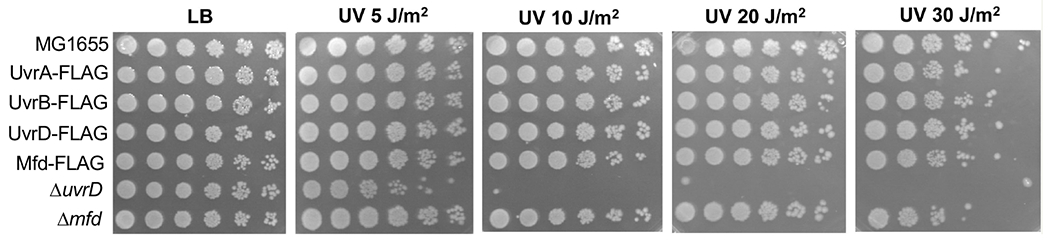
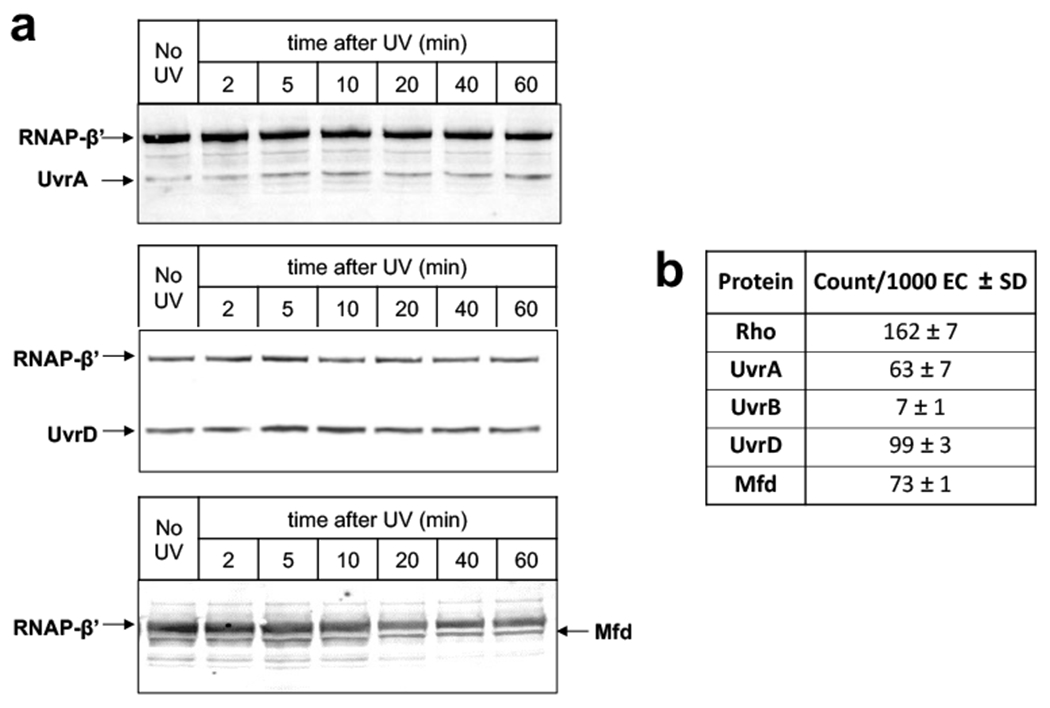
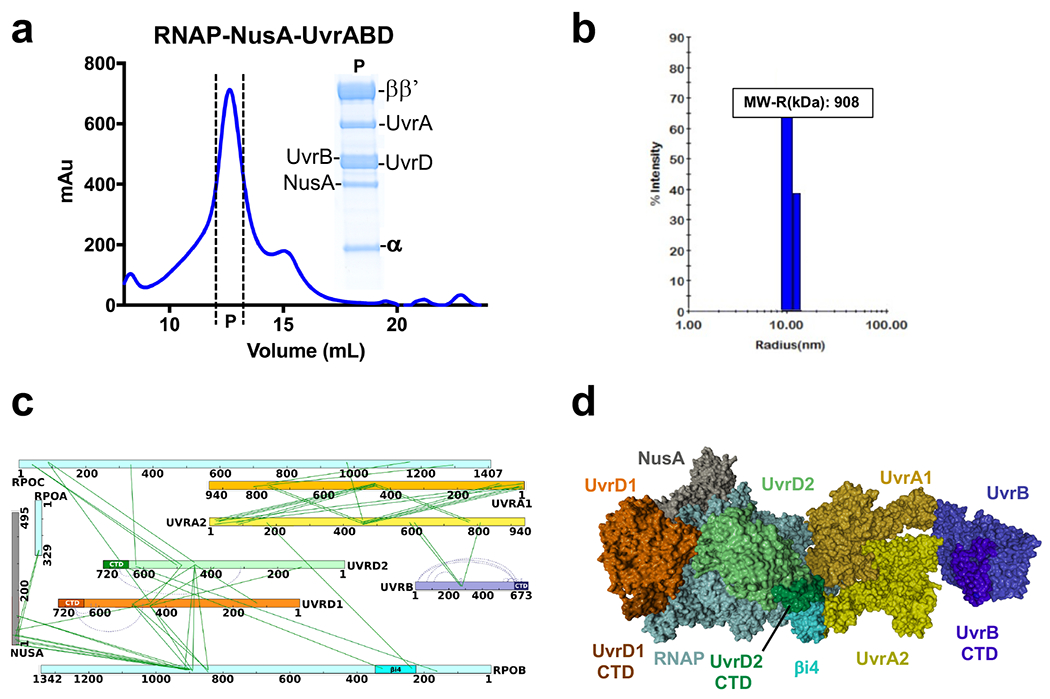
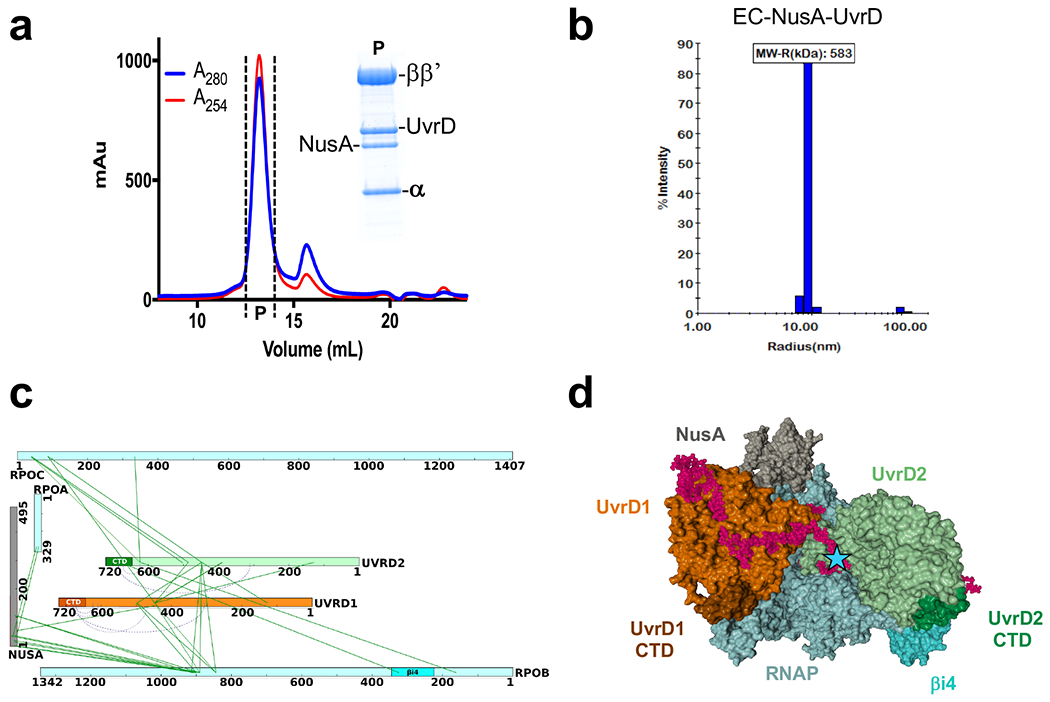
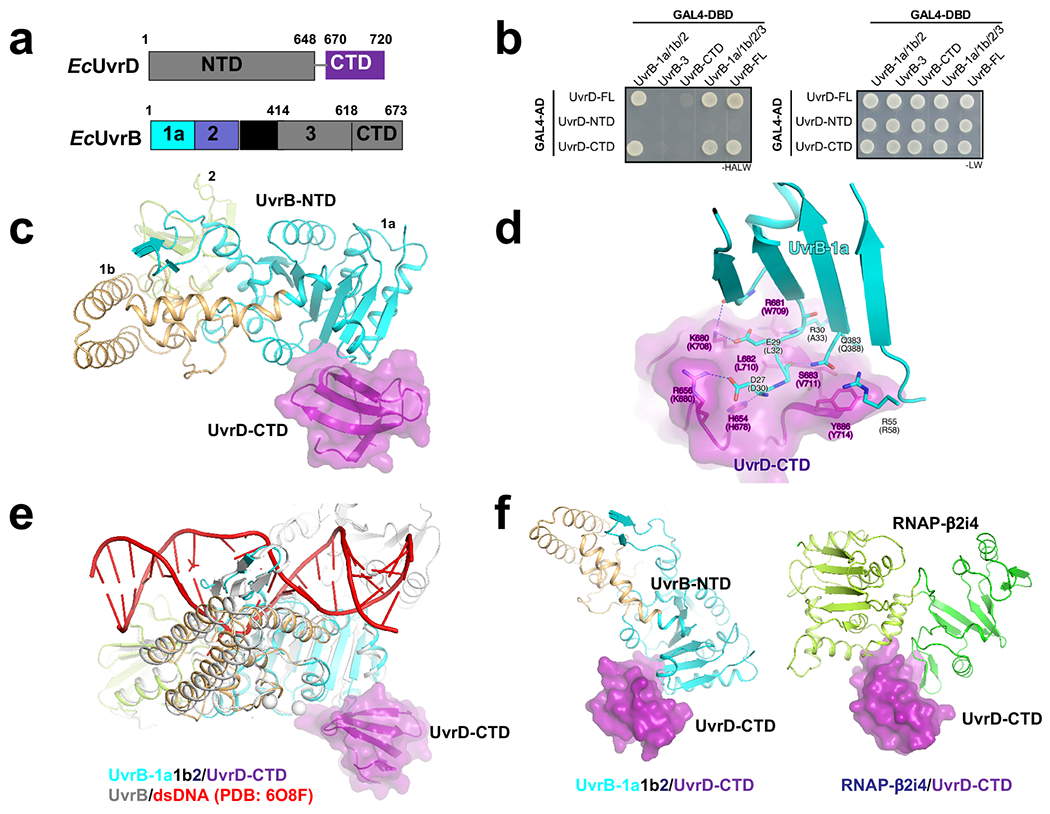
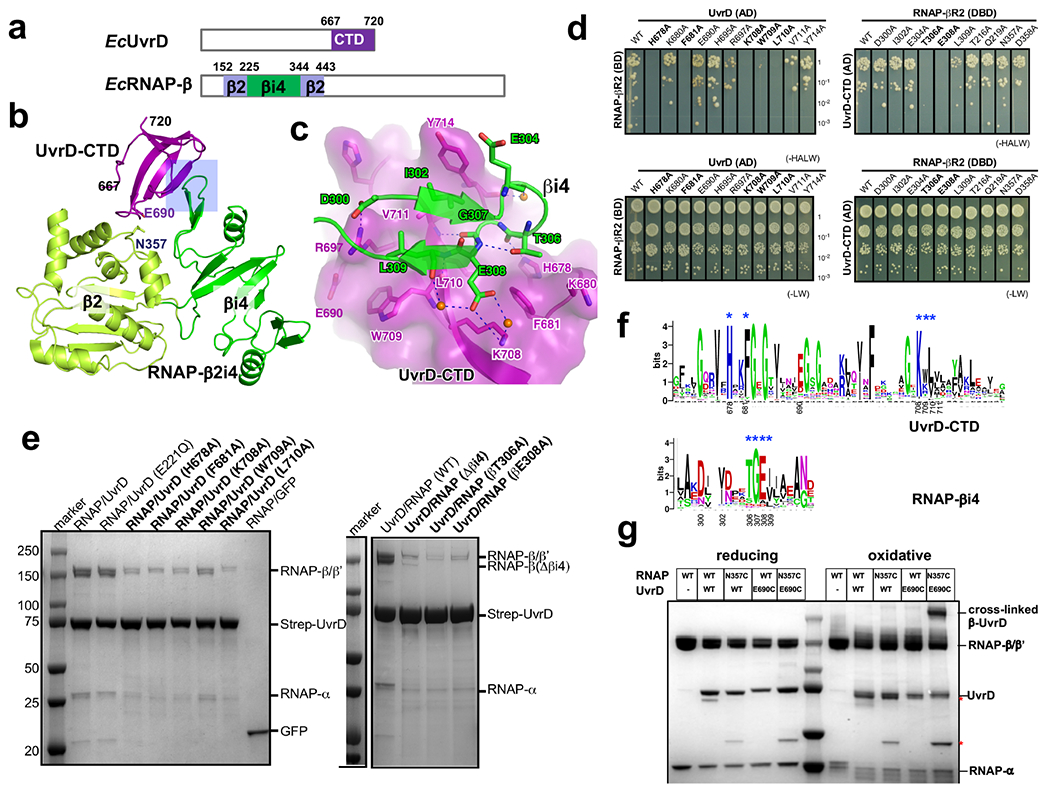
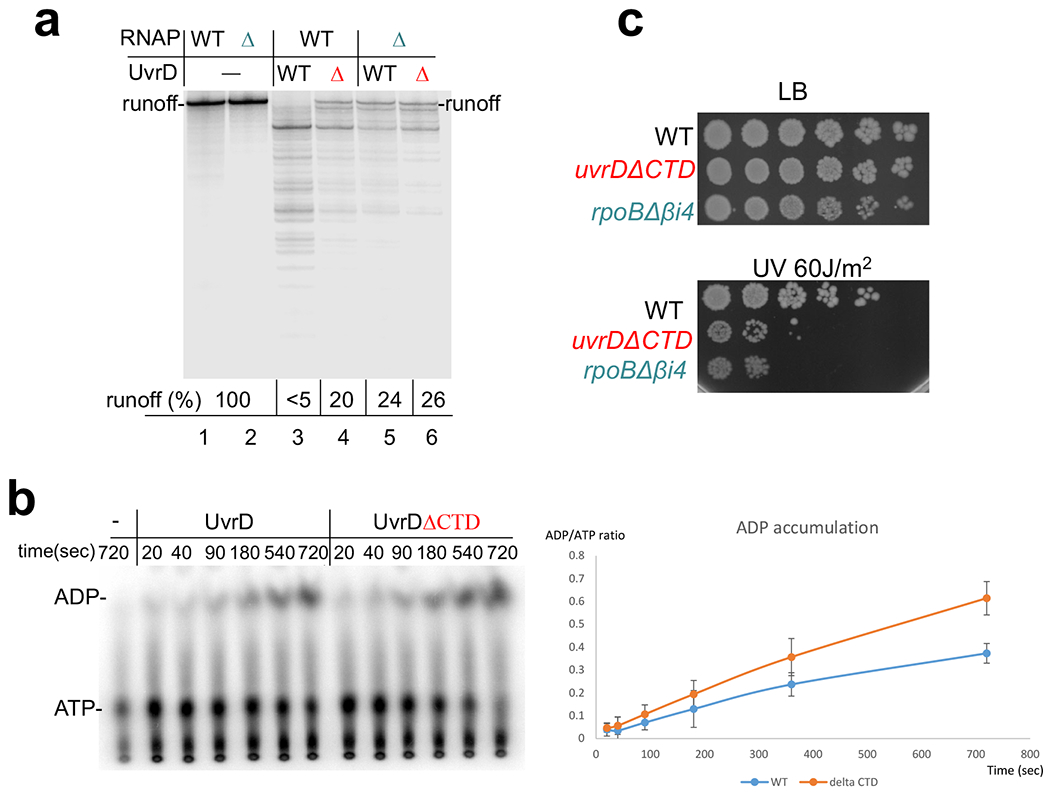
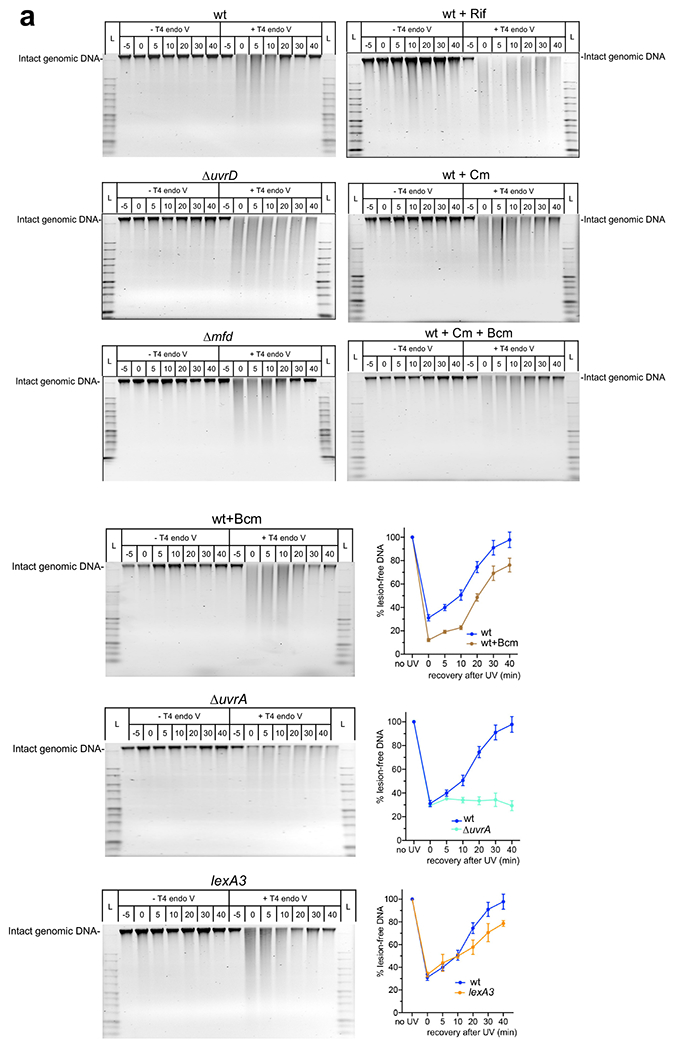
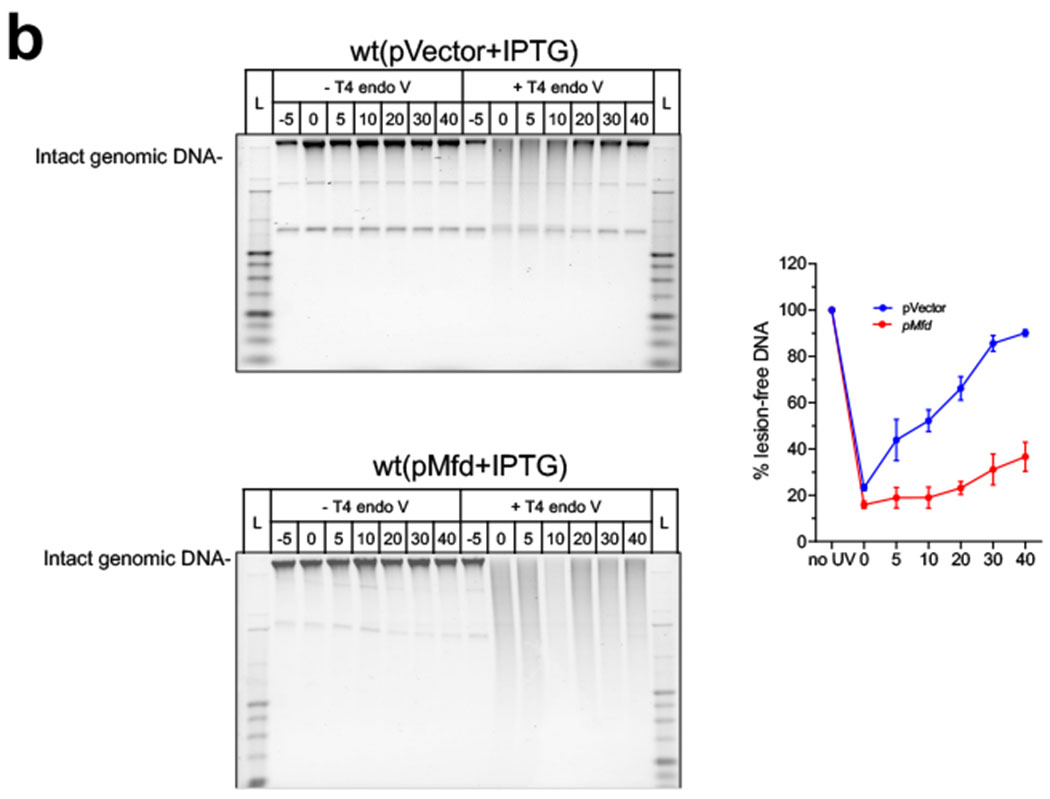
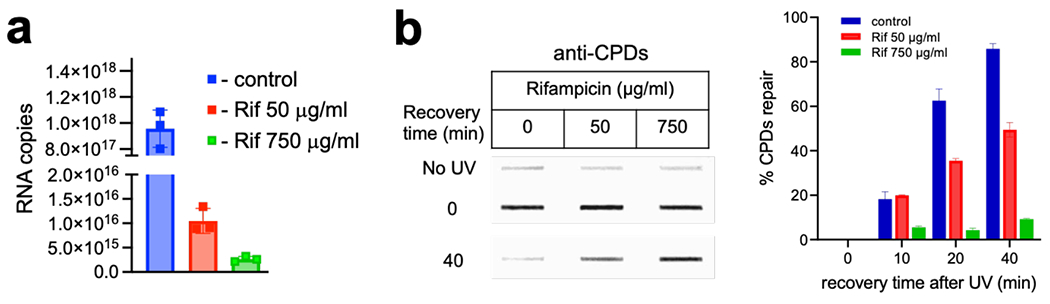
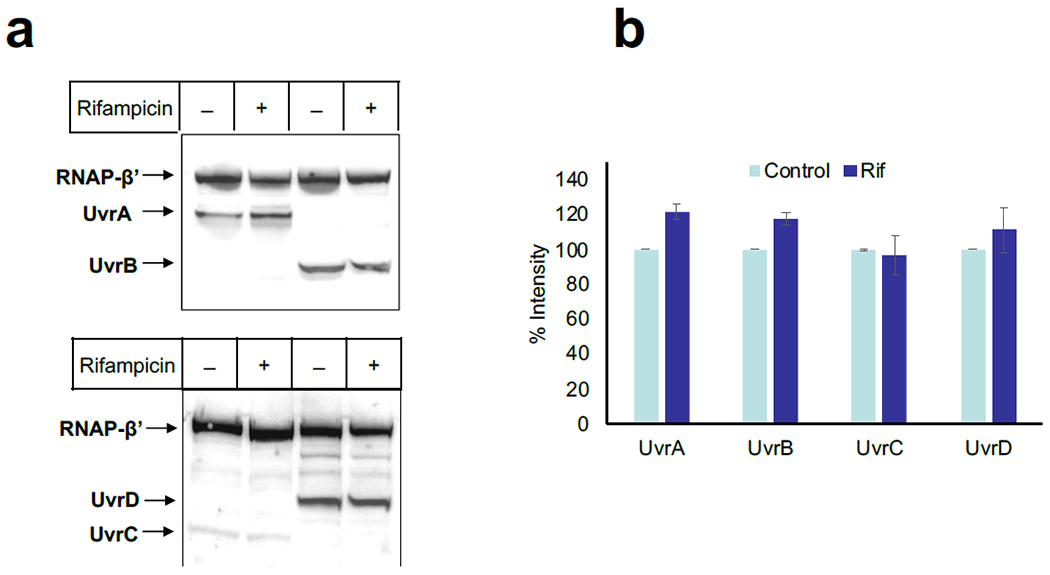
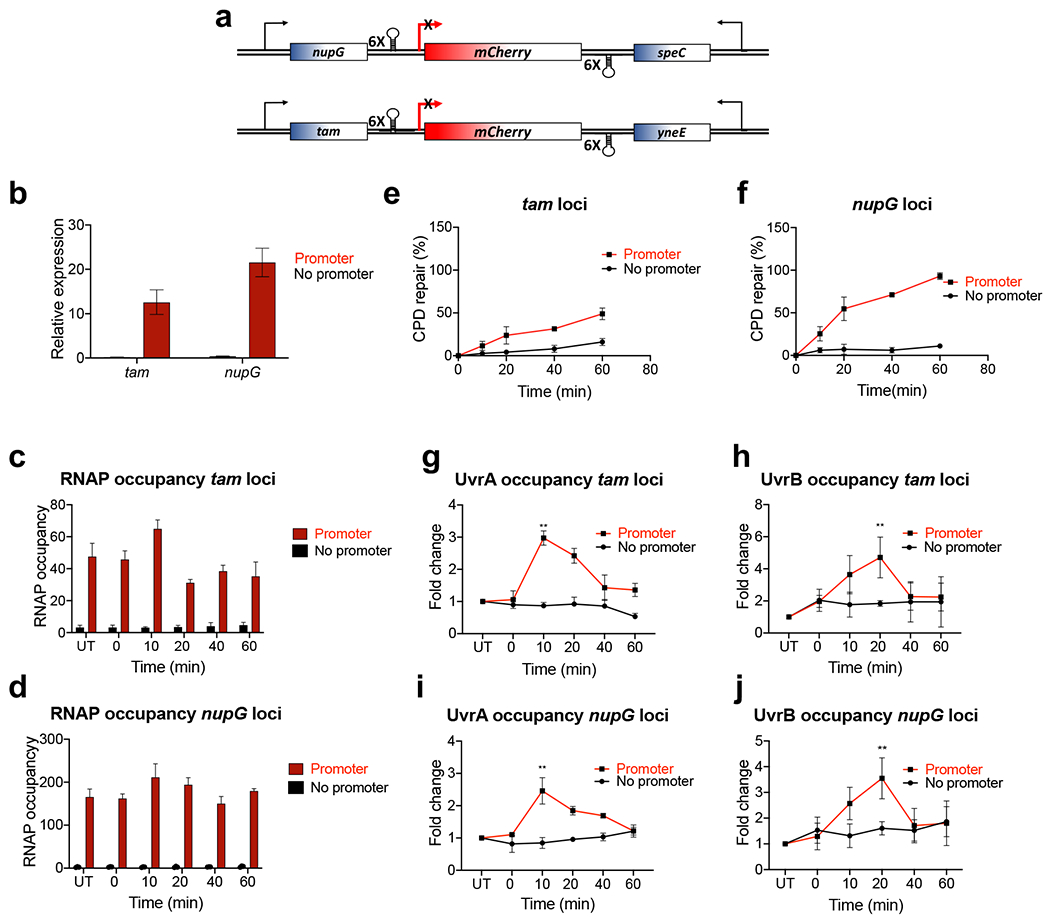
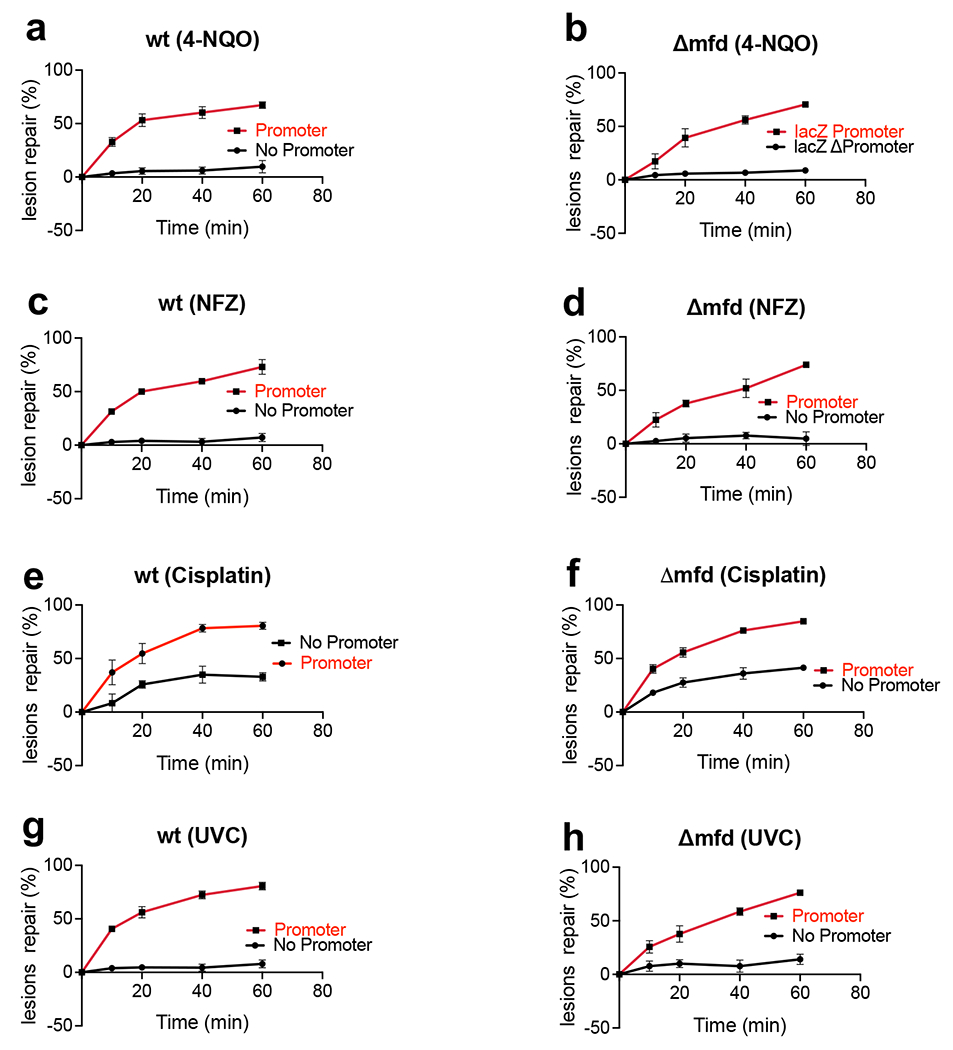
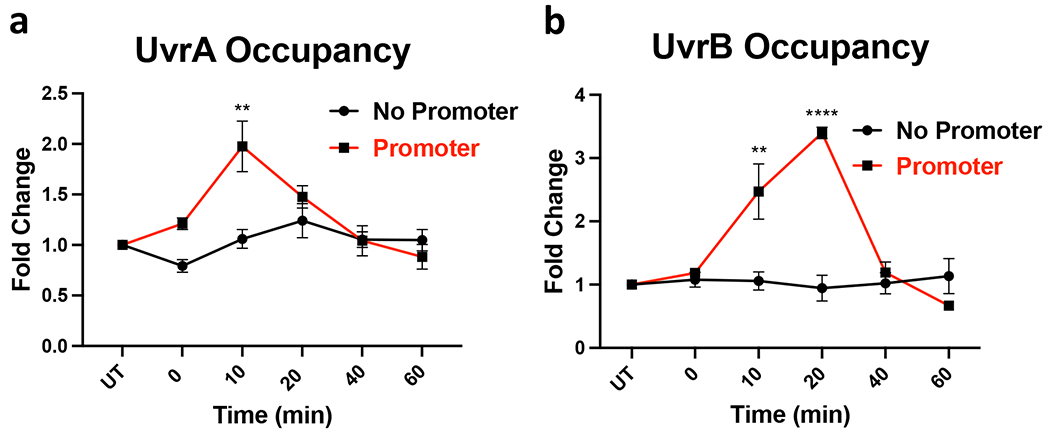
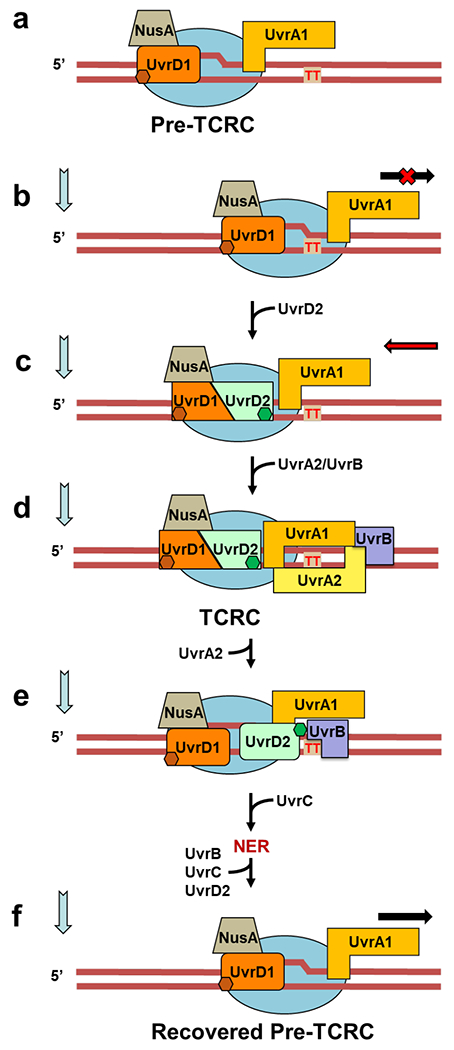
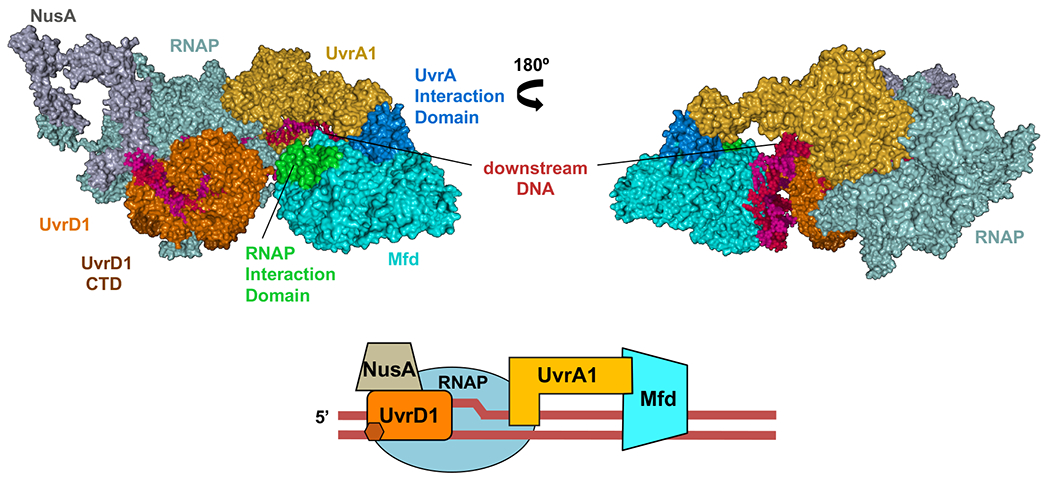
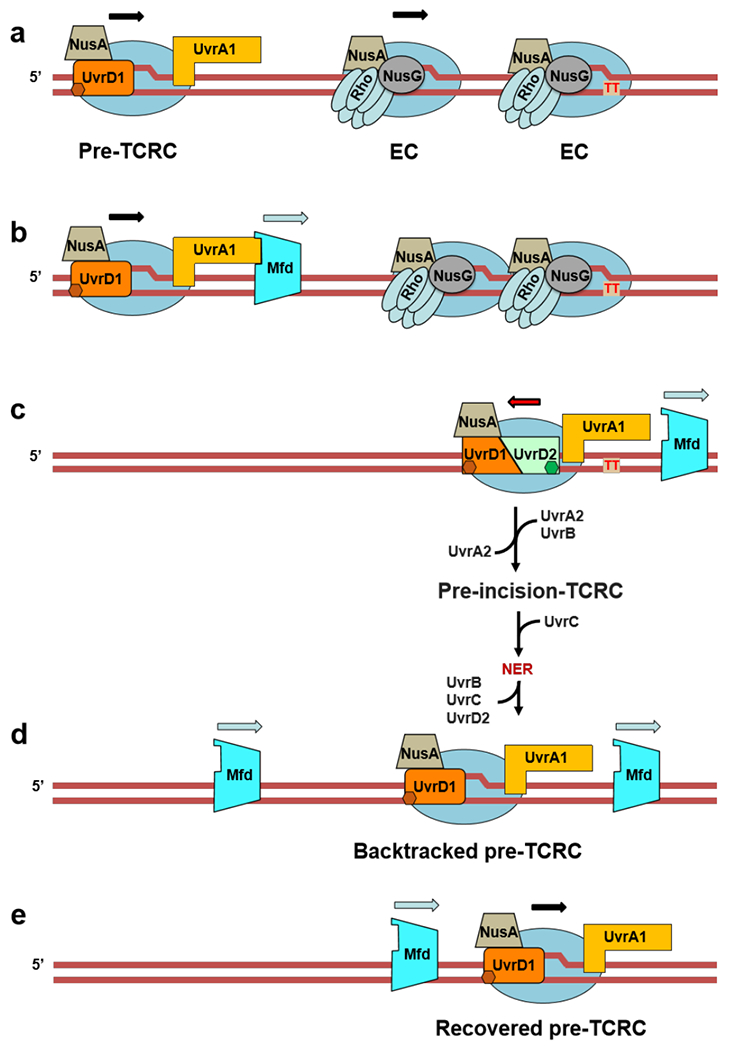
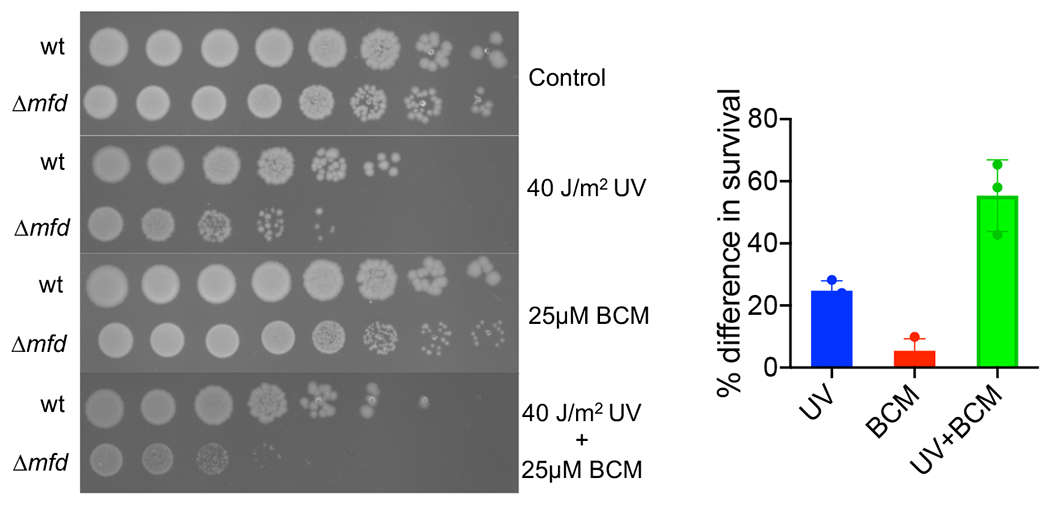
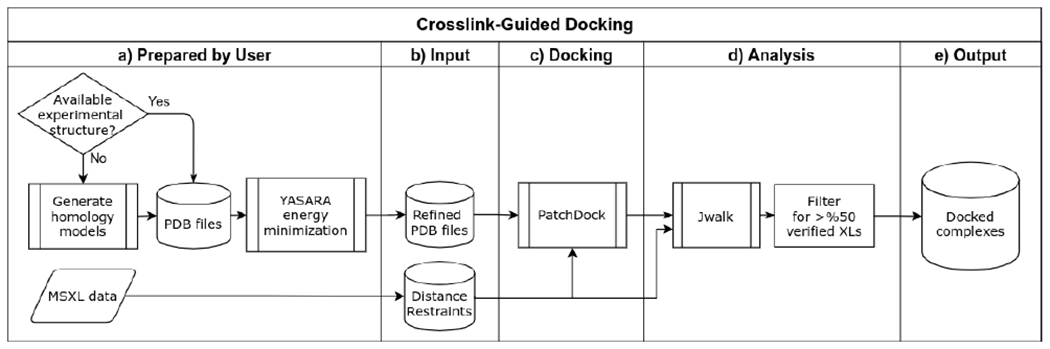
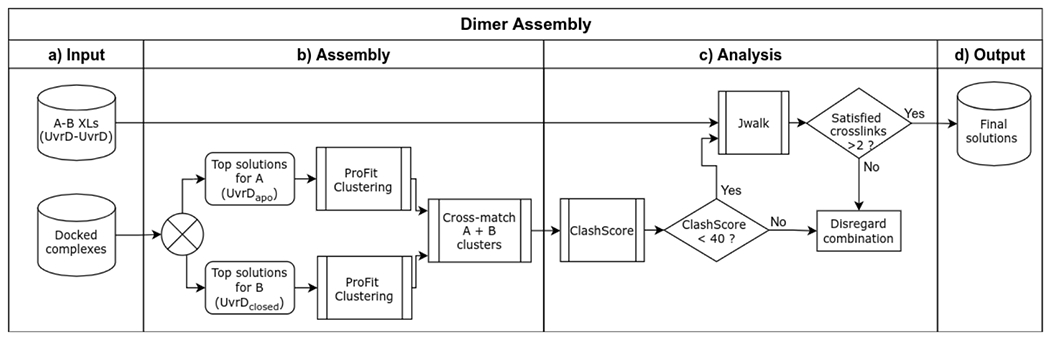
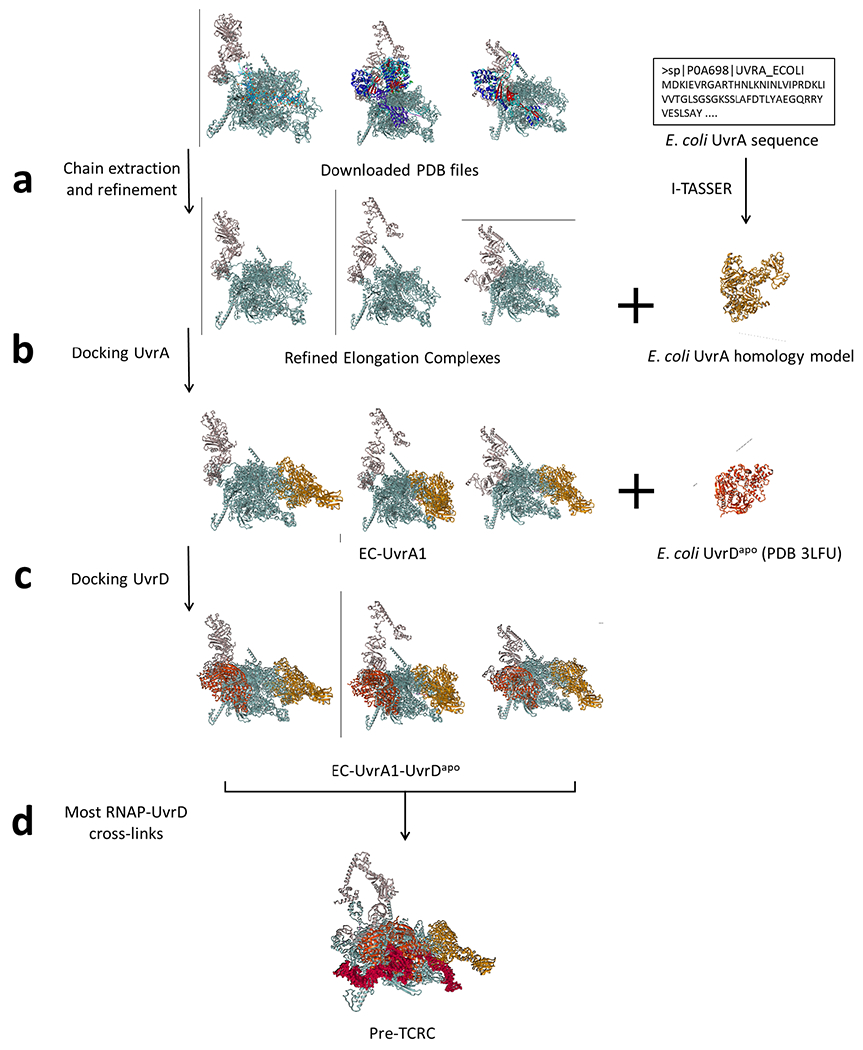
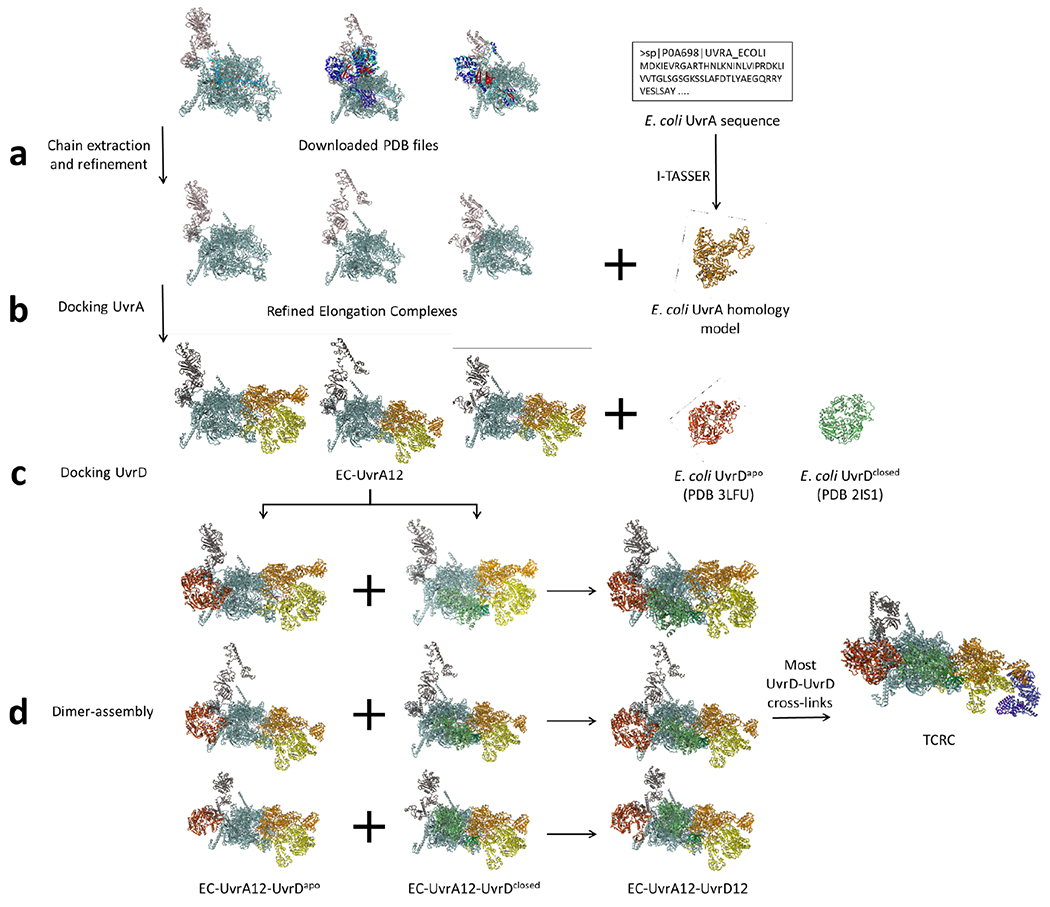
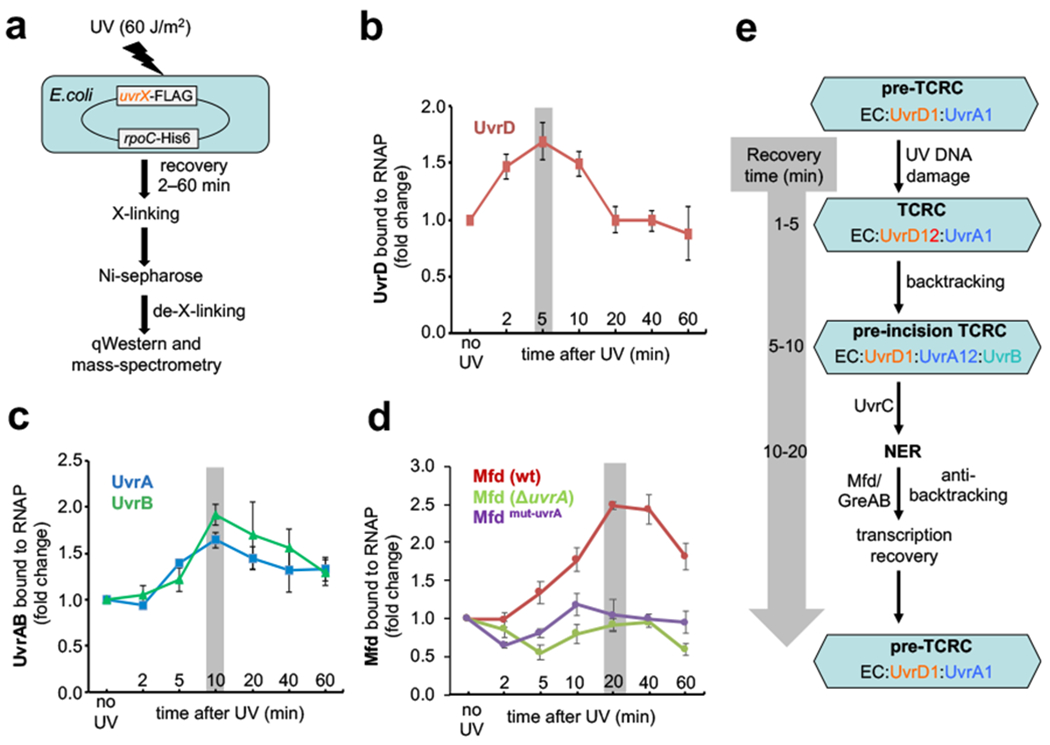
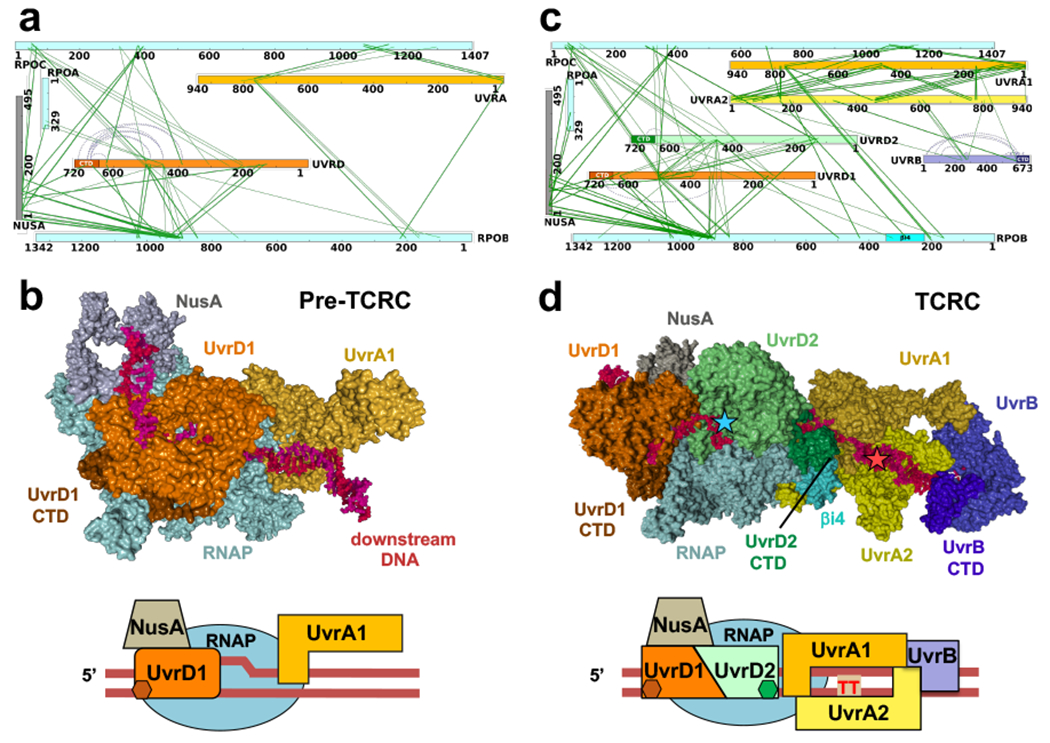
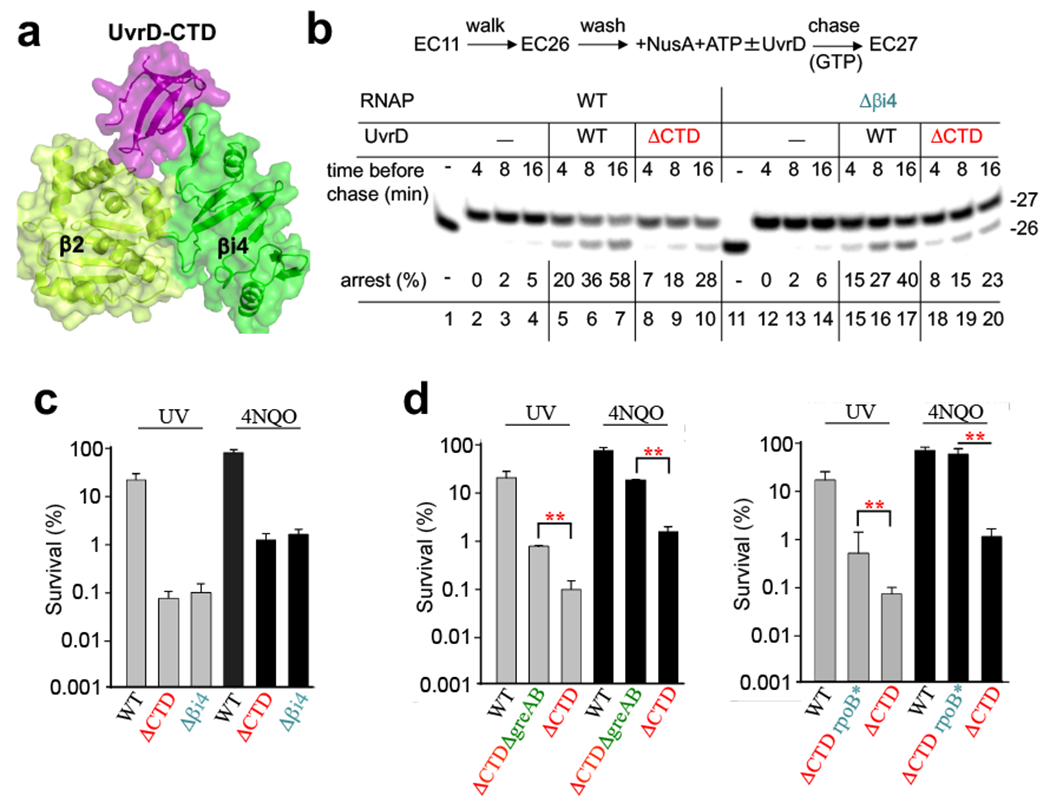
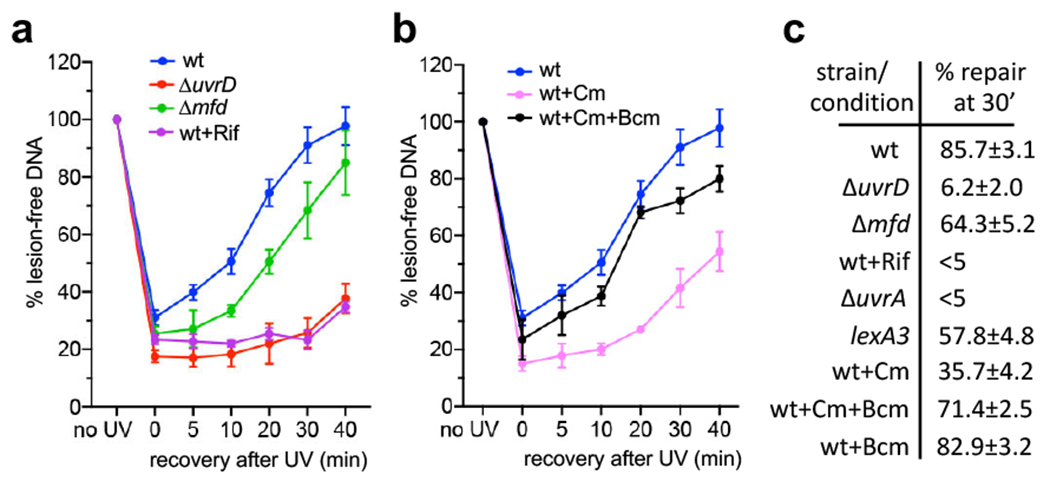
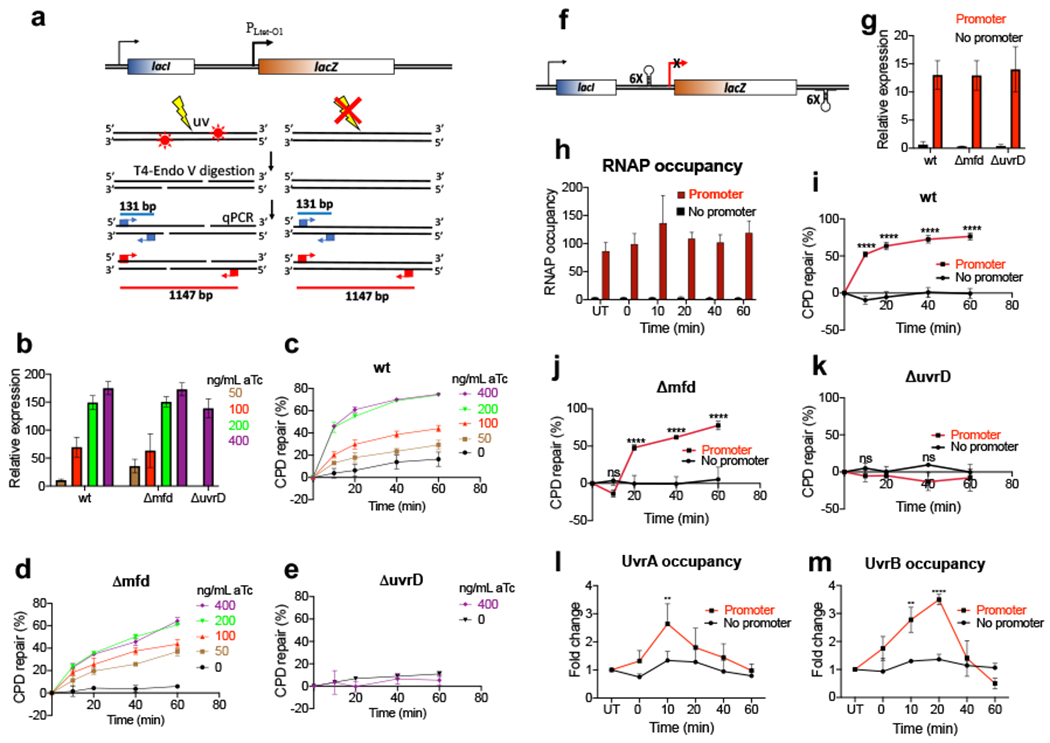
Transcription-coupled DNA repair (TCR) is presumed to be a minor sub-pathway of nucleotide excision repair (NER) in bacteria. Global genomic repair is thought to perform the bulk of repair independently of transcription. TCR is also believed to be mediated exclusively by Mfd-a DNA translocase of a marginal NER phenotype1-3. Here we combined in cellulo cross-linking mass spectrometry with structural, biochemical and genetic approaches to map the interactions within the TCR complex (TCRC) and to determine the actual sequence of events that leads to NER in vivo. We show that RNA polymerase (RNAP) serves as the primary sensor of DNA damage and acts as a platform for the recruitment of NER enzymes. UvrA and UvrD associate with RNAP continuously, forming a surveillance pre-TCRC. In response to DNA damage, pre-TCRC recruits a second UvrD monomer to form a helicase-competent UvrD dimer that promotes backtracking of the TCRC. The weakening of UvrD-RNAP interactions renders cells sensitive to genotoxic stress. TCRC then recruits a second UvrA molecule and UvrB to initiate the repair process. Contrary to the conventional view, we show that TCR accounts for the vast majority of chromosomal repair events; that is, TCR thoroughly dominates over global genomic repair. We also show that TCR is largely independent of Mfd. We propose that Mfd has an indirect role in this process: it participates in removing obstructive RNAPs in front of TCRCs and also in recovering TCRCs from backtracking after repair has been completed.


Conflict of interest statement

Competing interests: The authors declare no competing interests.

Figures

Extended Data Fig. 1.
Extended Data Fig. 1.. UV sensitivity of E. coli strains used in Fig. 1.
Representative efficiencies of colony formation of parent wt (MG1655) and mutant E. coli cells exposed to the indicated UV doses. Overnight cultures were diluted 1:100 with fresh LB and grown to ~ 2x10⁷. Cells were serially diluted, plated on LB agar, irradiated with UV, and incubated at 37 °C for 24 h.
Extended Data Fig. 2.
Extended Data Fig. 2.. Quantitation of UvrABD binding to RNAP in vivo.
a, Representative Western blots used to generate the plots of Fig. 1b–d. b, Quantitative mass-spectrometry analysis of RNAP-associated UvrABD, Mfd, and Rho in the exponentially grown cells prior to genotoxic stress. RNAP pulldown samples were prepared as in Fig. 1. Values are normalized to that of NusA-containing RNAPs, thus reflecting the RNAP molecules engaged in elongation in vivo.
Extended Data Fig. 3.
Extended Data Fig. 3.. Reconstitution of the TCRC without nucleic acids.
a, Isolation of the RNAP:NusA:UvrABD complex by SEC. SDS-Coomassie gel represents the protein fraction eluted from the main peak (P). b, DLS analysis of the RNAP:NusA:UvrABD complex. “P” fraction from (a) was subjected to DLS. Raleigh sphere (R) estimate of the complex molecular weight (MW = 908 kD), which deviates by only 1.7% from the theoretical MW of a uniform monodispersed complex containing 1 RNAP, 1 NusA, 2 UvrD, 2 UvrA, and 1 UvrB molecules, c, Network view of the highly confident non-redundant inter-protein crosslinks. Crosslinks were aggregated from DSS datasets (Supplementary Table 1). d, XLMS-based model of the reconstituted RNAP:NusA:UvrABD complex. The model was built based on the in vitro crosslinks using PatchDock and the workflow described in Extended Data Figs. 18, 19, and Methods.
Extended Data Fig. 4.
Extended Data Fig. 4.. Mapping UvrD-EC interactions in vitro.
a, Isolation of the EC:NusA:UvrD complex by size exclusion chromatography (SEC). SDS-Coomassie gel represents the protein fraction eluted from the main SEC peak (P). b, Dynamic light scattering (DLS) analysis of the EC:NusA:UvrD complex. “P” fraction from (a) was subjected to DLS. Raleigh sphere (R) estimate of the complex molecular weight (MW = 583 kD), which deviates by only 4.2% from the theoretical MW of a uniform monodispersed complex containing 1 RNAP, 1 NusA, and 2 UvrD molecules, c, Network view of the highly confident non-redundant inter-protein crosslinks between RNAP subunits, NusA, and UvrD. Crosslinks were aggregated from DSS datasets (Supplementary Table 1). d, XLMS-based model of the RNAP:NusA:UvrD complex. The model was built based on the in vitro crosslinks using PatchDock and the workflow described in Extended Data Figs. 18, 19, and Methods. The model shows the positioning of UvrD monomers relative to the transcription bubble. Blue star indicates the DNA-UvrD crosslink previously mapped in the EC. CTD of UvrD2 is shown by green hexagon. RNA is not shown.
Extended Data Fig. 5.
Extended Data Fig. 5.. Structural analysis of the interaction between UvrD-CTD and UvrB.
a, UvrD and UvrB domains (numbered as in E. coli). The domains observed in crystal structure are highlighted in colors. b, UvrD-CTD interacts with UvrB-1a/1b/2domain (or UvrD-NTD), consistent with a previous report. E. coli UvrD (full-length or truncated) and UvrB (full-length or truncated) were fused to GAL4-AD and GAL4-DBD, respectively. The potential interactions were selected on SD (-HALW) plates, and the growth on SD (-LW) plates was used as input control. c, A 2.6-Å crystal structure of T. thermophilus UvrD-CTD/UvrB-NTD complex (PDB 7EGT). UvrB-1a docks on a shallow groove of UvrD-CTD. UvrD-CTD, UvrB-1a, UvrB-1b, and UvrB-2 are colored in purple, cyan, orange, and light green, respectively. d, The detailed interaction between UvrD-CTD and UvrB-1a. Residues H654, R656, K680, R681, S683 of UvrD-CTD makes a H-bond network with residues D27, E29, R30, Q383 of UvrB-1a (residues are labeled and numbered as in T. thermophilus; the corresponding residues in E. coli are indicated in parentheses). Y686 of UvrD-CTD makes stacking interaction with R55 and Q383 of UvrB-1a. e, Structural superimposition of UvrB-NTD/UvrD-CTD complex (colored as above) and UvrB/dsDNA complex (gray and red; PDB 6O8F) shows that UvrD-CTD binds the opposite surface of UvrB dsDNA-loading cleft, implicating UvrD doesn’t affect dsDNA loading of UvrB. f, Structural comparison between UvrD-CTD/UvrB-NTD (left) and UvrD-CTD/RNAP-β2i4 (right, PDB 7EGS) shows that UvrB and RNAP-β2i4 binds at the same cleft of UvrD-CTD, and thereby suggests that the interactions of UvrB and RNAP to UvrD are mutually exclusive.
Extended Data Fig. 6.
Extended Data Fig. 6.. Structural analysis of the interaction between UvrD-CTD and RNAP.
a, UvrD and RNAP β subunit domains observed in crystals structure were colored and labeled. b, The overall structure of the UvrD-CTD/RNAP-β2i4 (PDB 7EGS) binary complex. The major interface is highlighted by a rectangle. The ‘N’ and ‘C’ termini of UvrD-CTD are numbered. c, Detailed interactions between UvrD-CTD and RNAP-β2i4. Oxygen, nitrogen, and water atoms are colored in red, blue, and orange, respectively. Blue dash, H-bond. d, YTH results show that alanine substitution of interface residues on UvrD-CTD or βi4 impairs the interaction of UvrD and RNAP β pincer. The potential interactions were selected on SD (-HALW) plates, and the growth on SD (-LW) plates was used as input control, e, Strep-tag pull down results show that alanine substitution of interface residues of UvrD-CTD or βi4 impairs interaction between RNAP and UvrD. f, Sequence alignments of UvrD-CTD and RNAP-β2i4 from 316 non-redundant proteobacteria that contain βi4 insertion on RNAP. The key interface residues were labeled with blue asterisks and numbered as in E. coli. g, Cys pair cross-linking results demonstrate direct proximity of UvrD-CTD and RNAP-βi4. The wild-type or mutated UvrD-RNAP complexes were incubated in oxidative (CuCl2) or reducing (DTT) condition and separated by SDS-PAGE. The asterisk marks two major impurity bands. The position of residues E690 of UvrD and N357 of RNAP β2 are labeled in (b).
Extended Data Fig. 7.
Extended Data Fig. 7.. Functional analysis of UvrDΔCTD and RNAPΔβi4.
a, Deletions of the CTD of UvrD or βi4 of RNAP partially compromise UvrD-mediated backtracking. EC20 was formed by the wt RNAP or RNAP lacking βi4 (green Δ) (lanes 13 to 18) at the T7A1 DNA template and then chased in the presence of specified amounts of UvrD (red Δ). The pro-backtracking activity of UvrD was assessed as a ratio (%) between the amount of full length (runoff) product and total amounts of RNA products located below the runoff. Majority of these products are the result of UvrD-mediated backtracking and sensitive to transcript cleavage by GreB,. b, Deletion of the CTD does not compromise UvrD catalytic activity. The autoradiogram shows the thin layer chromatography (TLC) plate of UvrD-mediated ATP hydrolysis. The reaction was performed using polyC single stranded DNA template as described in Methods. The means ± SE from three experiments are plotted on the right. c, uvrDΔCTD and Δβi4 cells are equally more sensitive to genotoxic stress as compared to wt. Representative efficiencies of colony formation of wt (MG1655) and mutant cells following treatment with the indicated dose of UV irradiation. Cells were grown to OD600 ~0.4 and serial 10-fold dilutions were spotted on LB agar plates followed by UV irradiation and incubation in the dark at 37 °C for 24 h.
Extended Data Fig. 8.
Extended Data Fig. 8.. Global NER fully depends on ongoing transcription and UvrD, but not Mfd (supplemental to Fig. 4).
a, Wild-type (wt) and mutant cells were UV irradiated at 50 J/m2 and allowed to recover. At the indicated times, genomic DNA was isolated and either treated with T4endoV or mock treated for 30 min at 37 °C and then analyzed on alkali-agarose gels. Rifampicin (Rif; 750 μg/ml), chloramphenicol (Cm; 200 μg/ml) and/or bicyclomycin (Bcm; 25 μg/ml) were added 30 min prior to UV irradiation (see Methods). Representative gels are shown for each analyzed strain and condition. The percentage of repaired (lesion-free) DNA in T4endoV-treated samples is plotted for each time point relative to untreated samples (see Fig. 4). Data are the mean ± SEM from at least three independent experiments, b, Mfd overexpression interferes with global NER. The wt cells harboring pMfd and the “empty” vector control (pCA24N) were induced with 0.1 mM IPTG followed by UV irradiation and recovery. The percentage of repaired (lesion-free) DNA in T4endoV-treated samples is plotted for each time point relative to untreated samples. Data are the mean ± SEM from at least three independent experiments.
Extended Data Fig. 9.
Extended Data Fig. 9.. Effects of high (750 μg/ml) and low (50 μg/ml) Rif on E. coli transcription and NER.
a, Inhibition of chromosomal lacZ transcription by Rif. Copies/μL cDNA of lacZ transcripts was determined using absolute quantification (see Methods). A standard curve was generated using lacZ PCR product (1016 to 1023). RT-qPCR was performed using cDNA isolated from bacterial cultures treated with indicated concentrations of Rif. Number of copies of lacZ transcripts was determined by interpolation. Values are the means ± SD (n = 3). b, Inhibition of CPDs repair by high and low Rif. (Left panel) Representative slot blot probed by fluorescently labeled secondary antibody to reveal binding of primary monoclonal CPD-specific antibodies (see Methods). (Right panel) Quantitative analysis of slot blot images for the indicated recovery time points post-UV. Bars, standard errors of the means from 3 independent experiments.
Extended Data Fig. 10.
Extended Data Fig. 10.. Rifampicin does not compromise the level of NER enzymes during the time of the experiment (supplemental to Fig. 4).
a, Representative Western blots of intracellular UvrABCD proteins during the time of Rif treatment (Fig. 4) and their quantitation (b). Data are the mean ± SEM from at least three independent experiments.
Extended Data Fig. 11.
Extended Data Fig. 11.. Local transcription enables NER (extension to Fig. 5).
a-d, Depriving the genomic loci of transcription abolishes their NER. a, Schematics of the mCherry insulators. A transcription unit containing mCherry (with or without lacZ promoter) flanked by the terminator cassettes was inserted at the tam and nupG loci. b-d The expression of mCherry from the insulators (b) and RNAP occupancy (c, d) upon IPTG induction, as determined by RT-qPCR and ChIP-qPCR, respectively. Values are the means ± SD (n = 3). e,f CPD repair within the insulators. Most of NER strictly depends on promoter-initiated transcription. The levels of transcription and NER are stronger within the nupG insulator comparing to the tam insulator. Cells were induced with IPTG followed by UV irradiation (40 J/m2) and recovery in the dark for the indicated time intervals. CPD density was determined by SLR-qPCR as in Fig. 5a and used to calculate the percentage of repaired CPDs. Values are the means ± SD (n = 3). g-j, UvrAB recruitment to the UV-damaged DNA strictly depends on local transcription in both tam and nupG loci. Occupancy of RNAP (c,d), UvrA (g,i) and UvrB (h,j) following UV irradiation was determined by ChIP-qPCR. Cells were induced with IPTG followed by UV irradiation (40 J/m2) and recovery for the indicated time intervals. Values are the means ± SD (n = 3). Results are shown as a fold change in the occupancy of UvrAB within the insulator following UV irradiation. UT – untreated. Values are means ± SD (n = 3). **P < 0.01, ****P < 0.0001 (Student’s t test; equal variance). P values compare the percentage of DNA repair between “promoter” and “no promoter” strains for a given time point.
Extended Data Fig. 12.
Extended Data Fig. 12.. Local transcription enables NER irrespective of Mfd (extension to Fig. 5).
a-h, Depriving the genomic loci of transcription drastically diminished NER irrespective of Mfd. Genomic DNA repair within the insulator was monitored as described in Methods for the lesions generated by 4-NQO (a-b), NFZ (c-d), cisplatin (e-f), or UV-C (g-h). lacZ was induced with IPTG followed by the exposure to drugs or UV radiation. Cells were allowed to recover for the indicated time intervals followed by the isolation of genomic DNA. Lesion density was determined by SLR-qPCR and used to calculate the percentage of repaired lesions. Values are the means ± SD (n = 3).
Extended Data Fig. 13.
Extended Data Fig. 13.. UvrAB recruitment to the UV-damaged DNA strictly depends on local transcription, but not Mfd (compare to Fig. 5l,m).
Recruitment of UvrA (a) and UvrB (b) to the lacZ insulator (with or without promoter) was determined by ChIP-qPCR in Δmfd cell as in Fig. 5h. Results are shown as a fold change in the occupancy of UvrAB within the insulator of Δmfd cells following UV irradiation. **P < 0.01, ****P < 0.0001 (Student’s t test; equal variance).
Extended Data Fig. 14.
Extended Data Fig. 14.. Integrated model of TCR (see also Movie 2).
Based on the in vivo and in vitro data presented, we propose a structure-functional model of NER in E. coli in which the elongating RNAP functions as the primary lesion scanner and platform for the assembly of active NER complexes. a, A subpopulation of elongating RNAPs persistently interacts with UvrD1 and UvrA1, as shown in the structural model of Fig. 2b. The in vivo RNAP pulldowns and XLMS demonstrate that such surveillance pre-TCRCs can form even before the genotoxic stress. b,c, Upon stalling at the DNA lesion in the template strand (CPD is marked as red “TT”), the pre-TCRC recruits UvrD2 to form a helicase competent UvrD dimer. UvrD2-CTD (green hexagon) interacts with a RNAP βi4 domain to stabilize the UvrD dimer. UvrD12 pulls TCRC backward, thereby exposing a CPD to the NER enzymes. ppGpp contributes at this stage by rendering RNAP backtracking-prone. d, TCRC recruits UvrA2/UvrB to initiate the lesion processing. While a single UvrB monomer is sufficient for lesion verification and UvrC recruitment,,, the second UvrB molecule may be recruited as well,,. In vitro (Extended Data Fig. 3) and in vivo XLMS (Fig. 2c,d) are consistent with a single UvrB monomer model. This UvrB can interact with the CTD of UvrD2 (Extended Data Fig. 5), thereby displacing UvrD2 from RNAP (Movie 2). The release of UvrD2 that occurs coincidentally with the UvrA2B recruitment (Fig. 1b,c) supports such a sequence of events in vivo. UvrD2 displacement would abrogate any further UvrD-mediated backtracking, e, The pre-incision TCRC recruits UvrC and releases UvrA2B followed by the NER execution step,. Once repair has been completed, the backtracked pre-TCRC is promptly recovered by the anti-backtracking factors (GreB, Mfd, and a leading ribosome) to resume elongation.
Extended Data Fig. 15.
Extended Data Fig. 15.. A model for Mfd recruitment by UvrA to the pre-TCRC.
(top) E. coli Mfd (color: cyan) bound to double-stranded DNA (PDB 6XEO) is shown interacting with UvrA in the pre-TCRC, by structural alignment to the E. coli UvrA-Mfd core interaction complex (PDB 4DFC). The UvrA binding domain of Mfd (color: blue) is fully unmasked upon initial DNA binding, allowing it to be located by the pre-TCRC (Extended Data Fig. 16 and Movie 3). RNAP-binding domain of Mfd (green) is facing downstream to eventually interact with RNAPs stalled/paused ahead of the pre-TCRC and terminate or rescue them from the backtracked state. Illustrative cartoon (bottom). RNA is not shown.
Extended Data Fig. 16.
Extended Data Fig. 16.. Role of Mfd in TCR (see also Movie 3 and Extended Data Fig 15).
We propose that the modest contribution of Mfd to NER (Fig. 4a) is due to its ability to terminate multiple queuing ECs in front of TCRCs, thereby helping to “clean up” space between the TCRCs and DNA lesions at highly expressed genes. a,b, UvrA of the pre-TCRC facilitates Mfd recruitment and/or its transition to a processive translocase (Fig. 1d). Mfd then translocates forward (downstream of the TCRC) to “push” and terminate multiple ECs between the TCRC and CPD (red “TT”). This directionality ensures that Mfd preferentially terminates non-TCR complexes, thereby facilitating TCRC access to the sites of damage. c, TCR proceeds as described in Extended Data Fig. 14. d, Mfd continues to be recruited during the recovery phase, even after most repair has been completed (Fig. 1d). These additional Mfd molecules can now also reactivate backtracked complexes, hence the role of Mfd in facilitating transcription recovery post-UV This model explains why a delay in NER in the Mfd-deficient cells occurs only within the most highly transcribed (most congested) regions and why NER of less actively transcribed regions is indifferent to, or even compromised by, Mfd activity,. It also explains why the overexpression of Mfd is so detrimental to NER (Extended Data Fig. 8b): excessive Mfd would prematurely terminate both ECs and TCRCs, thereby abolishing repair. Finally, the model also explains why mfd cells become more sensitive to genotoxic stress in the presence of Rho inhibitor BCM (Extended Data Fig. 17). Rho, like Mfd, can terminate ECs that obscure the lesion sites from TCRCs. If both termination factors were inactivated, there is no obvious solution to this problem.
Extended Data Fig. 17.
Extended Data Fig. 17.. Rho inactivation enhances Mfd sensitivity to UV.
a, Representative efficiencies of colony formation of wild-type (MG1655) and Δmfd cells on LB agar, LB agar exposed to 40 J/m2 of UV, 25 μM bicyclomycin (BCM) and 25 μM BCM with 40 J/m2 of UV. Cells were spotted on LB agar plates in serial tenfold dilutions and incubated at 37 °C for 24 h. b, Data from three independent experiments was used to calculate percent difference in survival between wt and Δmfd cells. Values are means ± SD.
Extended Data Fig. 18.
Extended Data Fig. 18.. An outline of the automated workflow for crosslink-guided docking.
a,b, Coordinate files for all the E. coli interactors used to build the pre-TCRC and TCRC are prepared using available PDB structures, which were refined using YASARA Structure (see Methods). Proteins without available PDB structures were homology-modeled using I-TASSER,. XLMS data was converted to the distance restrains compatible with PatchDock. c, PDB files of receptor and ligand molecules were submitted to PatchDock with their corresponding distance restrains for rigid-body docking. d, The docking results were validated by examining the crosslink satisfaction using Jwalk (see Methods).
Extended Data Fig. 19.
Extended Data Fig. 19.. An overview of the automated dimer-assembly workflow.
Two monomer models (X and Y), previously and separately docked to a common receptor model (R), are combined to generate receptor-dimer models that satisfy the highest number of crosslinks between the two monomers. a,b, Top docking poses for each monomer (R-X and R-Y) are clustered to eliminate redundancies and accelerate subsequent steps. c, Representative models obtained by clustering each of the two groups are cross-matched to generate combined receptor-dimer coordinate files (R-X-Y), and analyzed for cross-links satisfied between X-Y using Jwalk. d, receptor-dimer models satisfying >2 cross-links are ranked by number and average distance of satisfied X-Y cross-links for further analysis.
Extended Data Fig. 20.
Extended Data Fig. 20.. Application of the docking pipeline to model the pre-TCRC.
a, PDB files of E. coli elongation complexes were downloaded and prepared by extracting chains corresponding to RNAP subunits and NusA, then refined using the energy-minimization protocol included in YASARA Structure. E. coli UvrA was modeled using the homology template server I-TASSER. b, UvrA (ligand) was docked to ECs (receptors) from the previous step using PatchDock, with the RNAP-UvrA crosslinks provided as distance restraints. c, The PDB coordinates file of E. coli UvrD in the apo form was trimmed to the first 640 residues and refined using YASARA Structure, then docked to the top EC-UvrA complexes generated in the previous step, as ranked by RNAP-UvrA crosslink satisfaction. d, EC-UvrA-UvrD complexes generated in the previous step were ranked by RNAP-UvrD crosslink satisfaction and used as receptors to dock UvrD-CTD. Results were clustered using ProFit (V3.1), and finally analyzed for alignment of UvrAD DNA-binding regions with the DNA path in the EC.
Extended Data Fig. 21.
Extended Data Fig. 21.. Application of the docking pipeline and dimer assembly component to model the TCRC.
a, PDB files of E. coli ECs were downloaded and prepared by extracting chains corresponding to RNAP subunits and NusA, then refined using the energy-minimization protocol included in YASARA Structure. E. coli UvrA was modeled using the homology template server I-TASSER. b, UvrA1 (ligand) was docked to the ECs (receptors) from the previous step using PatchDock, with RNAP-UvrA crosslinks provided as distance restraints. Docking was repeated using EC-UvrA1 complexes as receptors and additional UvrA-UvrA distance restraints to generate EC-UvrA12 complexes. c, PDB coordinate files of E. coli UvrD in the apo and closed forms were trimmed to the first 640 residues and refined using YASARA Structure, then docked separately to the top EC-UvrA12 complexes generated in the previous step, as ranked by RNAP-UvrA and UvrA-UvrA crosslink satisfaction. d, Top EC-UvrA12-UvrD complexes generated in the previous step were divided into two groups based on the docked UvrD model (apo vs. closed), and used as input to the dimer-assembly component described in Methods and Extended Data Fig. 18. UvrD poses from the two groups were cross-matched to generate EC-UvrA12-UvrD12 complexes, analyzed for UvrD-UvrD crosslink satisfaction and steric clashes, and used as receptors to dock UvrD1-CTD. Results were clustered using ProFit (V3.1) and analyzed for agreement with UvrA-dimer structures and alignment of Uvr DNA-binding regions with the DNA path in the EC. Final complexes were refined with YASARA Structure and re-analyzed with Jwalk for crosslink satisfaction.
Fig. 1.
Fig. 1.. Recruitment of NER enzymes and Mfd to RNAP in vivo.
a, Experimental setup to measure the dynamics of UvrABD and Mfd recruitment to RNAP using chromosomal FLAG-tagged UvrABD or Mfd and His6-tagged RNAP. All strains behave as the wild type in UV irradiation tests (Extended Data Fig. 1). b, Relative change in the UvrD binding to RNAP during a recovery from UV irradiation. Gray bar marks the highest level of UvrD recruitment, which occurs at 5 min post-UV. c, Relative change in the UvrA and UvrB binding to RNAP during a recovery from UV irradiation. Gray bar marks the highest level of UvrAB recruitment, which occurs at 10 min post-UV. d, Relative change in the Mfd binding to RNAP during a recovery from UV irradiation in uvrA-proficient (wt) and uvrA-deficient (ΔuvrA) cells. Gray bar marks the highest level of Mfd recruitment, which occurs at 20 min post-UV in wt cells. Values are means ± SD (n≥3). e, Model of E. coli TCR based on the results presented in this work (see the main text).
Fig. 2.
Fig. 2.. Structural organization of the pre-TCR and TCR complexes in cellulo.
a,b, Architecture of the pre-TCRC based on in vivo and in vitro XLMS. a, Network view of highly confident non-redundant inter-protein crosslinks between RNAP subunits, NusA, UvrA, and UvrD. In vivo crosslinks were generated prior to genotoxic stress. Crosslinks were aggregated from DSS and EDC datasets (Supplementary Table 1). b, XLMS-driven pre-TCRC model. The model was built by crosslink-guided docking using PatchDock and the workflow described in Extended Data Fig. 18 and Methods. The cartoon shows the positioning of UvrAD monomers relative to the nucleic acid scaffold and RNAP. CTD of UvrD1 is shown as a brown hexagon. RNA is not shown. c,d, Architecture of the TCRC based on in vivo XLMS. c, Network view of highly confident non-redundant inter-protein crosslinks between RNAP subunits, NusA, UvrA, UvrB, and UvrD. Crosslinks were aggregated from in vitro DSS, in vivo DSS, and EDC datasets generated 20 min after 4NQO treatment (Supplementary Table 1). d, XLMS-driven TCRC model (see also Movie 1). The model was built by crosslink-guided docking using PatchDock and the workflow described in Extended Data Figs. 18, 19, and Methods. The cartoon shows the positioning of UvrABD monomers relative to the nucleic acid scaffold and a hypothetical CPD lesion (TT) in the backtracked TCRC. CTD of UvrD2 is shown as green hexagon. RNA is not shown.
Fig. 3.
Fig. 3.. Structure and function of the UvrD-CTD/RNAP β pincer complex.
a, The crystal structure of UvrD-CTD/RNAP-β2i4 complex. The UvrD-CTD (purple), RNAP-β2 (light green), and RNAP-βi4 (green) domains were shown as cartoon and half-transparent surface. b, Deletions of the CTD of UvrD and βi4 of RNAP partially compromise UvrD-mediated backtracking (arrest formation). Plasmid-born His6-tagged EC11WT or EC11Δβi4 was walked to position 26, NusA+ATP were added followed by the addition of UvrD or UvrDΔCTD. EC26 was incubated for the indicated times prior to its chase with GTP. A fraction of inactivated EC26 is indicated as “%”. c, Chromosomal deletions of UvrD CTD and RNAP βi4 sensitize cells to UV and 4NQO. d, Deleting the anti-backtracking factors GreA and GreB (left panel), or introducing a backtracking-prone rpoB*35 allele (right panel), suppress uvrDΔCTD sensitivity to UV and 4NQO. Values are means ± SD (n≥3), **P <0.01 (Student’s t-test; equal variance).
Fig. 4.
Fig. 4.. Global NER fully depends on ongoing transcription and UvrD, but not Mfd.
a, Transcriptional shutdown by rifampicin (Rif) abolishes NER. Wild type (wt; blue), ΔuvrD (red), and Δmfd (green) cells were briefly UV irradiated at 50 J/m2 and allowed to recover for the indicated times. Wild type cells were also pretreated with high Rif prior to UV irradiation. Rif did not decrease the cellular level of NER enzymes during the time of the experiment (Extended Data Fig. 10). Genomic DNA was isolated and treated with T4 endonuclease V (T4endoV) at the indicated times, and then resolved on alkali-agarose gels. Representative gels are shown in Extended Data Fig. 8. The percentage of repaired (lesion-free) DNA in T4endoV-treated samples is plotted for each time point relative to the untreated samples. Data are the mean ± SEM from at least three independent experiments. b, Chloramphenicol (Cm) delays NER primarily due to excessive Rho-dependent transcription termination, not due to the translational shutdown per se. Experimental setup is as in (a), except that wt cells were pretreated with Cm (pink) or Cm together with bicyclomycin (Bcm; black) prior to UV irradiation. Genomic DNA was isolated and treated with T4endoV at the indicated times, and then resolved on alkali-agarose gels. Representative gels are shown in Extended Data Fig. 8. The percentage of repaired DNA is plotted for each time point relative to the untreated samples. Data are the mean ± SEM from at least three independent experiments. c, Summary of all T4endoV results at the 30 min of a post-UV recovery. Representative gels and DNA repair plots for ΔuvrA and lexA3 mutants are shown in Extended Data Fig. 8. Numbers are the mean ± SEM from at least three independent experiments.
Fig. 5.
Fig. 5.. Local transcription enables NER (independently of Mfd).
a, Schematic illustration of the semi-long-range (SLR)-qPCR assay to quantitate CPDs within the ROI (see Methods). Cells were exposed to UV followed by the isolation of genomic DNA (top). DNA was treated with T4endoV to convert CPDs to single strand breaks (SSBs) (middle). In the subsequent qPCR step the undamaged ROIs of 1147 bp (red) are successfully amplified, whereas SSBs abrogate PCR in damaged ROIs. Short fragments of 131 bp (blue) serve as a reference. Accumulating CPDs increase ΔCp of qPCR (bottom) allowing for an accurate CPD quantitation per 10 kb. b-e, The rate of local CPD repair as a function of promoter strength. b, Induction of chromosomal PLtet-O1-lacZ by the increasing concentration of anhydrotetracycline (aTc), as determined by RT-qPCR relative to a reference constitutive gene (cysG). Values are means ± SD (n = 3). c-e, Repair of CPDs within the PLtet-O1-lacZ ROI in wt (c), Δmfd (d), and ΔuvrD (e) cells. Transcription was induced by the indicated amounts of aTc as in (b) followed by UV irradiation (40 J/m2). Cells recovered in dark for the indicated time intervals followed by CPD quantitation as in (a). Values are the means ± SD (n = 3). f-k, Depriving a genomic locus of transcription abolishes its NER (irrespectively of Mfd) (see also Extended Data Fig. 11). f, Schematics of the lacZ insulator. Chromosomal lacZ, with or without its native promoter, was insulated from a possible upstream and downstream transcriptional readthrough with the intrinsic terminator cassettes. g, Expression of lacZ from the insulator upon IPTG induction, as determined by RT-qPCR. Values are means ± SD (n = 3). h, Occupancy of RNAP before (UT) and after UV irradiation, as determined by chromatin immunoprecipitation followed by qPCR (ChIP-qPCR). Cells were induced with IPTG followed by UV irradiation (40 J/m2) and recovery for the indicated time intervals. Values are means ± SD (n = 3). i-k, CPD repair within the insulator. Bulk of CPD repair in wt (i) and Δmfd (j) cells strictly depends on promoter-initiated transcription. No significant repair within the insulator with or without promoter was detected in ΔuvrD cells (k). Cells were induced with IPTG followed by UV irradiation (40 J/m2) and recovery in the dark for the indicated time intervals. CPD density was determined by SLR-qPCR as in (a) and used to calculate the percentage of repaired CPDs. Values are means ± SD (n=3), **P < 0.01, ****P < 0.0001 (Student’s t test; equal variance). l,m UvrAB recruitment to the UV-damaged DNA strictly depends on local transcription (see also Extended Data Fig. 11). Recruitment of UvrA (l) and UvrB (m) to the lacZ insulator (with or without promoter) was determined by ChIP-qPCR as in (h). Results are shown as a fold change in the occupancy of UvrAB within the insulator following UV irradiation. **P < 0.01, ****P < 0.0001 (Student’s t test; equal variance).

Similar articles

Cited by

References

    1. Marteijn JA, Lans H, Vermeulen W & Hoeijmakers JH Understanding nucleotide excision repair and its roles in cancer and ageing. Nat Rev Mol Cell Biol 15, 465–481, doi:10.1038/nrm3822 (2014). - DOI - PubMed
    1. Kisker C, Kuper J & Van Houten B Prokaryotic Nucleotide Excision Repair. Csh Perspect Biol 5, doi:ARTN a012591 10.1101/cshperspect.a012591 (2013). - PMC - PubMed
    1. Kuper J & Kisker C Damage recognition in nucleotide excision DNA repair. Curr Opin Struct Biol 22, 88–93, doi:10.1016/j.sbi.2011.12.002 (2012). - DOI - PubMed
    1. Hanawalt PC & Spivak G Transcription-coupled DNA repair: two decades of progress and surprises. Nat Rev Mol Cell Biol 9, 958–970, doi:10.1038/nrm2549 (2008). - DOI - PubMed
    1. Pani B & Nudler E Mechanistic insights into transcription coupled DNA repair. DNA Repair 56, 42–50, doi:10.1016/j.dnarep.2017.06.006 (2017). - DOI - PMC - PubMed

LinkOut - more resources