. 2022 Apr;604(7904):160-166.
doi: 10.1038/s41586-022-04537-z. Epub 2022 Mar 30.

Targeting Xist with compounds that disrupt RNA structure and X inactivation

Affiliations

Targeting Xist with compounds that disrupt RNA structure and X inactivation

Rodrigo Aguilar et al. Nature. 2022 Apr.

Abstract

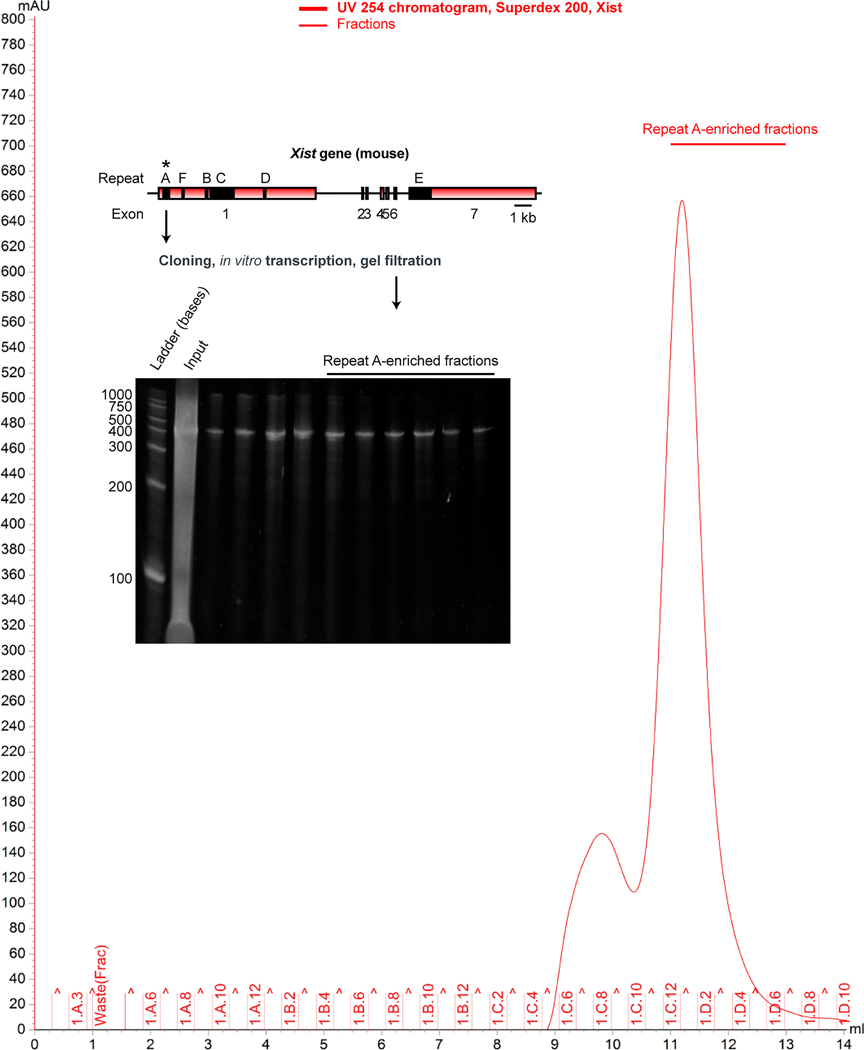
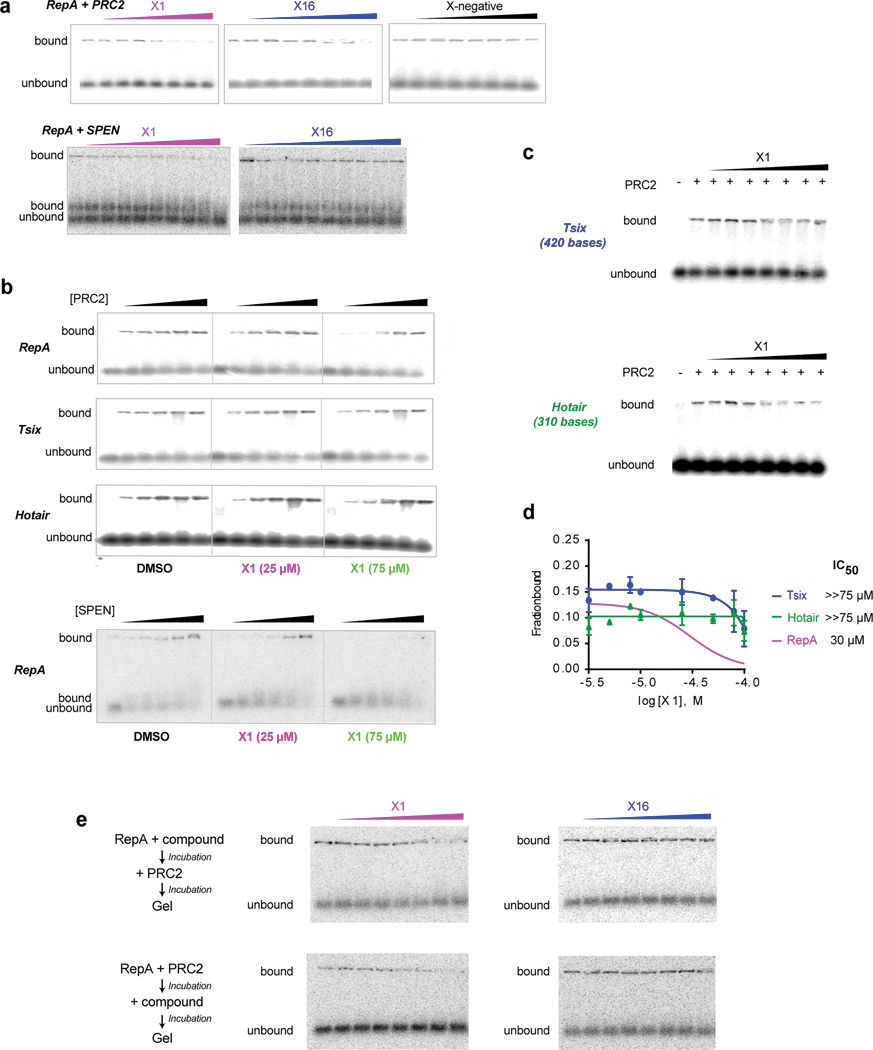
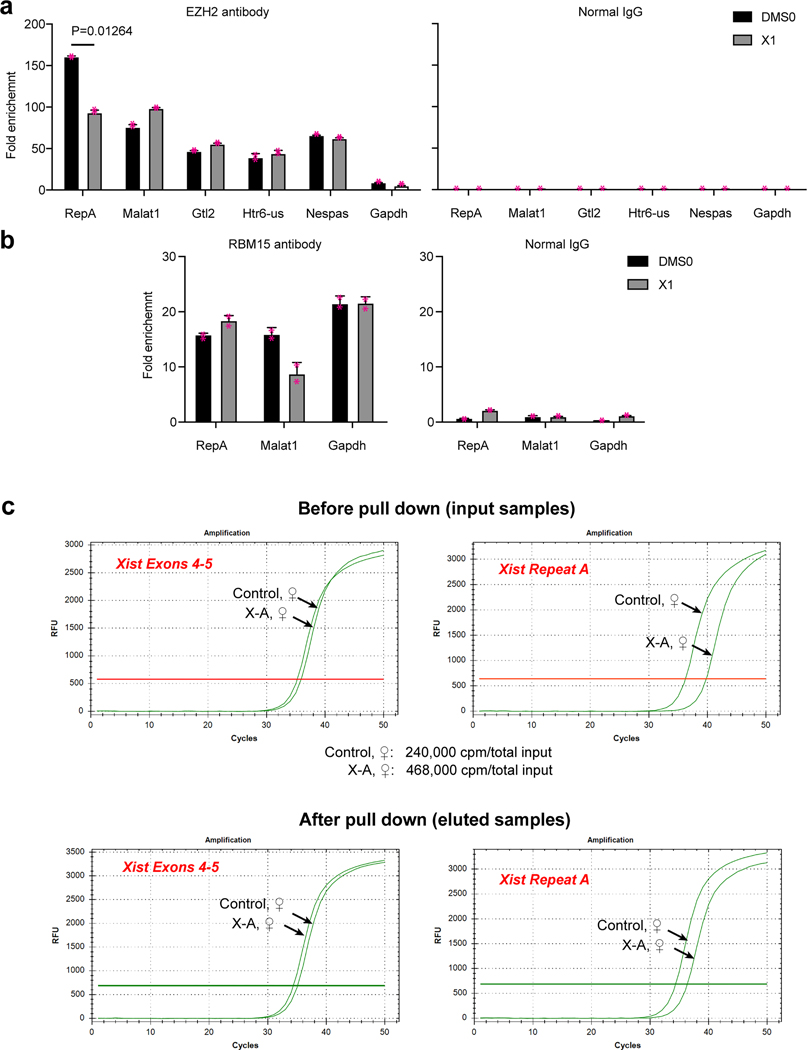
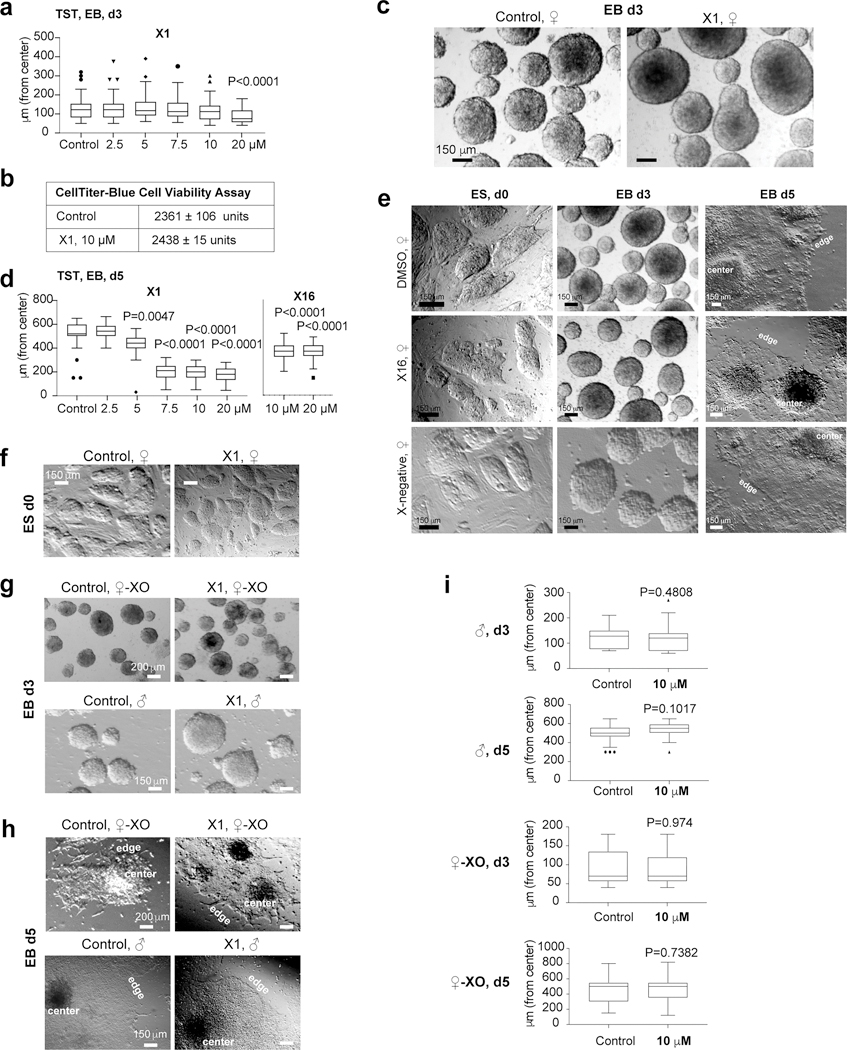
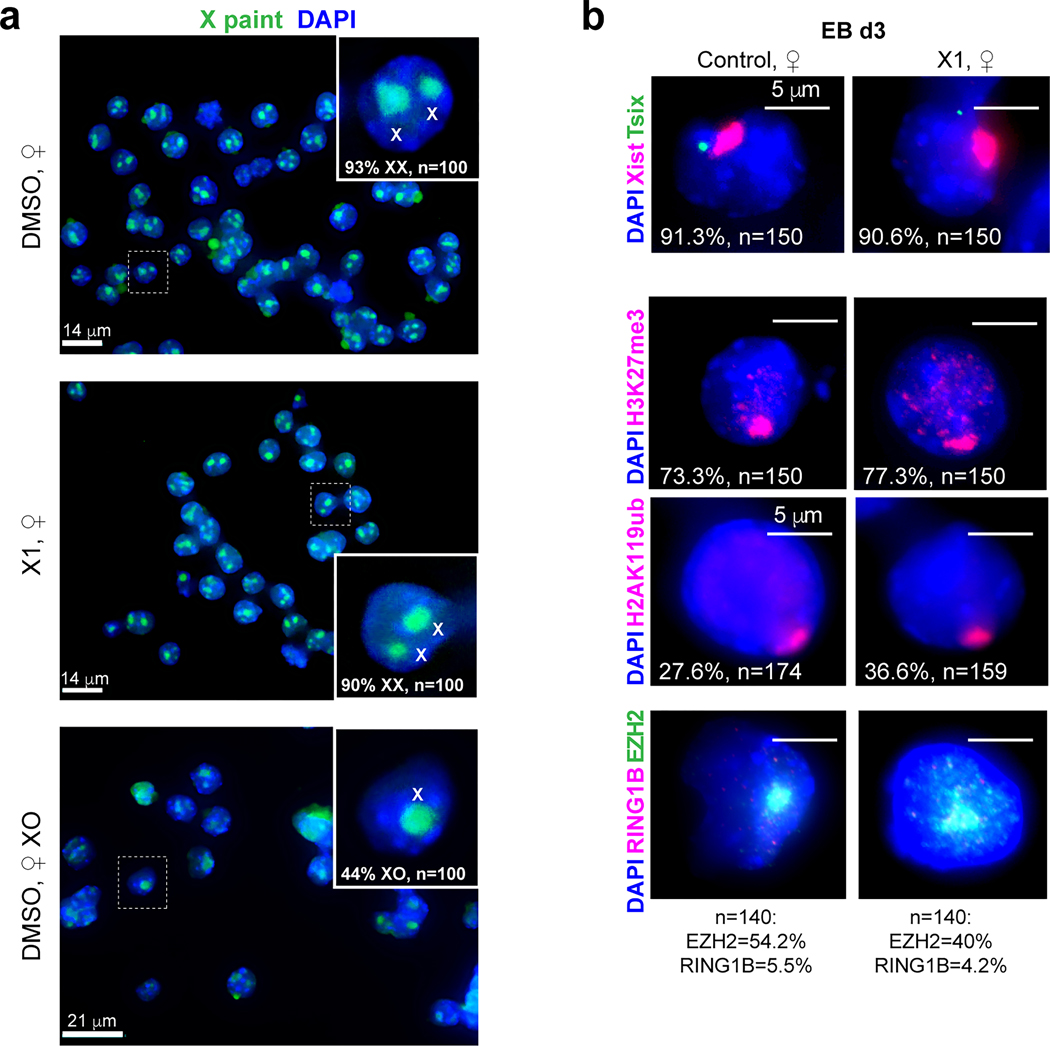
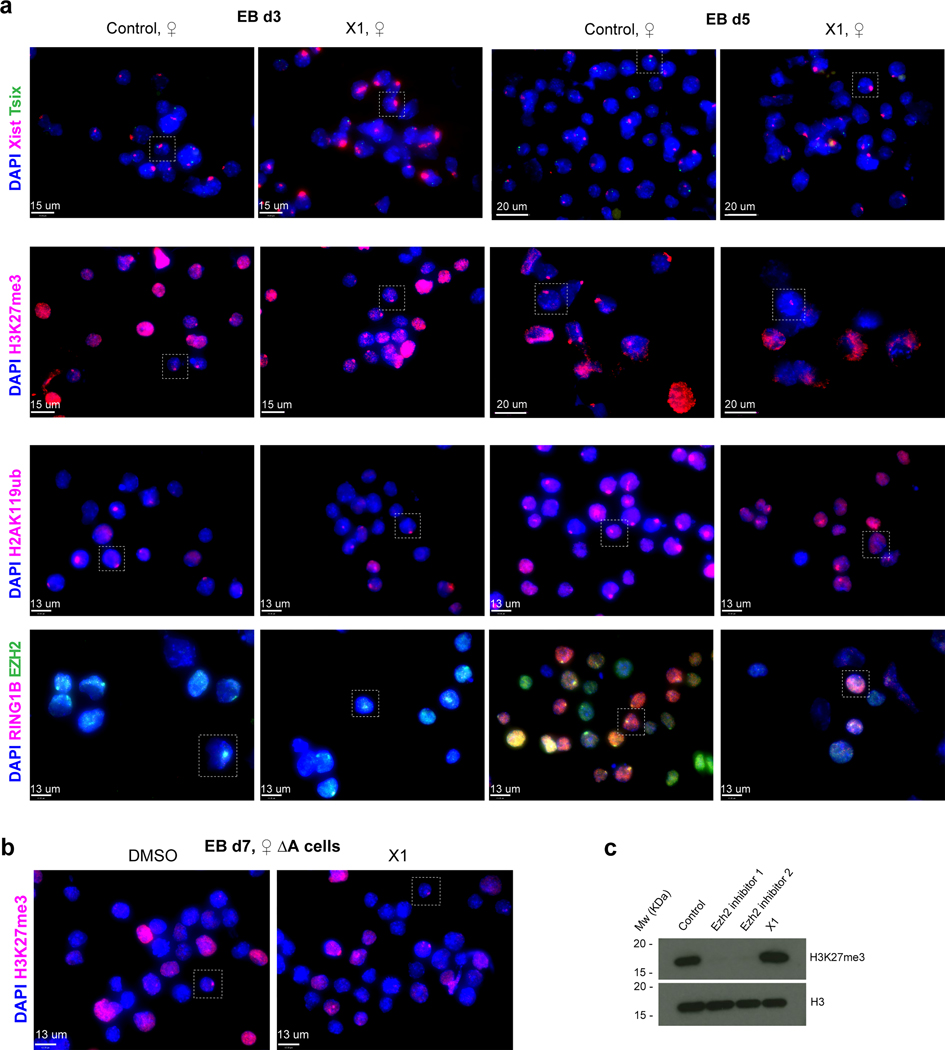
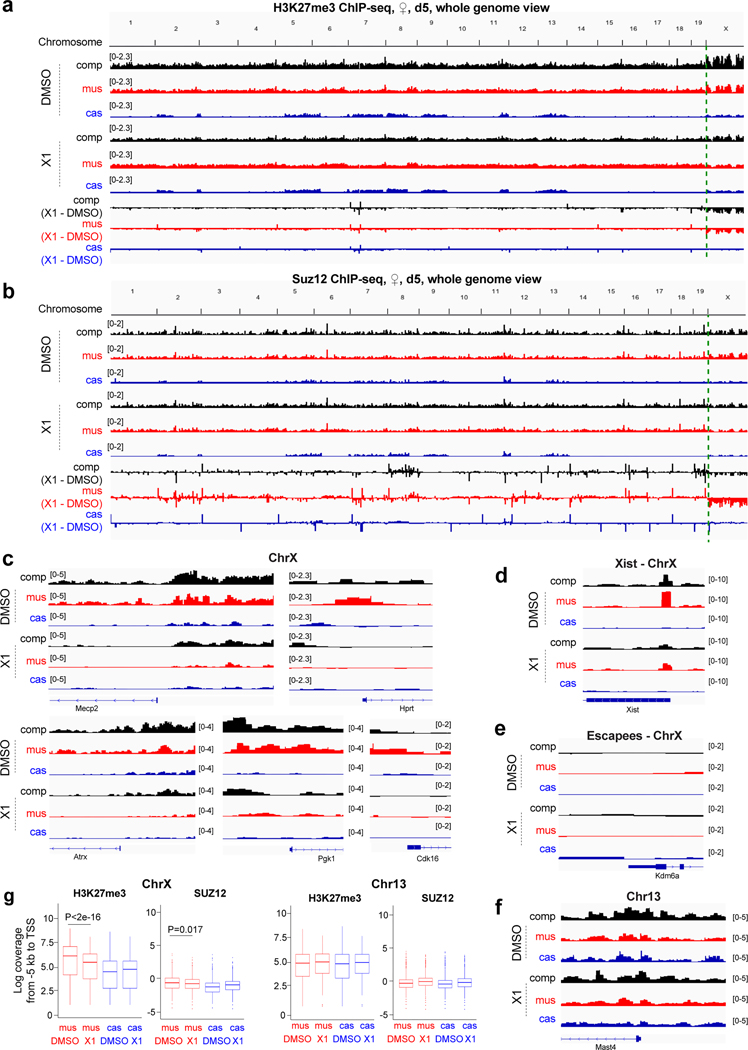
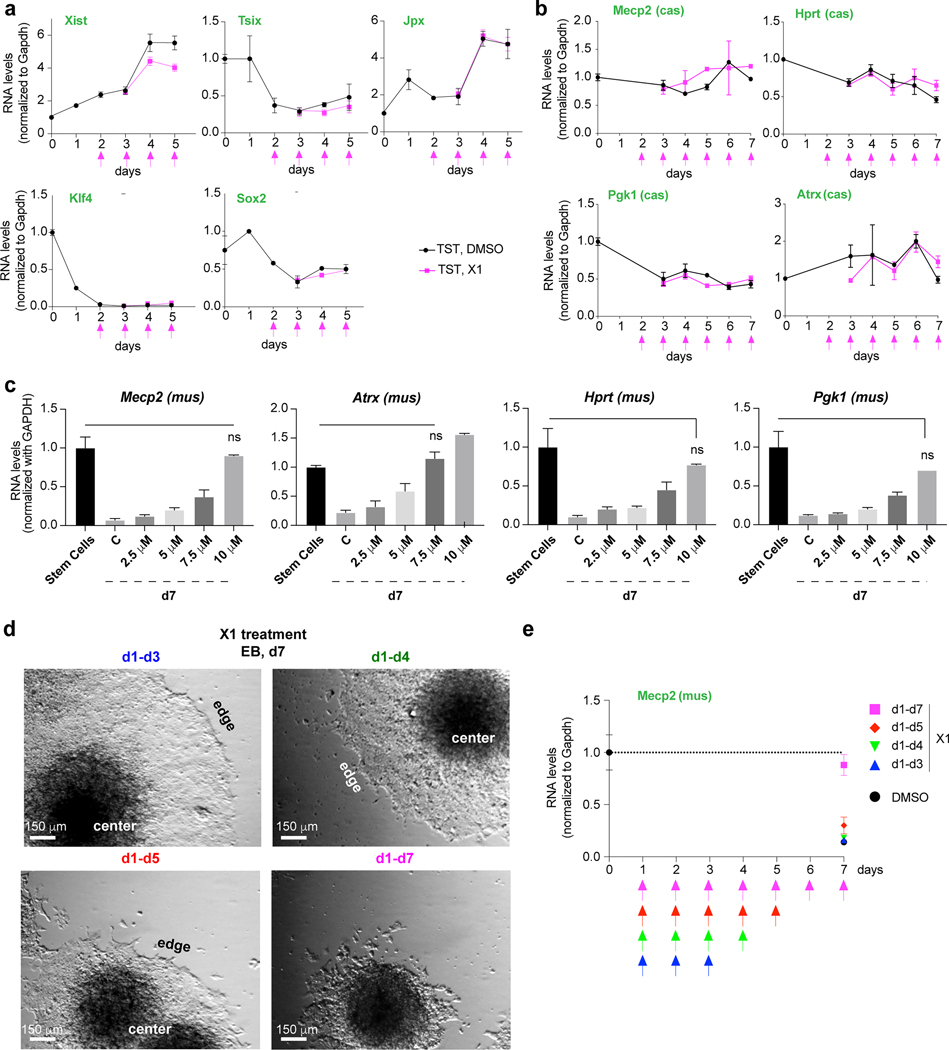
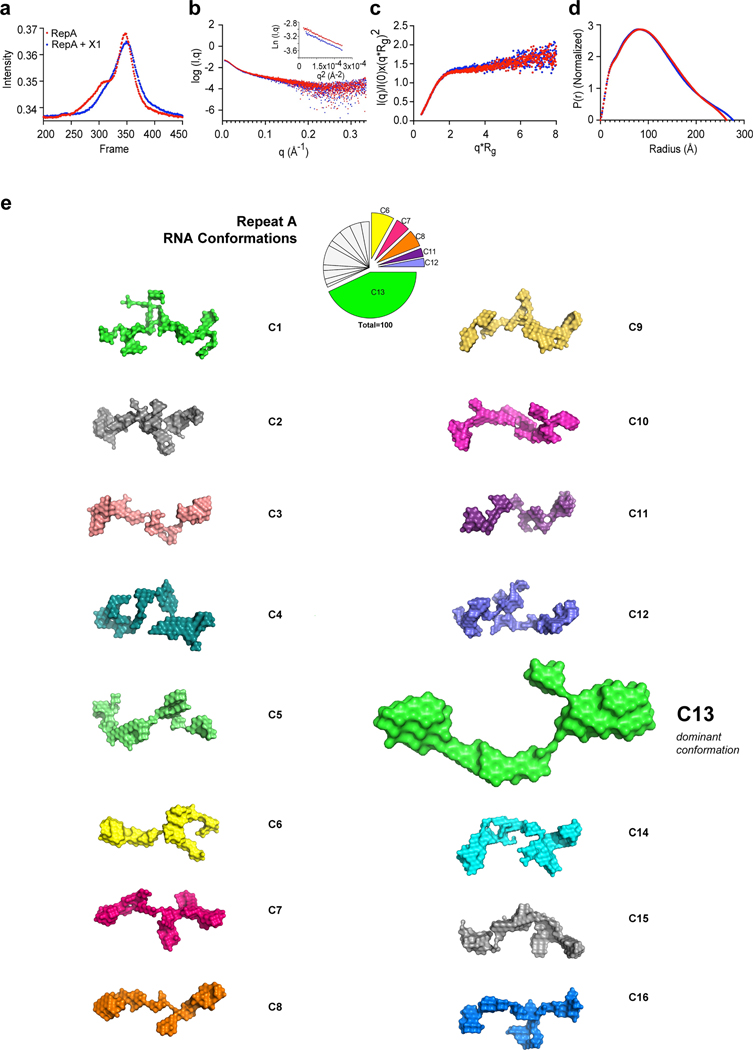
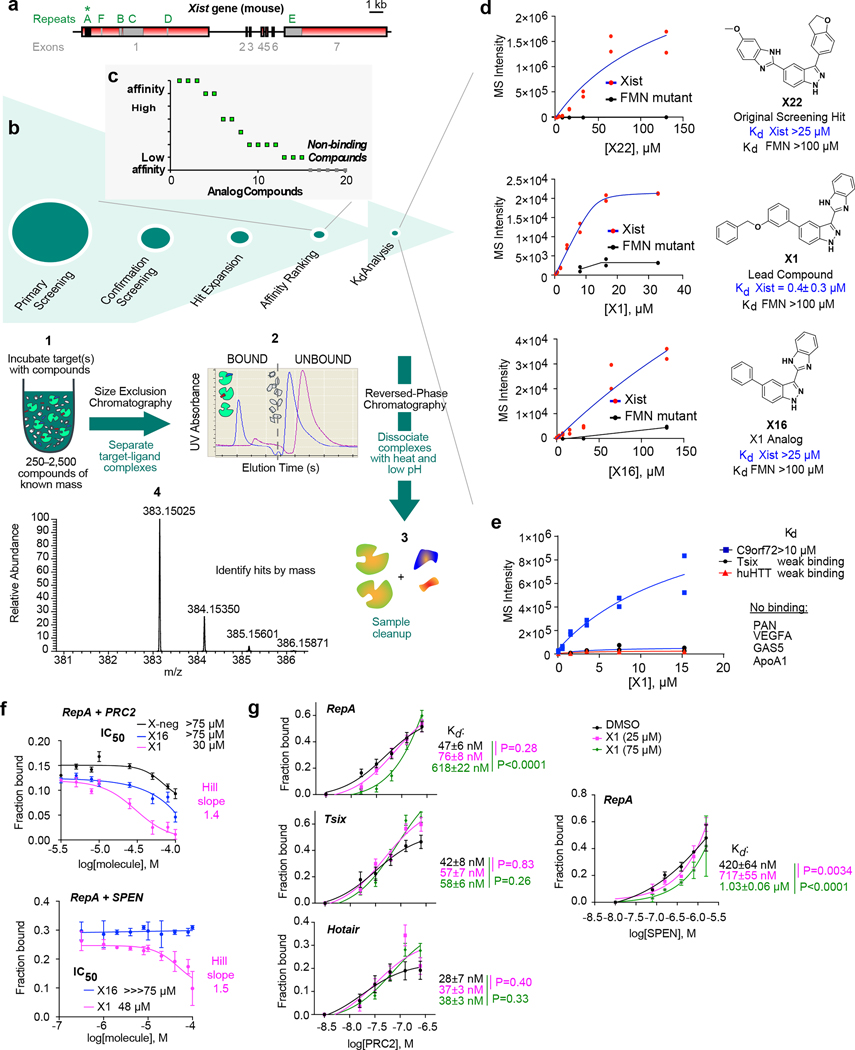
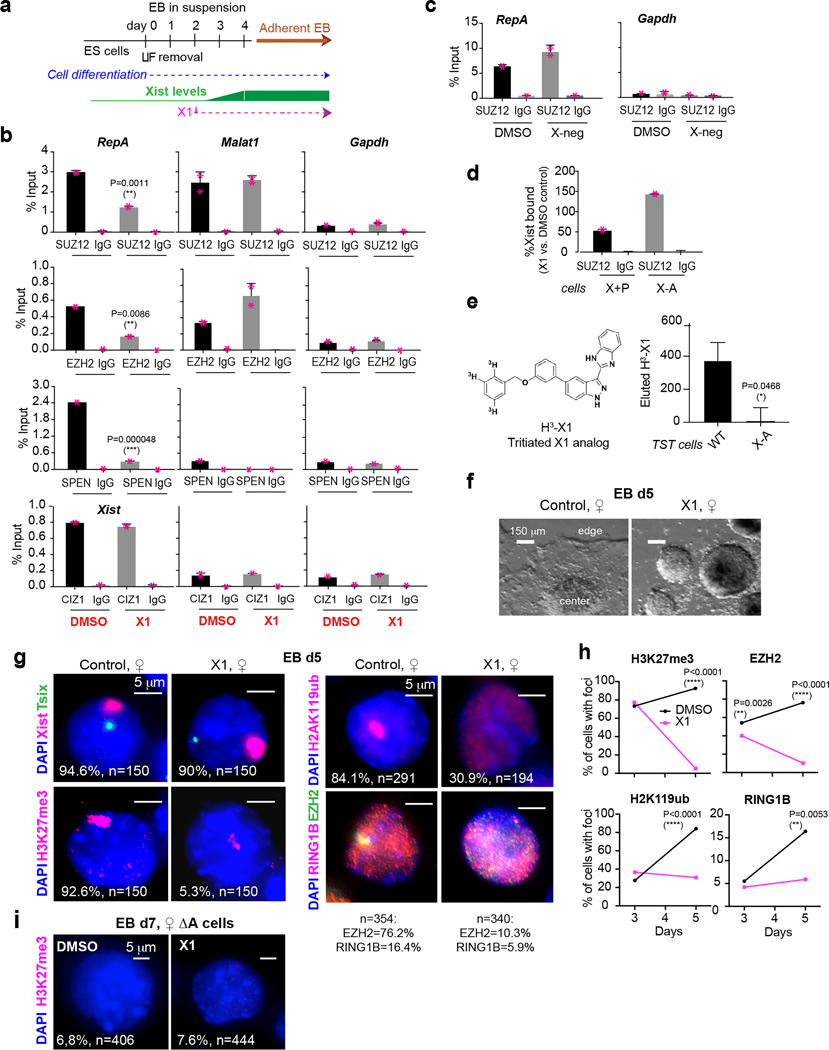
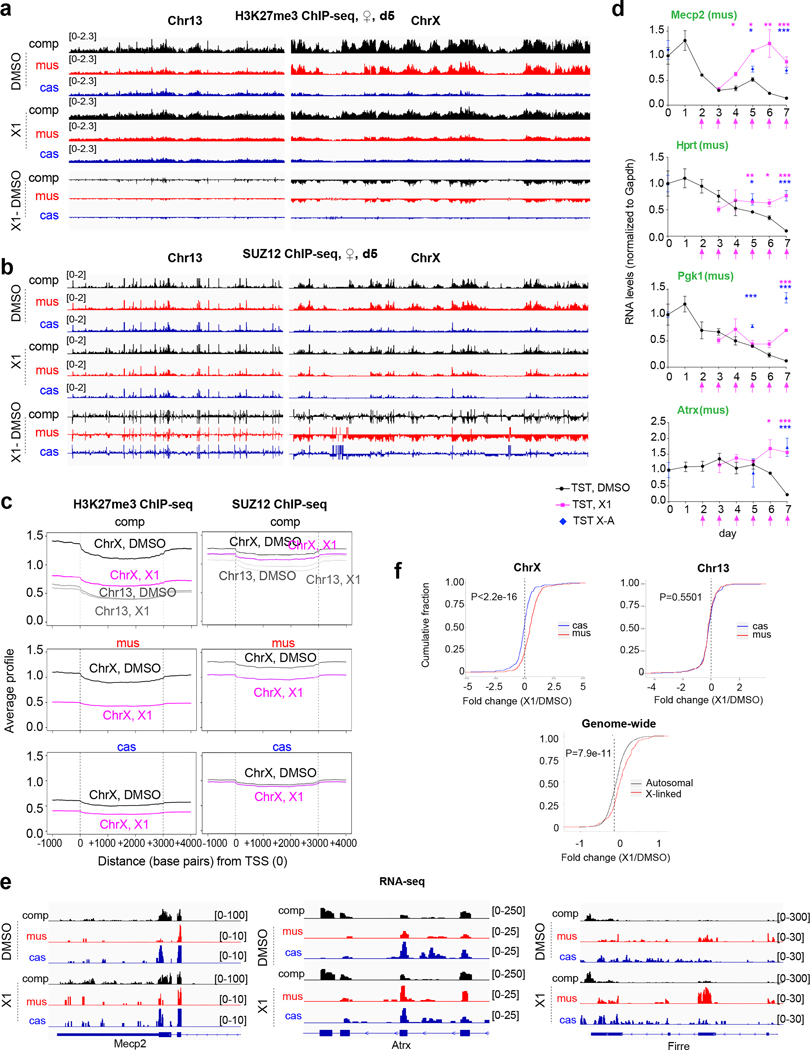
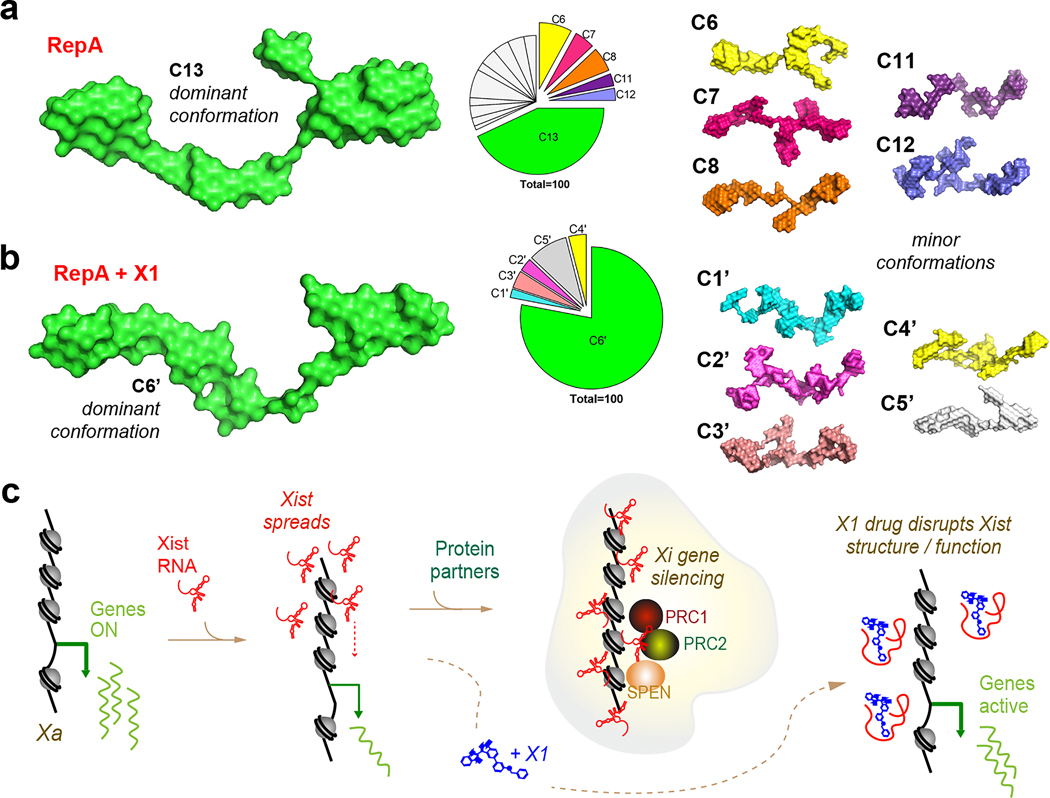
Although more than 98% of the human genome is non-coding1, nearly all of the drugs on the market target one of about 700 disease-related proteins. The historical reluctance to invest in non-coding RNA stems partly from requirements for drug targets to adopt a single stable conformation2. Most RNAs can adopt several conformations of similar stabilities. RNA structures also remain challenging to determine3. Nonetheless, an increasing number of diseases are now being attributed to non-coding RNA4 and the ability to target them would vastly expand the chemical space for drug development. Here we devise a screening strategy and identify small molecules that bind the non-coding RNA prototype Xist5. The X1 compound has drug-like properties and binds specifically the RepA motif6 of Xist in vitro and in vivo. Small-angle X-ray scattering analysis reveals that RepA can adopt multiple conformations but favours one structure in solution. X1 binding reduces the conformational space of RepA, displaces cognate interacting protein factors (PRC2 and SPEN), suppresses histone H3K27 trimethylation, and blocks initiation of X-chromosome inactivation. X1 inhibits cell differentiation and growth in a female-specific manner. Thus, RNA can be systematically targeted by drug-like compounds that disrupt RNA structure and epigenetic function.


Figures

Figure 1:
Figure 1:. Purification of Xist RepA RNA.
A 431 Repeat A fragment of Xist RNA was in vitro transcribed and purified under native conditions by FPLC. A representative chromatogram is shown. To confirm size and stability of the sample just prior to ALIS, we visualized the RNA in a denaturing urea-PAGE
Figure 2:
Figure 2:. X1 inhibits interaction of Xist RepA with cognate interacting proteins in vitro.
a, RNA EMSAs show that X1 weakens interaction between RepA and PRC2, and RepA and SPEN-RRM. Increasing concentrations of the compounds (0, 5, 7.5, 10, 25, 50, 75, 100 μM) were titrated against 0.5 nM RNA and 15.6 nM PRC2, or 0.1 nM RNA and 158 nM SPEN-RRM. Two replicates showed similar results. b, RNA EMSAs titrating PRC2 (0, 15.6, 31.2, 62.4, 124.9, 250 nM) or SPEN-RRM (0, 79.2, 158, 396, 792, 1580 nM) against a fixed concentration of X1 (25 or 75 μM) and 0.5 nM RepA, Tsix (reverse complement of RepA), or Hotair RNA—all of which are known PRC2 interactors. For SPEN, RNA was 0.1 nM. Two or more replicates showed similar results. c, Increasing concentrations of X1 (0, 5, 7.5, 10, 25, 50, 75, 100 μM) was titrated against 0.5 nM RNA (Tsix, Hotair) and 15.6 nM PRC2. One representative gel of two replicates is shown. d, Densitometric analysis to determine IC50, which were too high to be measured for Tsix and Hotair. Data are represented as mean +/− SD. n=2 independent experiments. RepA result from Fig. 1f is shown as reference. e, Order of addition does not affect X activity. Increasing concentrations of the compounds (0, 5, 7.5, 10, 25, 50, 75, 100 μM) was titrated against 0.5 nM RepA and 15.6 nM PRC2. One representative gel of two replicates is shown. Top, PRC2 was added to a RepA-molecule pre-incubated mix. Bottom, Molecule was added to a RepA-PRC2 pre-incubated mix.
Figure 3:
Figure 3:. X1 also inhibits interaction of Xist RepA with cognate interacting proteins in vivo.
a-b, RIP-qPCR analysis in d4 female TST ES cells to evaluate Xist binding to EZH2 (a) and RBM15 (b) in 10 μM X1. IgG, negative control antibody. Other EZH2 interactors Malat1, Gtl2, Htr6-us and Nespas are shown. Gapdh, negative control RNA. Bars: mean ± S.D. P-value: two-tailed Student’s t-test. Individual data points included. n=2 biologically independent experiments. c, Top: RT-qPCR confirms similar quantities of Xist RNA in control and X-A samples prior to Xist RNA pulldown. Xist exons 4–5 primers were used. Bottom: Similar quantities were also present following Xist RNA pulldown, thereby ruling out unequal Xist expression as a cause of unequal H radioactive counts. X-A cells amplified poorly with RepA primers, consistent with deletion of RepA.
Figure 4:
Figure 4:. X1 effects on EB outgrowth in ♀- TST-XX, ♀-XO, and ♂-XY EB cells.
a, Growth of differentiating ♀-TST cells at day 3, or 24 h post-X1 treatment, up to 10 μM X1. Data are represented as Tukey box plots. Lower whisker: 25th percentile minus 1.5xInterquartile Range (IQR). Higher whisker: 75th percentile plus 1.5xIQR. Box range: 25th (bottom) to 75th (top) percentile. Line within box: median. Points beyond higher whisker are shown. P-values: one-way ANOVA with respect to control cells. n=150 colonies combined from 3 independent experiments. b, Viability of d5 cells. n=3 biologically independent experiments c, No obvious effect on day 3 female EB growth after 24 hours X1 treatment. d, Quantitation of EB outgrowth at day 5 (72 h post-drug application). The distance from EB center to edge of outgrowth was measured in 100 d3 or 30 d5 EBs combined from 3 independent experiments. Data presented as in panel (a). P-values: one-way ANOVA with respect to control cells. e, Weaker effect of X16 on ♀-TST EB outgrowth. No obvious effect of X-negative.. One representative brightfield microscopy from 3 independent cultures is shown. Center of the EB and edge of outgrowth as marked. Scale as indicated. f, X1 had no effect on growth of pre-XCI (d0) female cells. g,h, X1 also did not inhibit ♀-TST-XO and ♂-XY ES cells at day 3 (g) or day 5 (h). Neither cell line expresses Xist or undergoes XCI. One representative field is shown. Scale bar, 150 μm. i, Quantitation of EB outgrowth in XY male and XO female EBs at days 3 and 5. Distance from the EB center to the edge of outgrowth was measured. Day 3: n=136, XO colonies; n=112, XY colonies. Day 5: n=40, XO colonies; n=60, XY colonies). Data presented as in panel (a).
Figure 5.
Figure 5.. Karyotype analysis of ES cells and RNA immunoFISH analysis of day 3 X1-treated cells.
a, X-chromosome painting DNA FISH of DMSO- and X1-treated XX TST cells, and a DMSO-treated XO clone that spontaneously arose from the XX TST cells. Scale as shown. Inset: magnification of representative nucleus. %nuclei with indicated X chromosome number shown. n, sample size combining from 3 biologically independent experiments. b, Xist/Tsix RNA-FISH and immunostaing for H3K27me3, H2AK119ub, EZH2, and RING1B in ♀-TST EB at day 3. One representative nucleus is shown. %cells with Xist foci is indicated. n, sample size. Scale bar, 5 μm.
Figure 6:
Figure 6:. Full fields for RNA immunoFISH experiments of Figure 2 and Extended Data-Figure 5.
a, Full fields for the RNA FISH and Immunofluorescence experiments, with boxed nuclei presented in Figure 2g and Ext. Data-Fig. 5b. b, Full fields for H3K27me3 immunostaining of DMSO- or X1-treated ♀ TST-A cells, with boxed nuclei presented in Figure 2h. %cells with foci on the Xi as indicated (sample size, n, from two biologically independent experiments combined). c, X1 does not inhibit PRC2’s catalytic activity. Western blot using H3K27me3 and total histone H3 antibodies. Total cell extracts were obtained from day 7 female EB cells after treating with 10 μM of various compounds from day 2. Compounds: EZH2 inhibitor 1 (EPZ-6438, MedChem Express), EZH2 inhibitor 2 (PF-06821497, Pfizer), or X1. One representative film of two replicates is shown.
Figure 7:
Figure 7:. Epigenomic analyses of PRC2 and H3K27me3 enrichment in the presence of X1.
a-b, Allele-specific H3K27me3 (a) and SUZ12 (b) ChIP-seq analyses of day 5 female EB treated with 10 μM X1 or DMSO (control) for 72 h. Tracks for all reads (composite, “comp”), mus (Xi), and cas (Xa). Dotted green lines separate ChrX. c-f, Zoom-ins for allele-specific H3K27me3 ChIP-seq analyses of day 5 female EB treated with 10 μM X1 or DMSO (control) for 72 h. Browser shots shown with sliding window 1 kb, step size 0.5 kb. Scale shown in brackets. c, X-linked genes subjected to XCI. d, the Xist gene. e, Escapees. f, Representative control autosomal gene on Chr13. g, Box plot of normalized read densities for the −5000 to +1 region of ChrX and Chr13 refSeq genes, parsed into mus and cas alleles. Lower whisker: 10th percentile. Higher whisker: 90th percentile. Box range: 25th (bottom) to 75th (top) percentile. Line within box: median. Points beyond whiskers are shown. P-values: two-tailed Wilcoxon test from data gathered from individual H3K27me3 and Suz12 ChIP-seq experiments.
Figure 8:
Figure 8:. Analysis of gene expression and reversibility of X1’s effect.
a, Time course RT-qPCR of indicated control genes in DMSO- or X1-treated female EB. X1 added on indicated days (pink arrows). Mean and S.D. shown for 3 biological replicates. b, Time course allele-specific RT-qPCR of indicated Xa genes in DMSO- or X1-treated female EB. X1 added on indicated days (pink arrows). Mean and S.D. shown for 3 biological replicates. c, Dose-response analysis in the range of 0–10 μM X1 compound. Allele-specific RT-qPCR of indicated X-linked genes in DMSO- or X1-treated female EB. Mus allele (Xi) shown. X1 was added on d2. P, two-tailed Student’s t-test with respect to DMSO-treated TST control. Mean and S.D. shown for 2 replicates. At 10 μM X1, the Student’s t-test reveal no significant difference between d7 cells and expression found in control ES cells. d-e, X1 effect is reversible upon drug withdrawal. Female EB were grown from d1 in 10 μM X1 and the treatment was either suspended on day 3, 4, 5, or maintained up to day 7. The growth morphology (d) and Mecp2 expression from the Xi is evaluated at d7 (e). One representative brightfield microscopy from 3 independent cultures is shown.
Figure 9:
Figure 9:. Transcriptomic studies of on- and off-target effects.
a-d, RNA-seq analyses of day 5 DMSO- or X1-treated female EB. Zoom-ins to representative X-linked genes subjected to XCI (a), Xist (b), escapee gene (c) and autosomal gene (d). Tracks for all reads (comp), mus reads (Xi), and cas reads (Xa). FPM scale shown in brackets. e, Differentially expressed autosomal genes (y axis) and their corresponding changes in H3K27me3 enrichment (x axis). Each dot represents a gene. Number of genes on each of the nine sections as shown. Comp tracks were sampled to the smallest library, then MultiTesting and IndependentFiltering DESeq2 filtering was performed reporting significance below 0.05 (Wald test) after Benjamini and Hochberg correction with the application of independent intensity filtering.
Figure 10:
Figure 10:. Sixteen conformational clusters identified for native RepA RNA without X1 treatment.
a, HPLC-SEC profile of the purified RepA RNA with or without X1 previous to SAXS data collection. b, PRIMUS analysis for initial data quality analysis. Inset: Guinier plot to determine the Radius of Gyration (Rg). c, Dimensionless Kratky analysis [q*Rg vs. I(q)/I(0)x(q*Rg)2] of samples d, Pairwise distance distribution profile (P(r)) to estimate the real space dimensions of the molecule in Å e, 16 clusters (C1-C16) of RepA are presented in their native state without X1. C13 is the dominant conformation. Pie-chart shows relative abundance of structural clusters. See also Fig. 4.
Figure 1:
Figure 1:. X1 binds Xist RepA and weakens RNA binding to interacting protein partners in vitro.
a, The mouse Xist gene with conserved repeat motifs (A-F) and exons (1–7). b, ALIS screening of 50,000 diverse small molecule compounds against RepA. (1) Compound mixture is equilibrated with target, (2) target-ligand complex is separated from unbound ligands by SEC, (3) RP-HPLC dissociates bound ligands and purifies sample, (4) MS identifies ligand by mass. Confirmation Screening: Single hit identified (X22) and verified for target binding in ALIS. c, Hit Expansion around the original hit, X22. 20 analogs were identified with 70% similarity from the complete Merck collection, and Affinity Ranking was performed. y axis represents the relative binding affinity of each compound to RepA as determined by ALIS following the MS step. d, The original hit X22, X1 from expansion series, and X16 from synthetic analogs shown with affinities for RepA. Negative control: FMN Δ94–102 riboswitch. Data are represented as mean +/− S.E.M. n=2 independent experiments. e, X1 affinity for PAN, VEGFA, GAS5, ApoA1, C9orf72, Tsix, and huHTT RNAs. f, X1 weakens RepA-PRC2 and RepA-SPEN interactions. Densitometric analysis of EMSAs (Ext. Data-Fig. 2a) to determine IC50 and Hill coefficient. Increasing concentrations of indicated compounds (0, 5, 7.5, 10, 25, 50, 75, 100 μM) were titrated against 0.5 nM RNA and 15.6 nM PRC2, or 0.1 nM RNA and 158 nM SPEN-RRM. Mean +/− S.D. shown. n=3 independent experiments. g, Quantitation of RNA-EMSAs (Ext. Data-Fig. 2b) titrating PRC2 (0, 15.6, 31.2, 62.4, 124.9, 250 nM) or SPEN-RRM (0, 79.2, 158, 396, 792, 1580 nM) against 25 or 75 μM X1. [RNA], 0.5 nM. Mean +/− S.D. shown. P-values: one-way ANOVA with Dunnet’s post-test comparing all conditions to control. n=3 independent experiments.
Figure 2:
Figure 2:. X1 weakens Xist’s interaction with PRC2 and SPEN in a RepA-dependent manner inside cells.
See also Ext. Data-Fig. 4–6. a, Analysis of XCI effects using the schematic shown. 10 μM X1 was added at day 2 and replenished daily with medium change. EBs grown in suspension, followed by adherent culture. All experiments performed in 3 biological replicates (n=3) unless otherwise specified. b,c, RIP-qPCR in d4 female TST ES cells to evaluate Xist binding to SUZ12, EZH2, SPEN, and CIZ1, as indicated, +/− X1 (b) or X-negative (X-neg) control compound (c). IgG, control antibodies. Bars: %input (mean ± S.D). P-values: two-tailed Student’s t-test. Individual data points shown. Malat1 and Gapdh: negative control RNAs. d, RIP-qPCR in fibroblasts over-expressing transgenic Xist (X+P) or a RepA-deleted version (X-A). Bars: %Xist (mean +/− S.D.) recovered with X1-treatment relative to DMSO. n=2 biological replicates. e, Validation of target engagement using [3H]X1. Bars: cpm (mean +/− S.D.). P-value: two-tailed Student’s t-test. f, X1 inhibits growth of day 5 differentiating ♀-TST cells. Scale bar, 150 μm. One representative field shown. g, Xist/Tsix RNA-FISH and immunostain for H3K27me3, H2AK119ub, EZH2, and RING1B in ♀-TST EB at day 5. One representative nucleus is shown. %cells with Xist foci is indicated. n, sample size. Scale bar, 5 μm. h, Enrichment of indicated protein epitopes across time (immunostain). P-values: two-tailed Chi-square test. i, X1 inhibition depends on RepA, shown by H3K27me3 immunostaining in day 7 ♀-TST-ES cells lacking RepA (ΔA). %cells with H3K27me3 enrichment is indicated. n, sample size from two biological replicates. Scale bar, 5 μm.
Figure 3:
Figure 3:. X1 treatment leads to Xi-specific loss of PRC2 and H3K27me3 enrichment and failure of XCI.
a,b, Allele-specific H3K27me3 (a) and SUZ12 (b) ChIP-seq analyses of day 5 female EB treated with 10 μM X1 or DMSO (control) for 72 h. Tracks for all reads (composite, “comp”), mus (Xi), and cas (Xa). X1–DMSO, subtraction of X1 reads from DMSO reads. Chr13 and ChrX shown, with a sliding window of 100 kb, step size 50 kb. FPM scale shown in brackets. c, Metagene analysis of the average Xi gene, Xa gene, and Chr13 gene with or without X1 treatment. d, Time course allele-specific RT-qPCR of indicated X-linked genes in DMSO- or X1-treated female EB. TST X-A cells analyzed on days 5 and 7 phenocopy X1-treatment. Mus allele (Xi) shown. X1 added on indicated days (pink arrows). P-values from two-tailed Student’s t-test compared to DMSO control. *, P<0.05. **, P<0.01. ***, P<0.001. Mean and S.D. shown for 3 biological replicates. e, RNA-seq analyses of day 5 DMSO- or X1-treated female EB. Tracks shown for all reads (comp), mus (Xi), and cas (Xa). FPM scale shown in brackets. f, Cumulative distribution plots of fold-changes in gene expression in X1- versus DMSO-treated EB. Mus, Xi. Cas, Xa. ChrX and Chr13 shown. Genes with RPKM>1 were included in analysis. P-values: two-tailed Wilcoxon test.
Figure 4:
Figure 4:. 3D structure of RepA, with and without X1.
a, 16 representative conformations of RepA (C1-C16). C13 (43% of species) is enlarged. Pie-chart shows relative abundance of structural clusters. See Ext. Data-Fig.10 for all 16 conformations. b, 6 representative conformations of RepA with X1 (C1’-C6’). C6’ (78% of species) is magnified. Pie-chart shows relative abundance of structural clusters. c, XCI and the effects of X1 treatment.

Comment in

References

    1. Consortium EP et al., Identification and analysis of functional elements in 1% of the human genome by the ENCODE pilot project. Nature 447 (7146), 799–816 (2007). - PMC - PubMed
    1. Santos R. et al., A comprehensive map of molecular drug targets. Nat Rev Drug Discov 16 (1), 19–34 (2017). - PMC - PubMed
    1. Warner KD et al., Principles for targeting RNA with drug-like small molecules. Nat Rev Drug Discov 17 (8), 547–558 (2018). - PMC - PubMed
    1. Zhang F. & Lupski JR, Non-coding genetic variants in human disease. Hum Mol Genet 24 (R1), R102–110 (2015). - PMC - PubMed
    1. Lee JT, Epigenetic regulation by long noncoding RNAs. Science 338 (6113), 1435–1439 (2012). - PubMed