. 2022 Apr;604(7904):120-126.
doi: 10.1038/s41586-022-04552-0. Epub 2022 Mar 30.

Human distal airways contain a multipotent secretory cell that can regenerate alveoli

Affiliations

Human distal airways contain a multipotent secretory cell that can regenerate alveoli

Maria C Basil et al. Nature. 2022 Apr.

Abstract

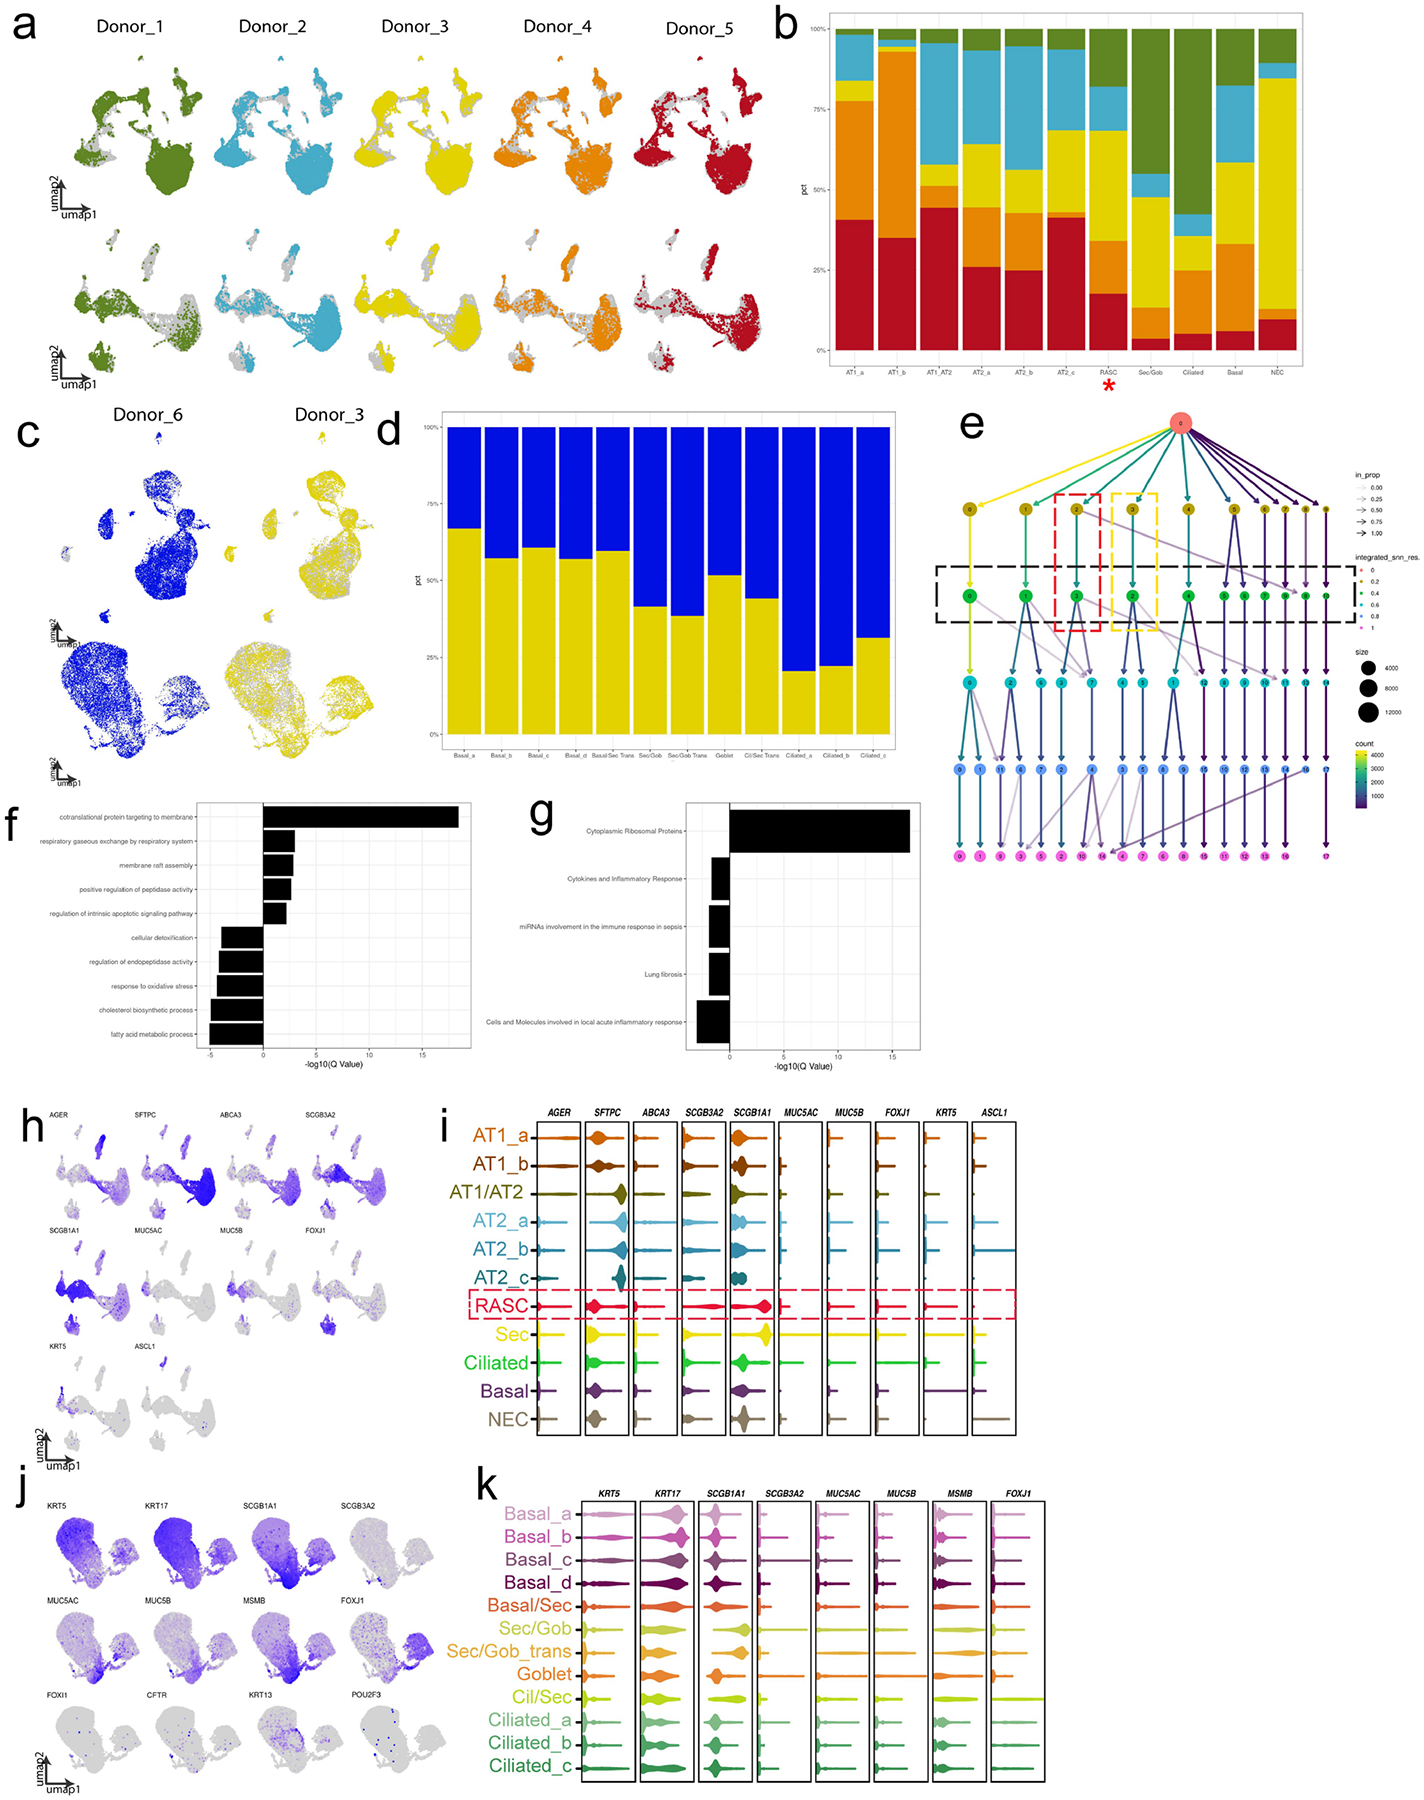
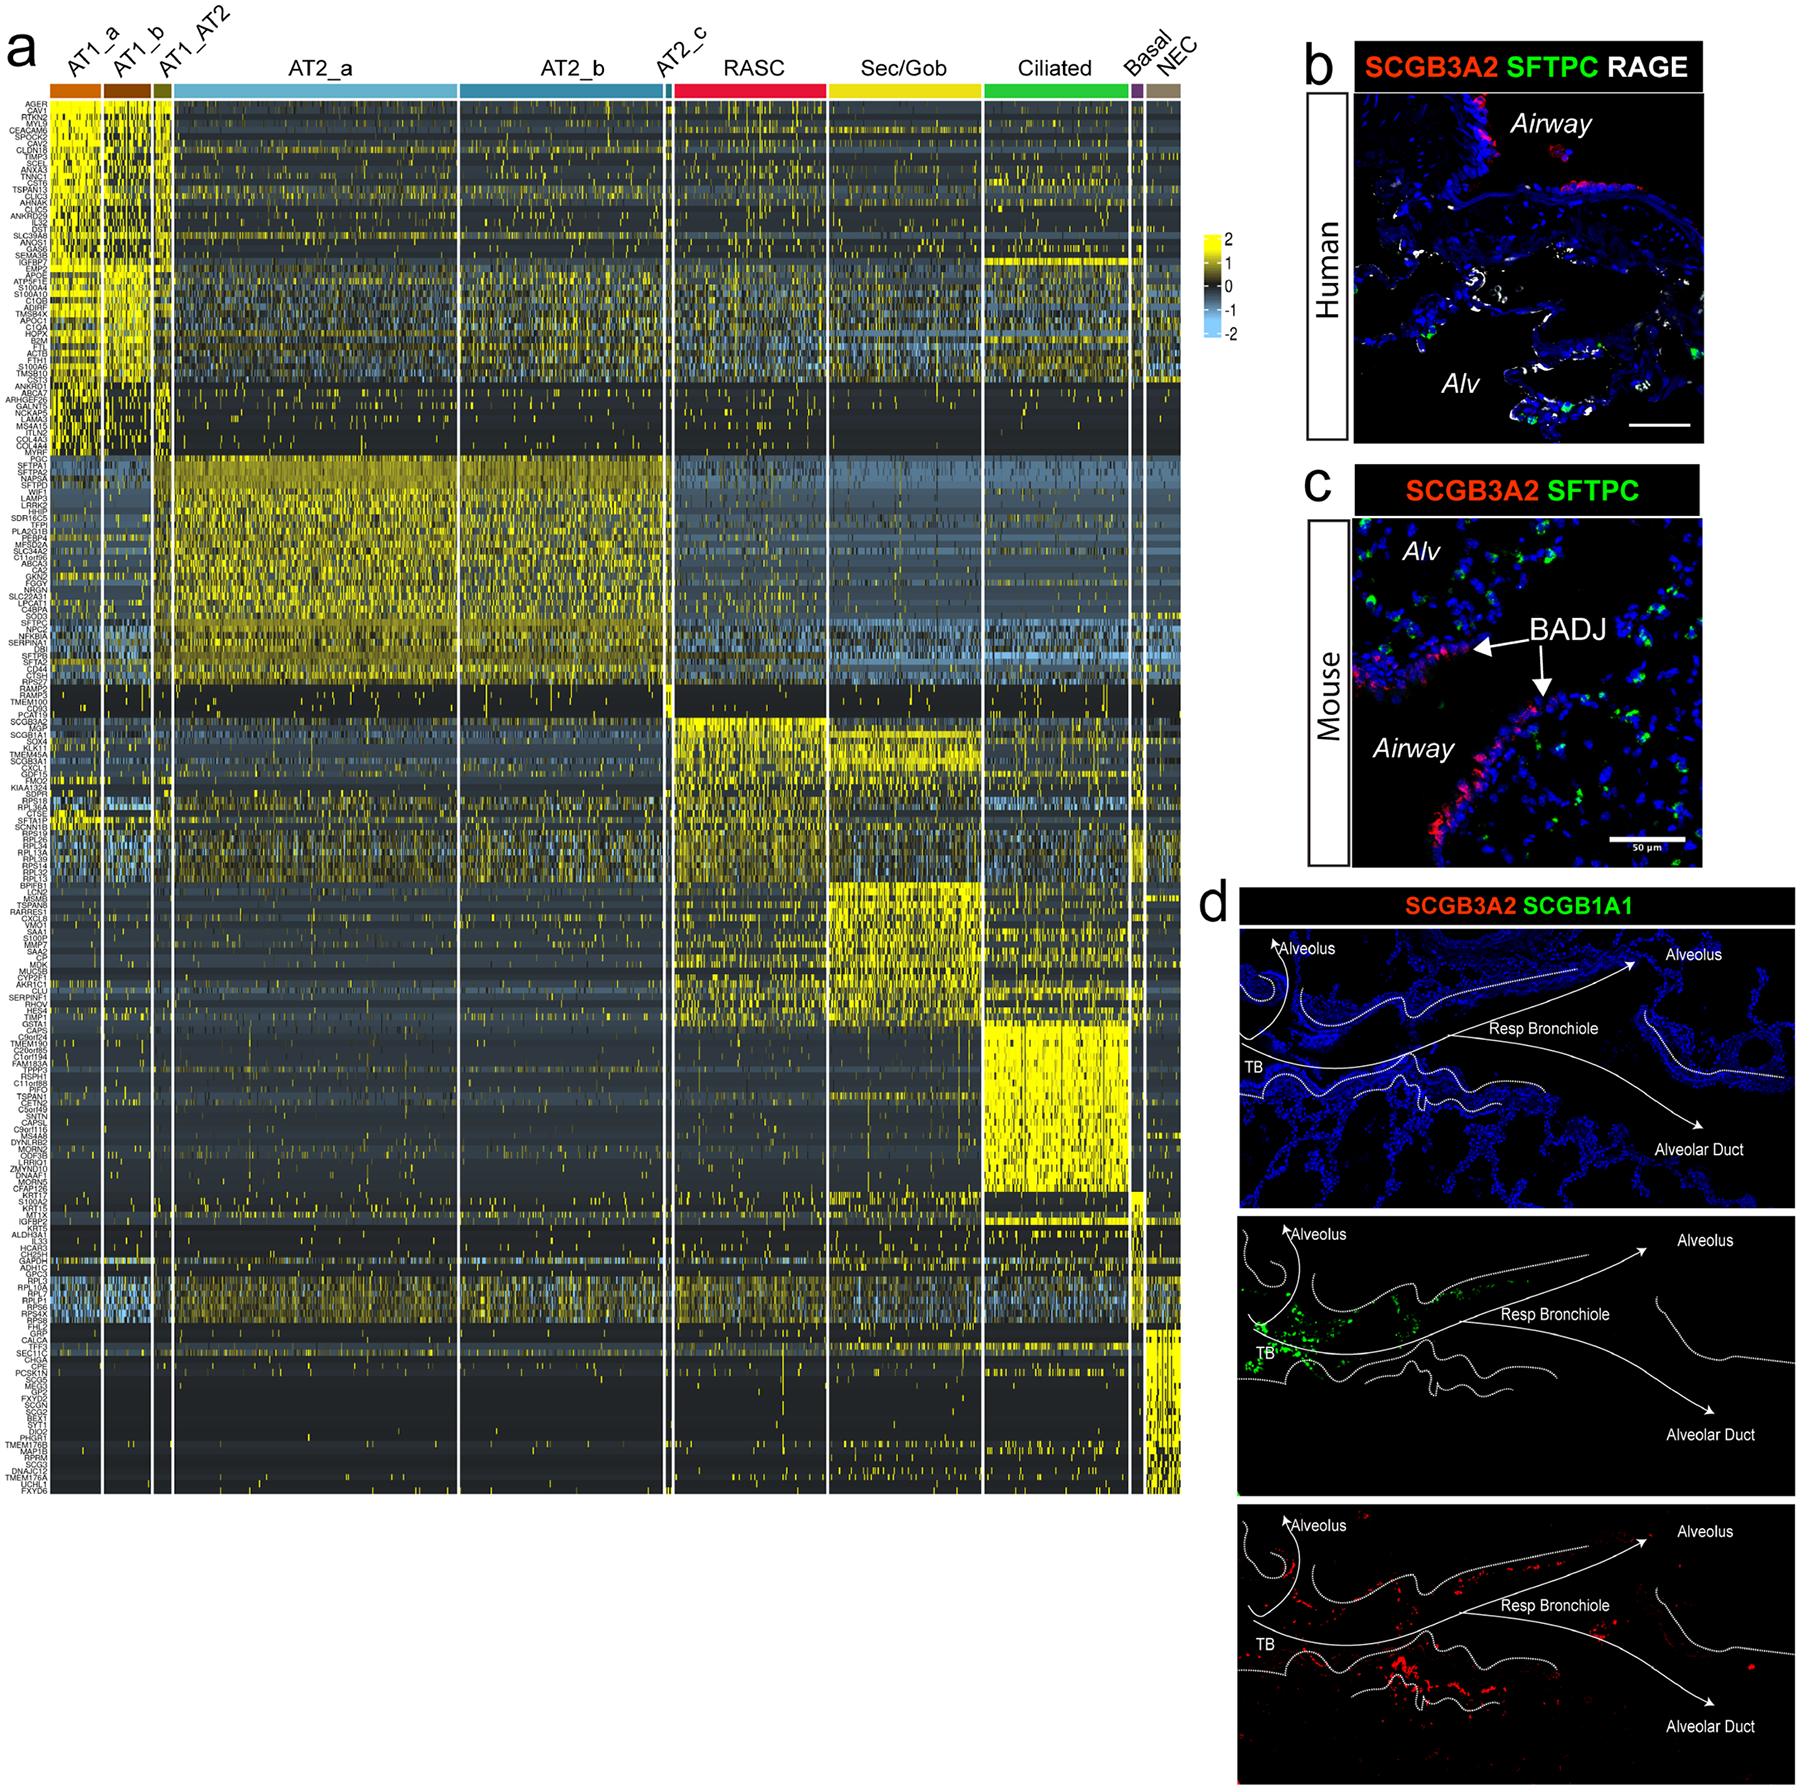
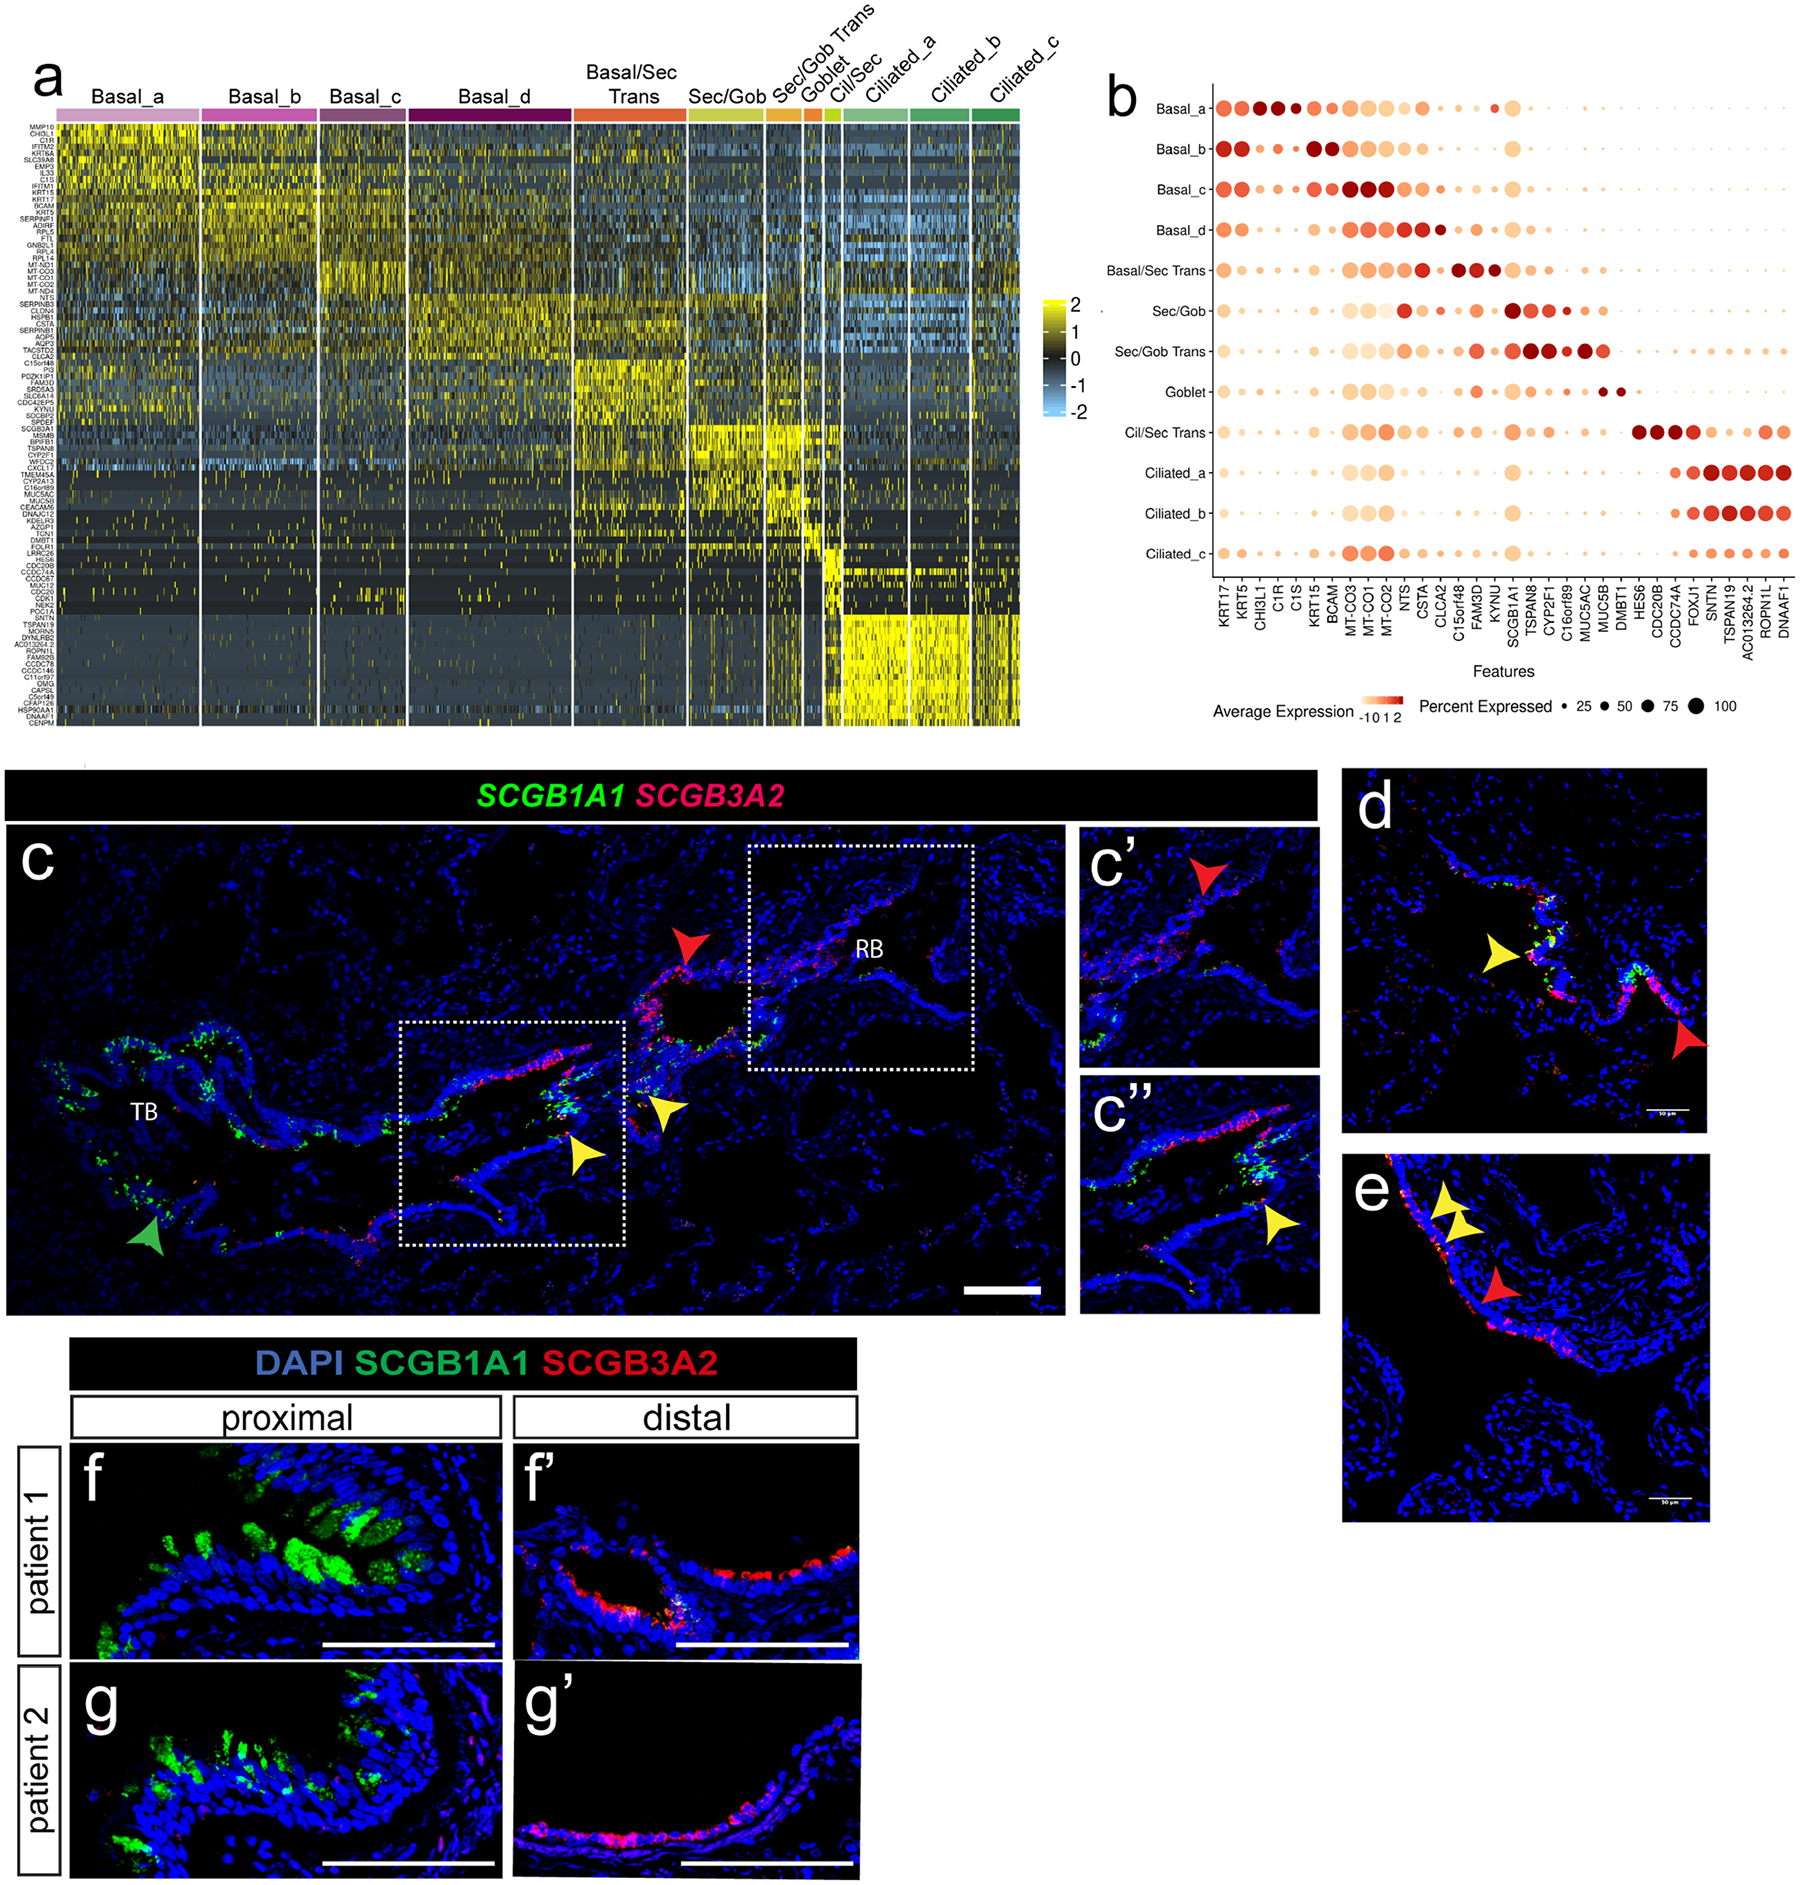
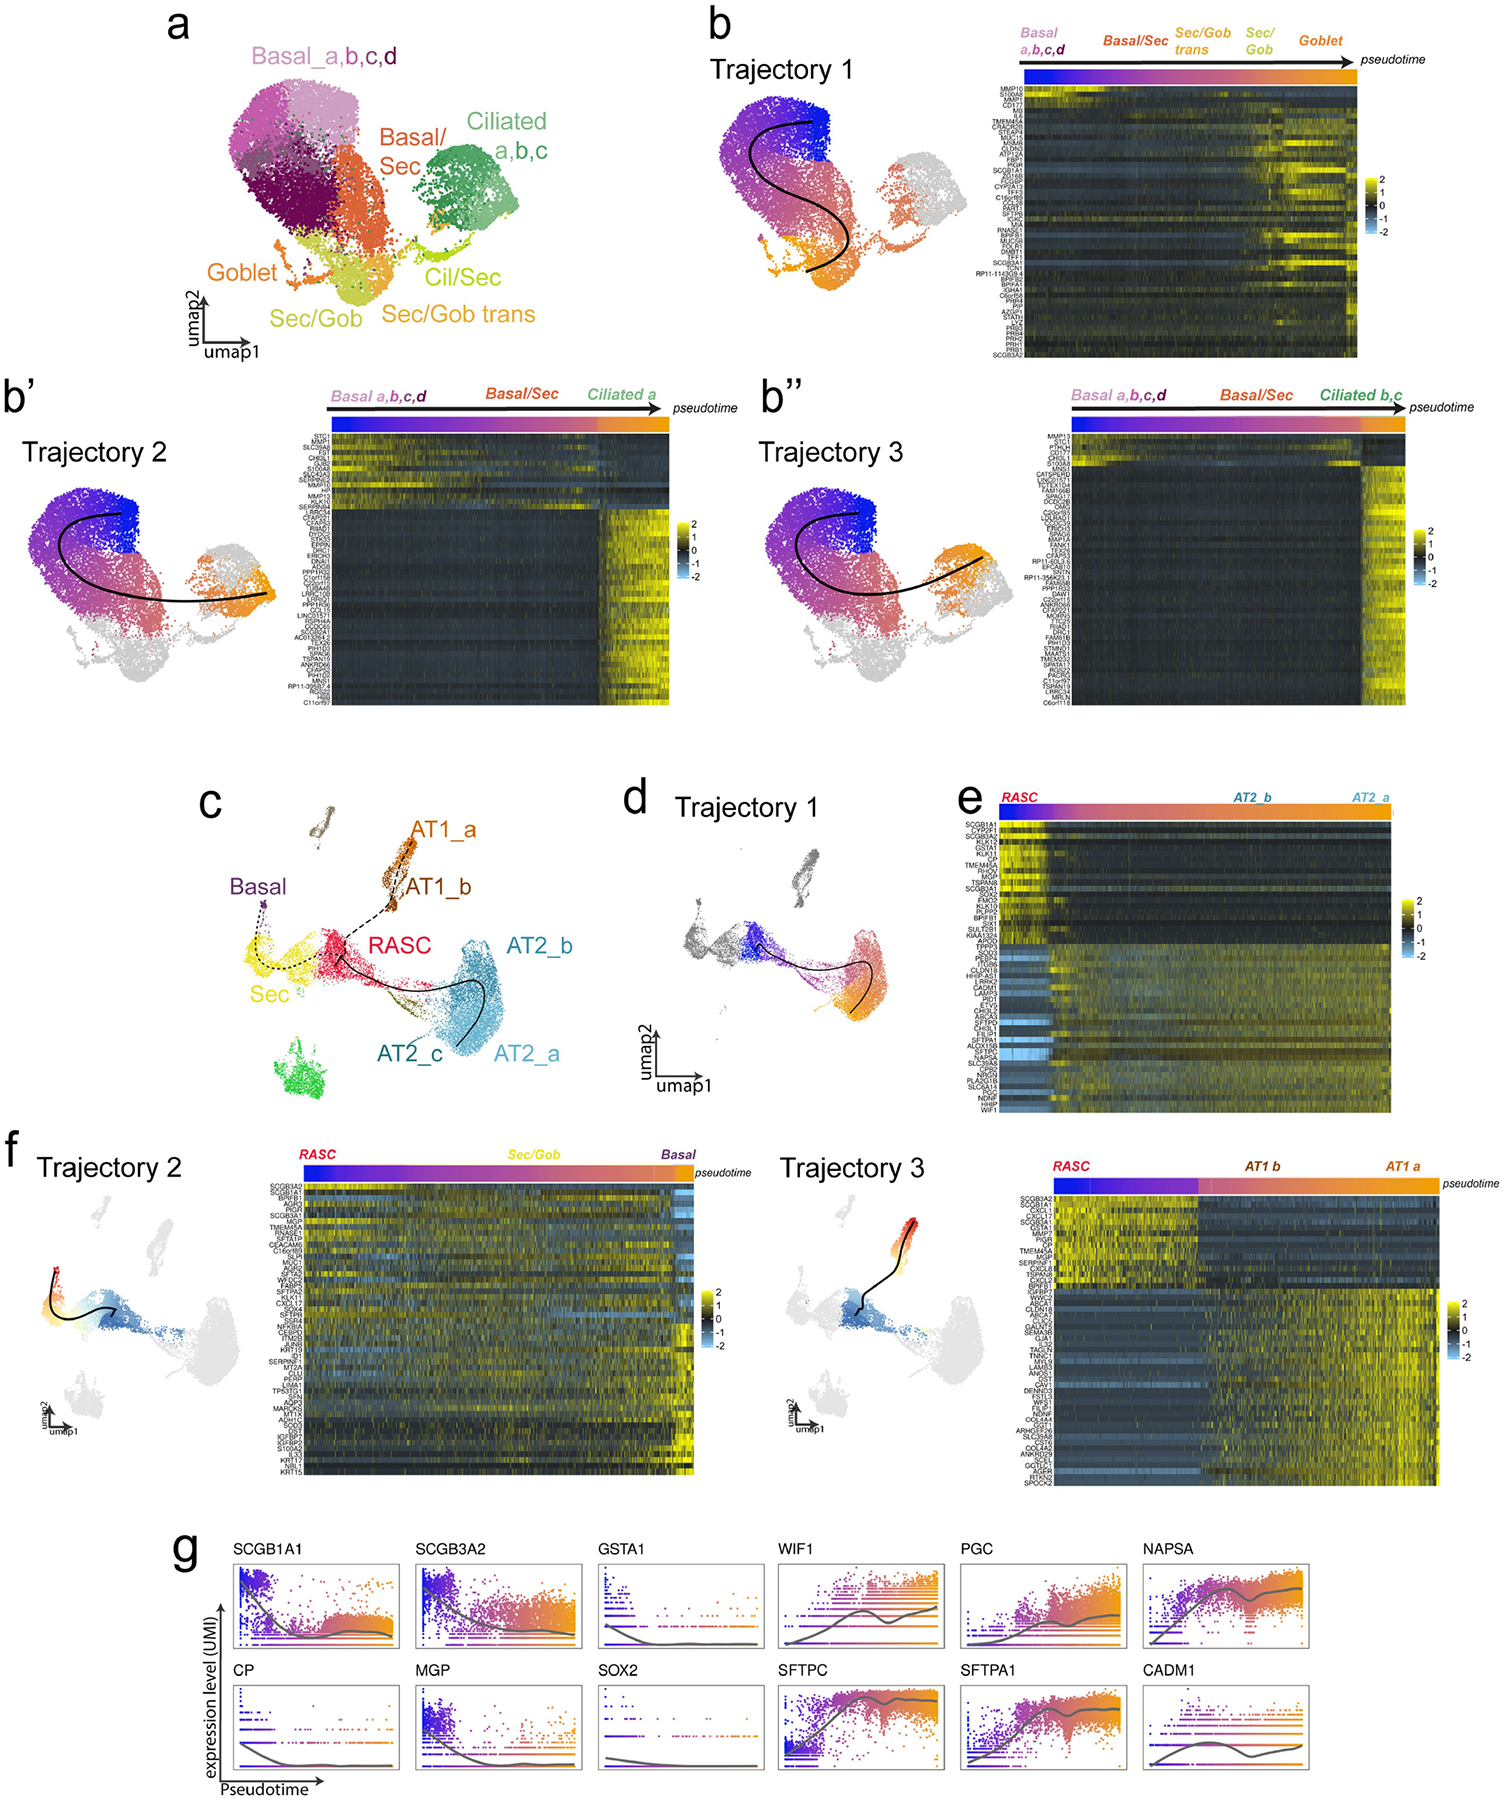
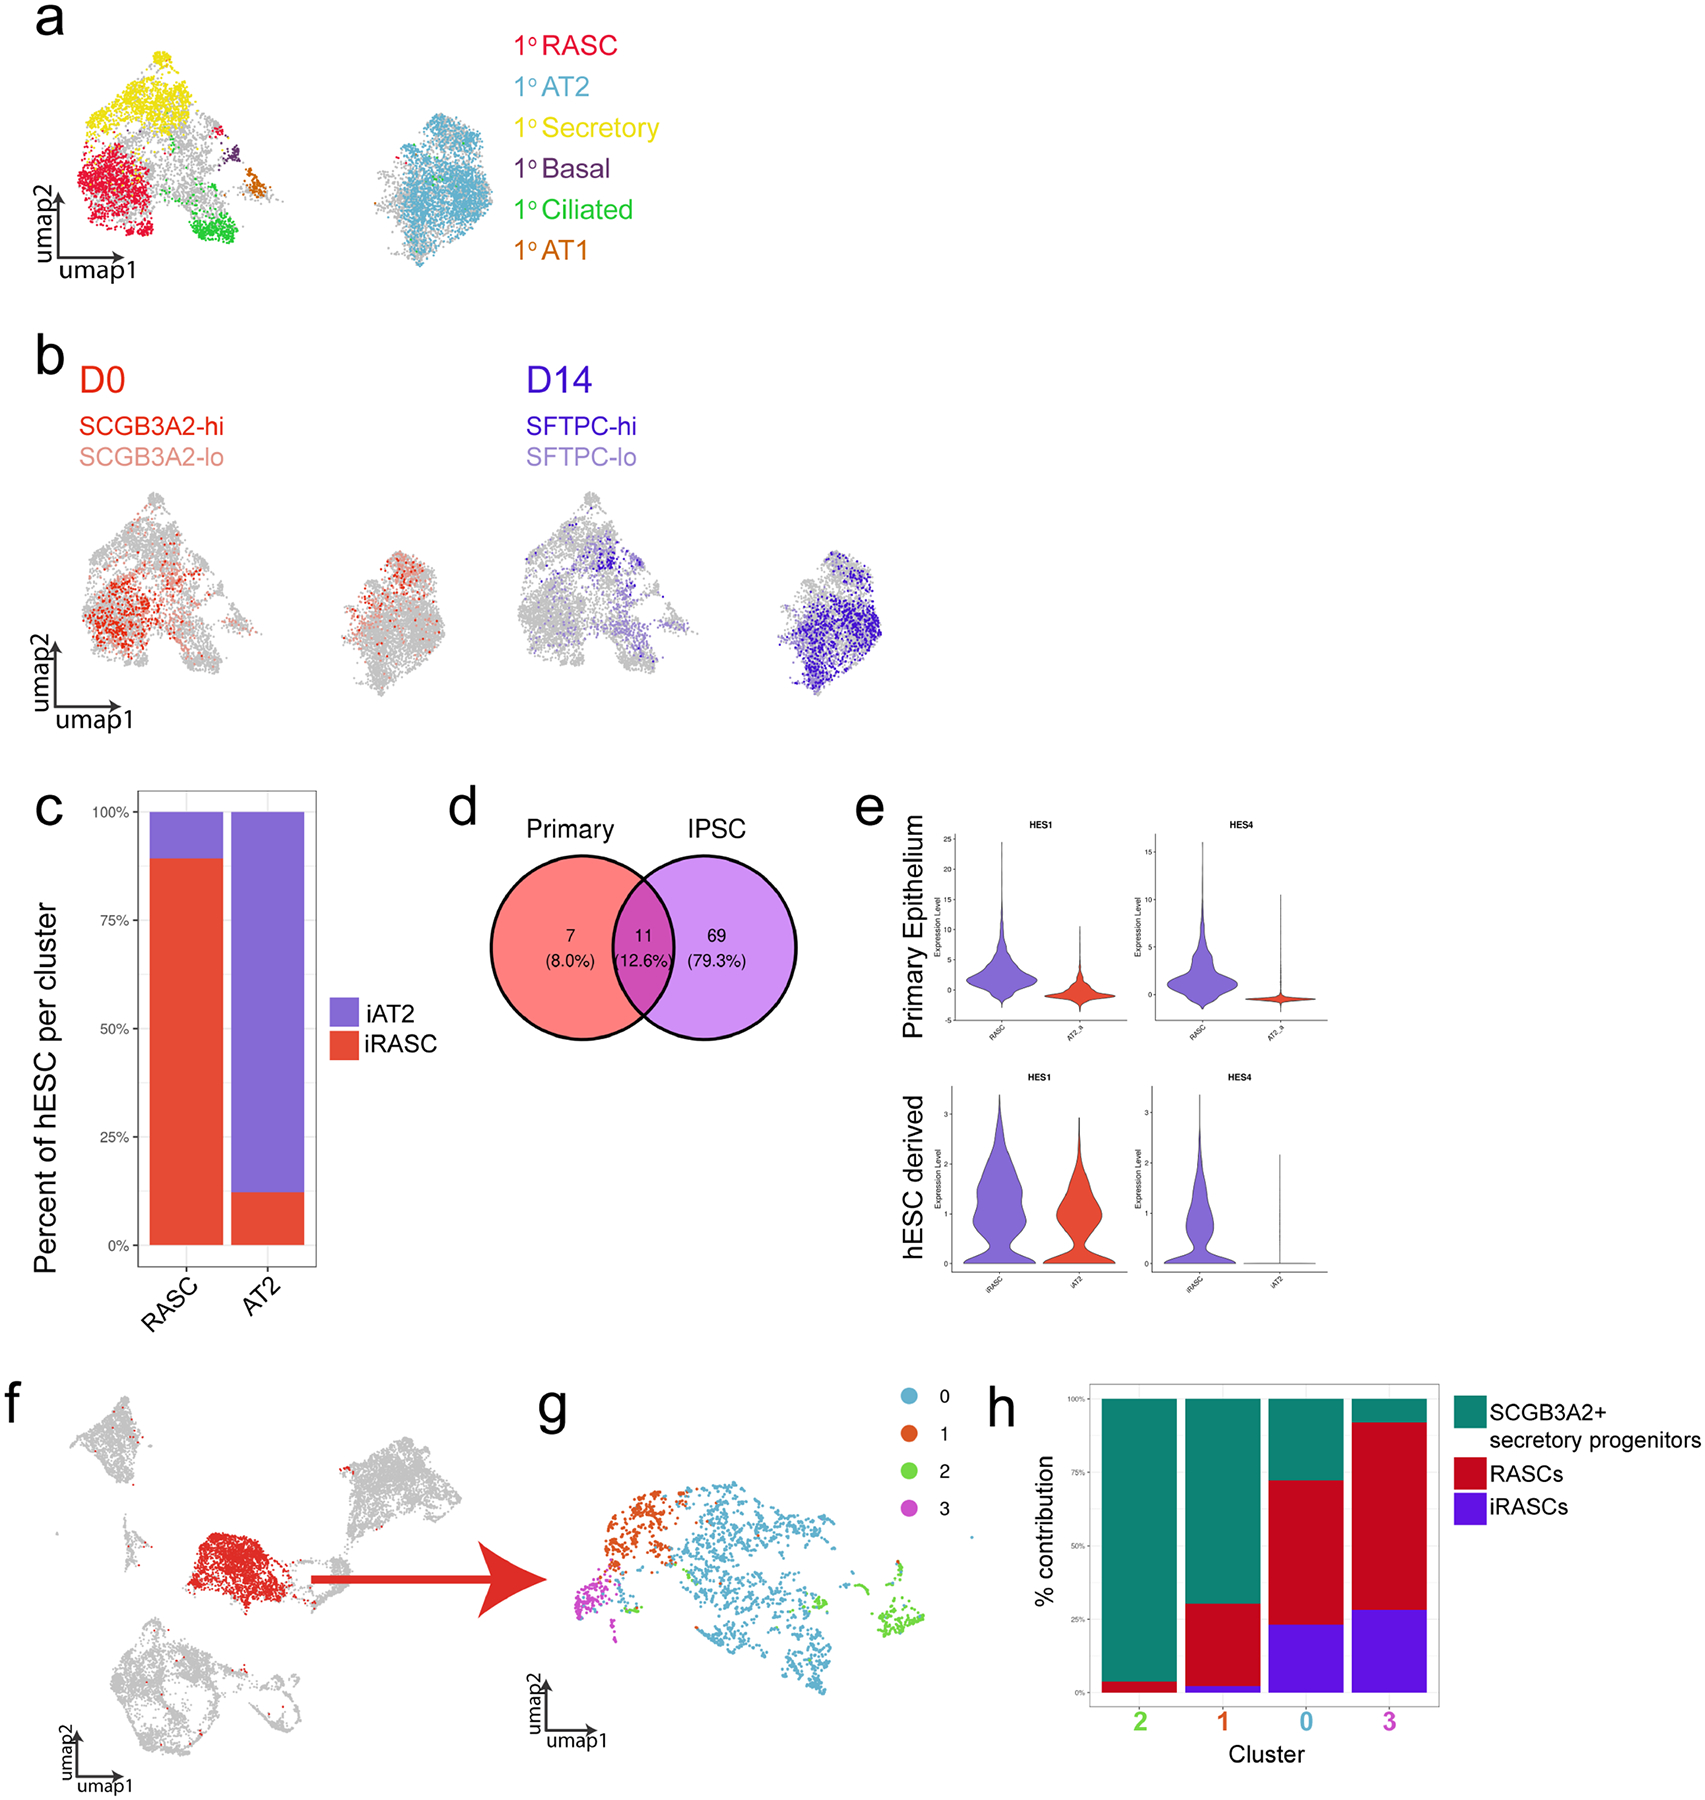
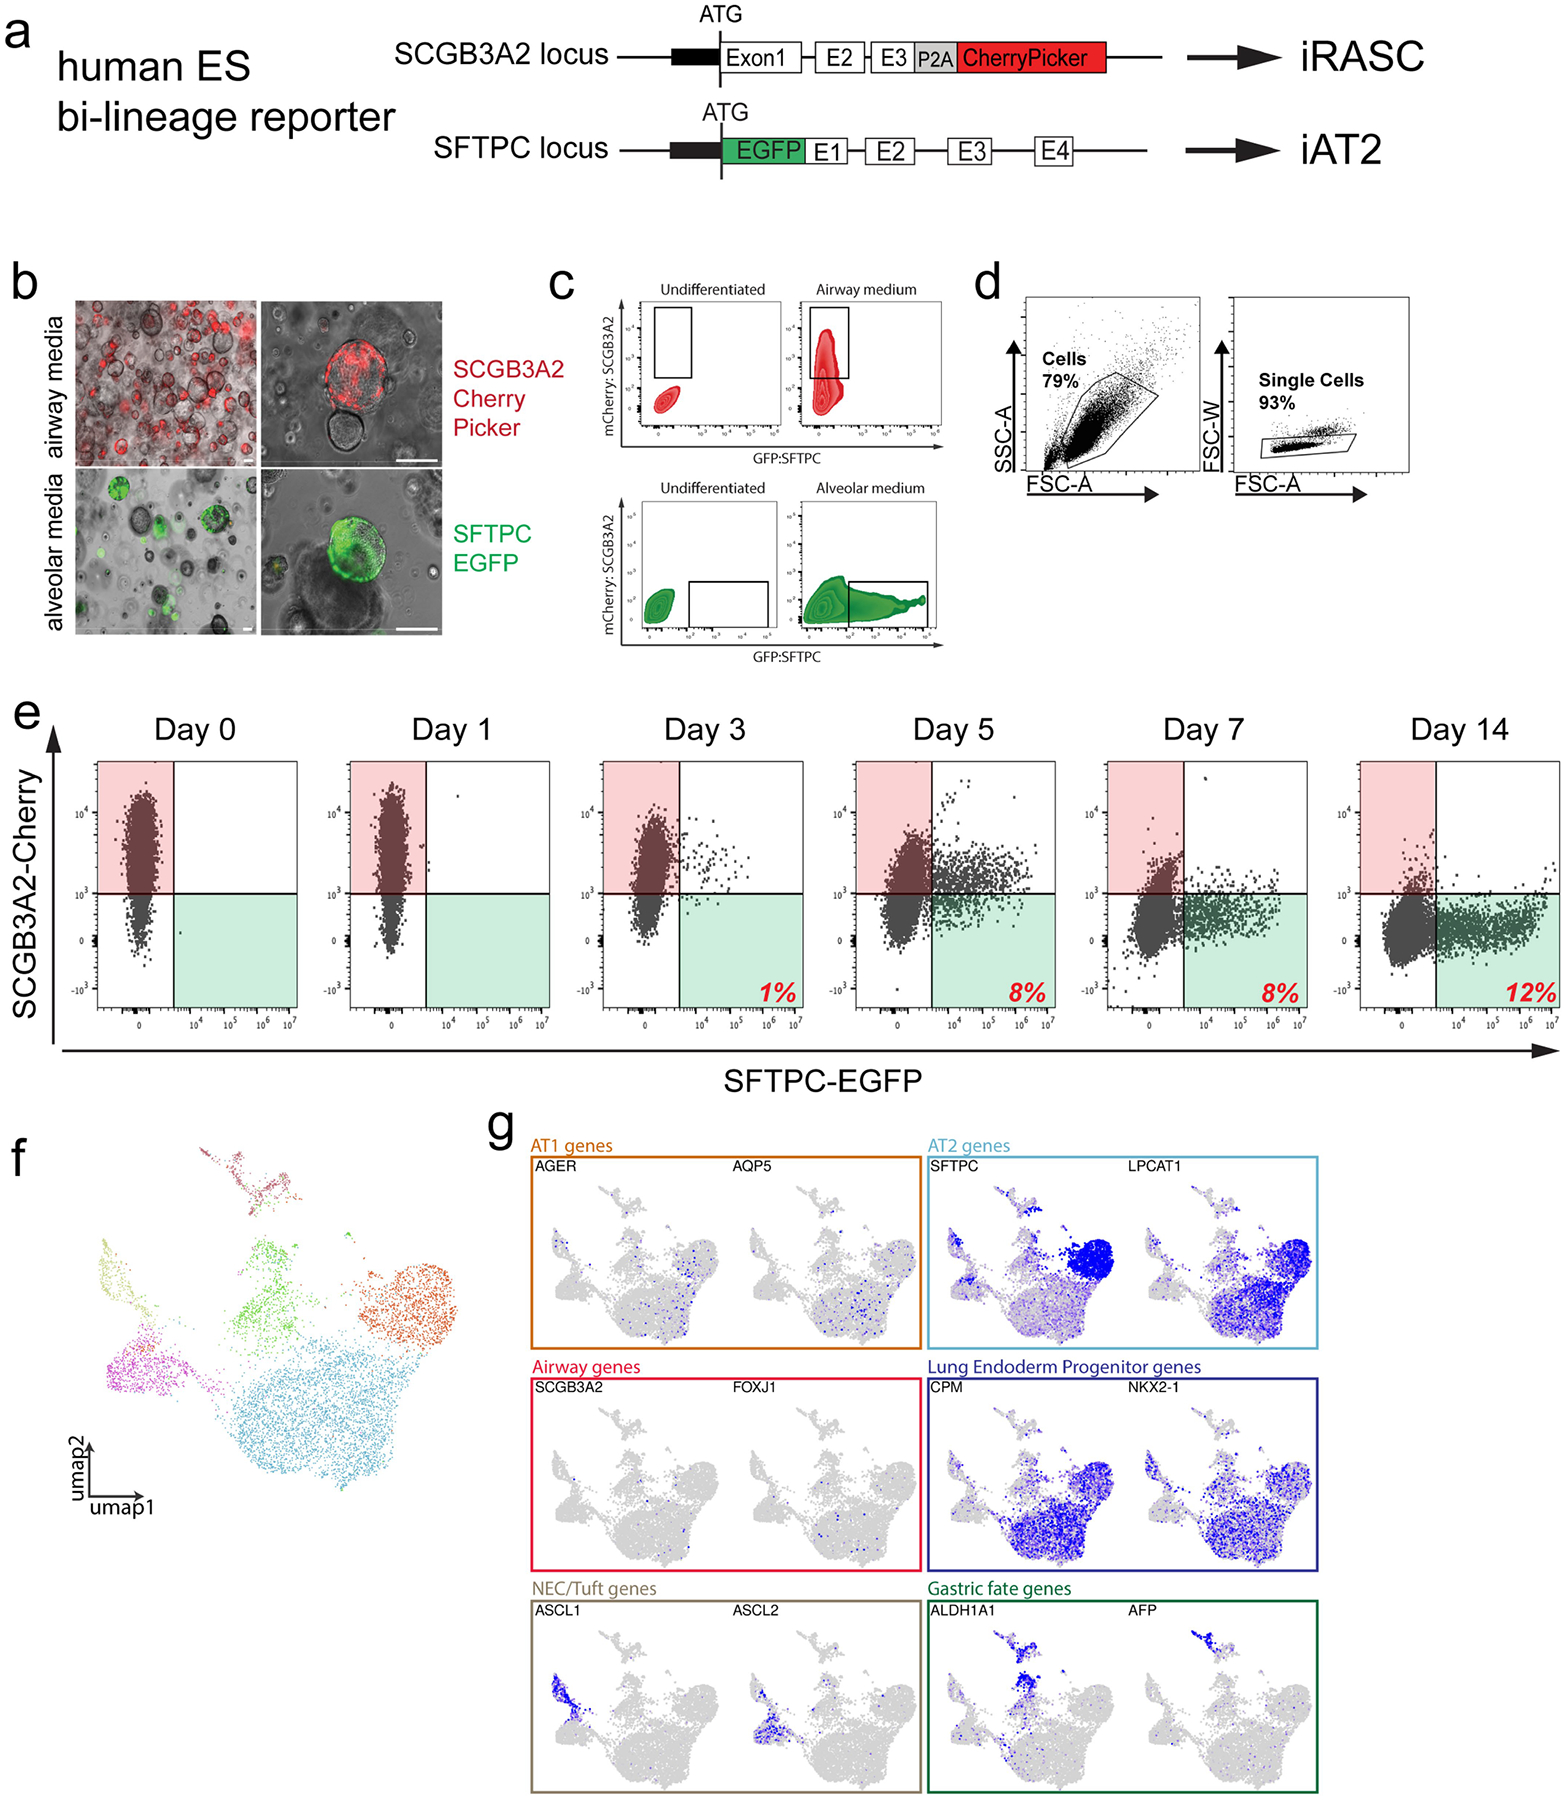
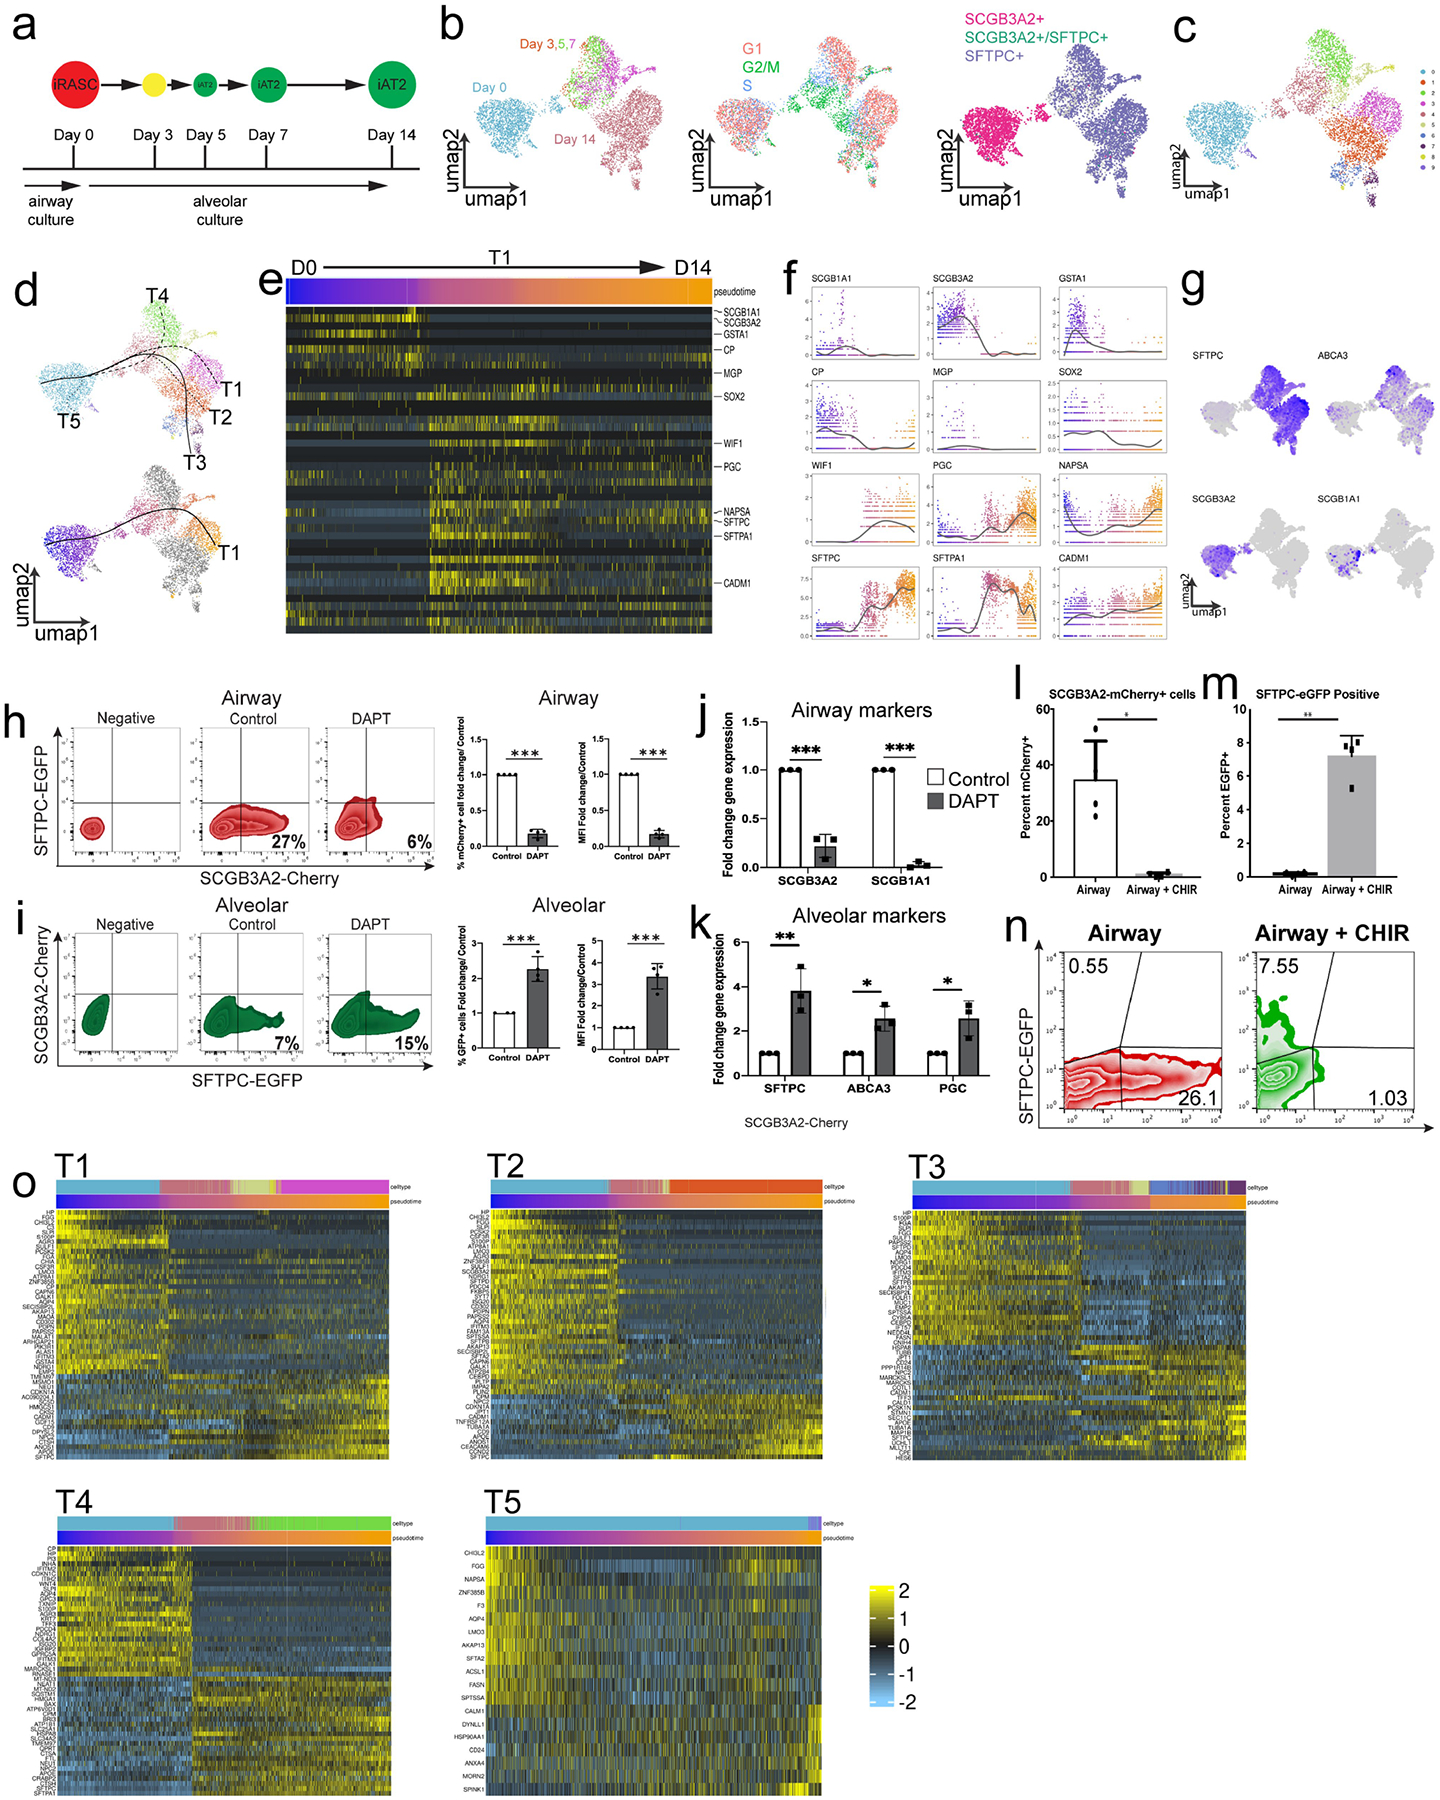
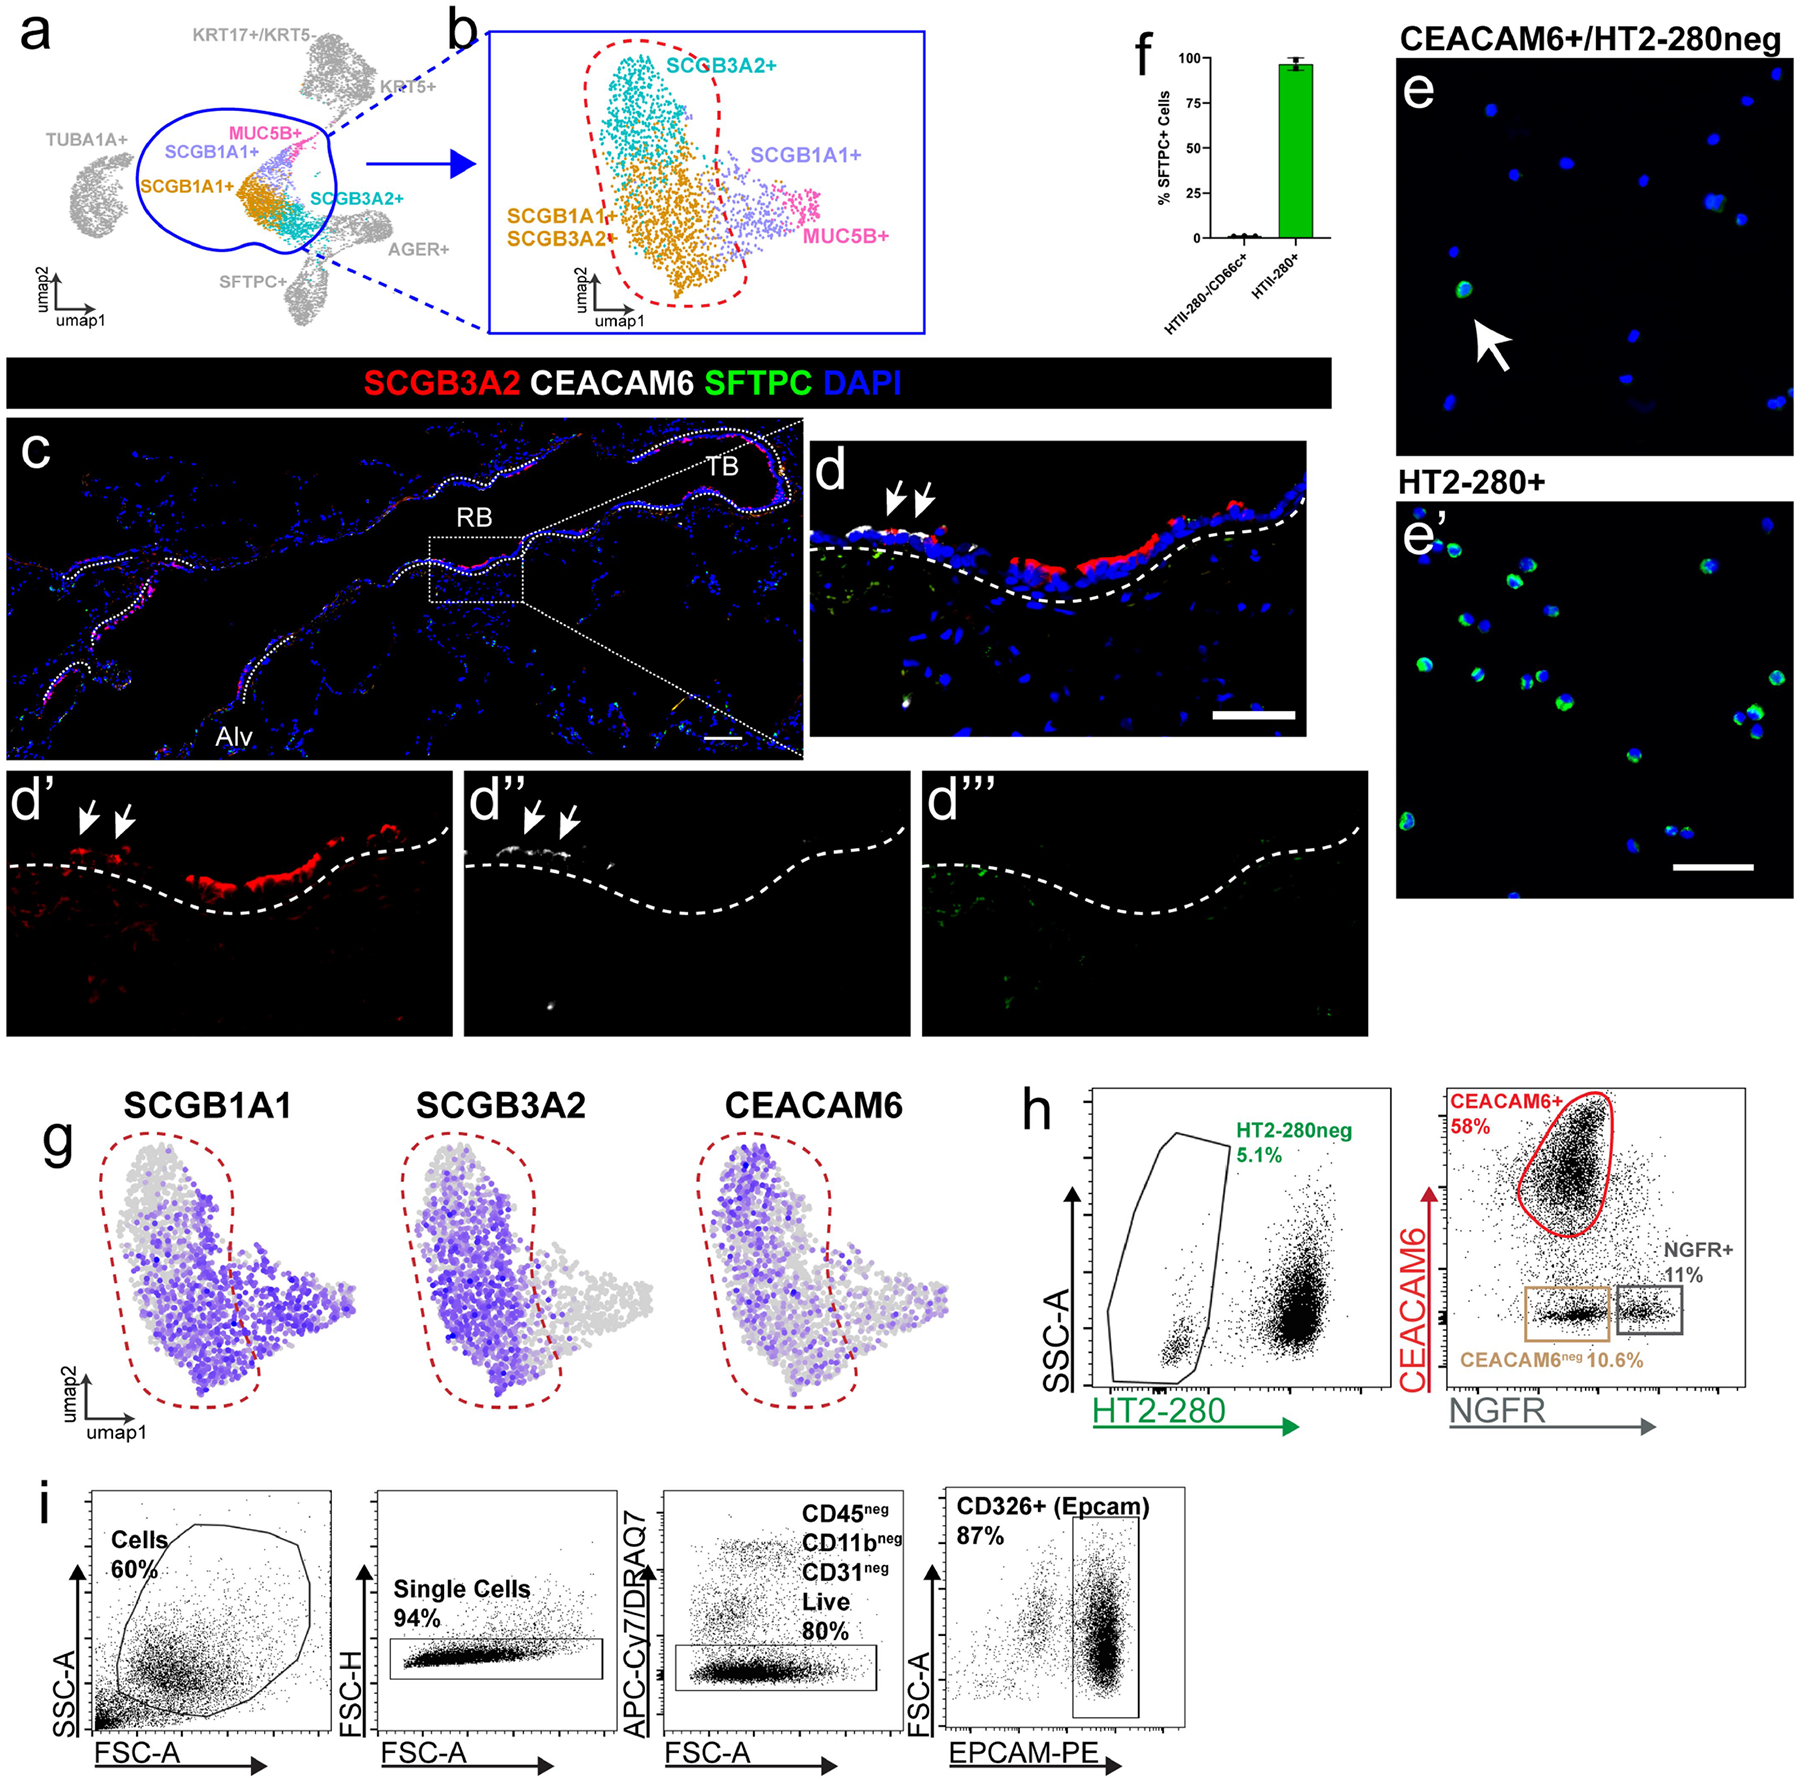
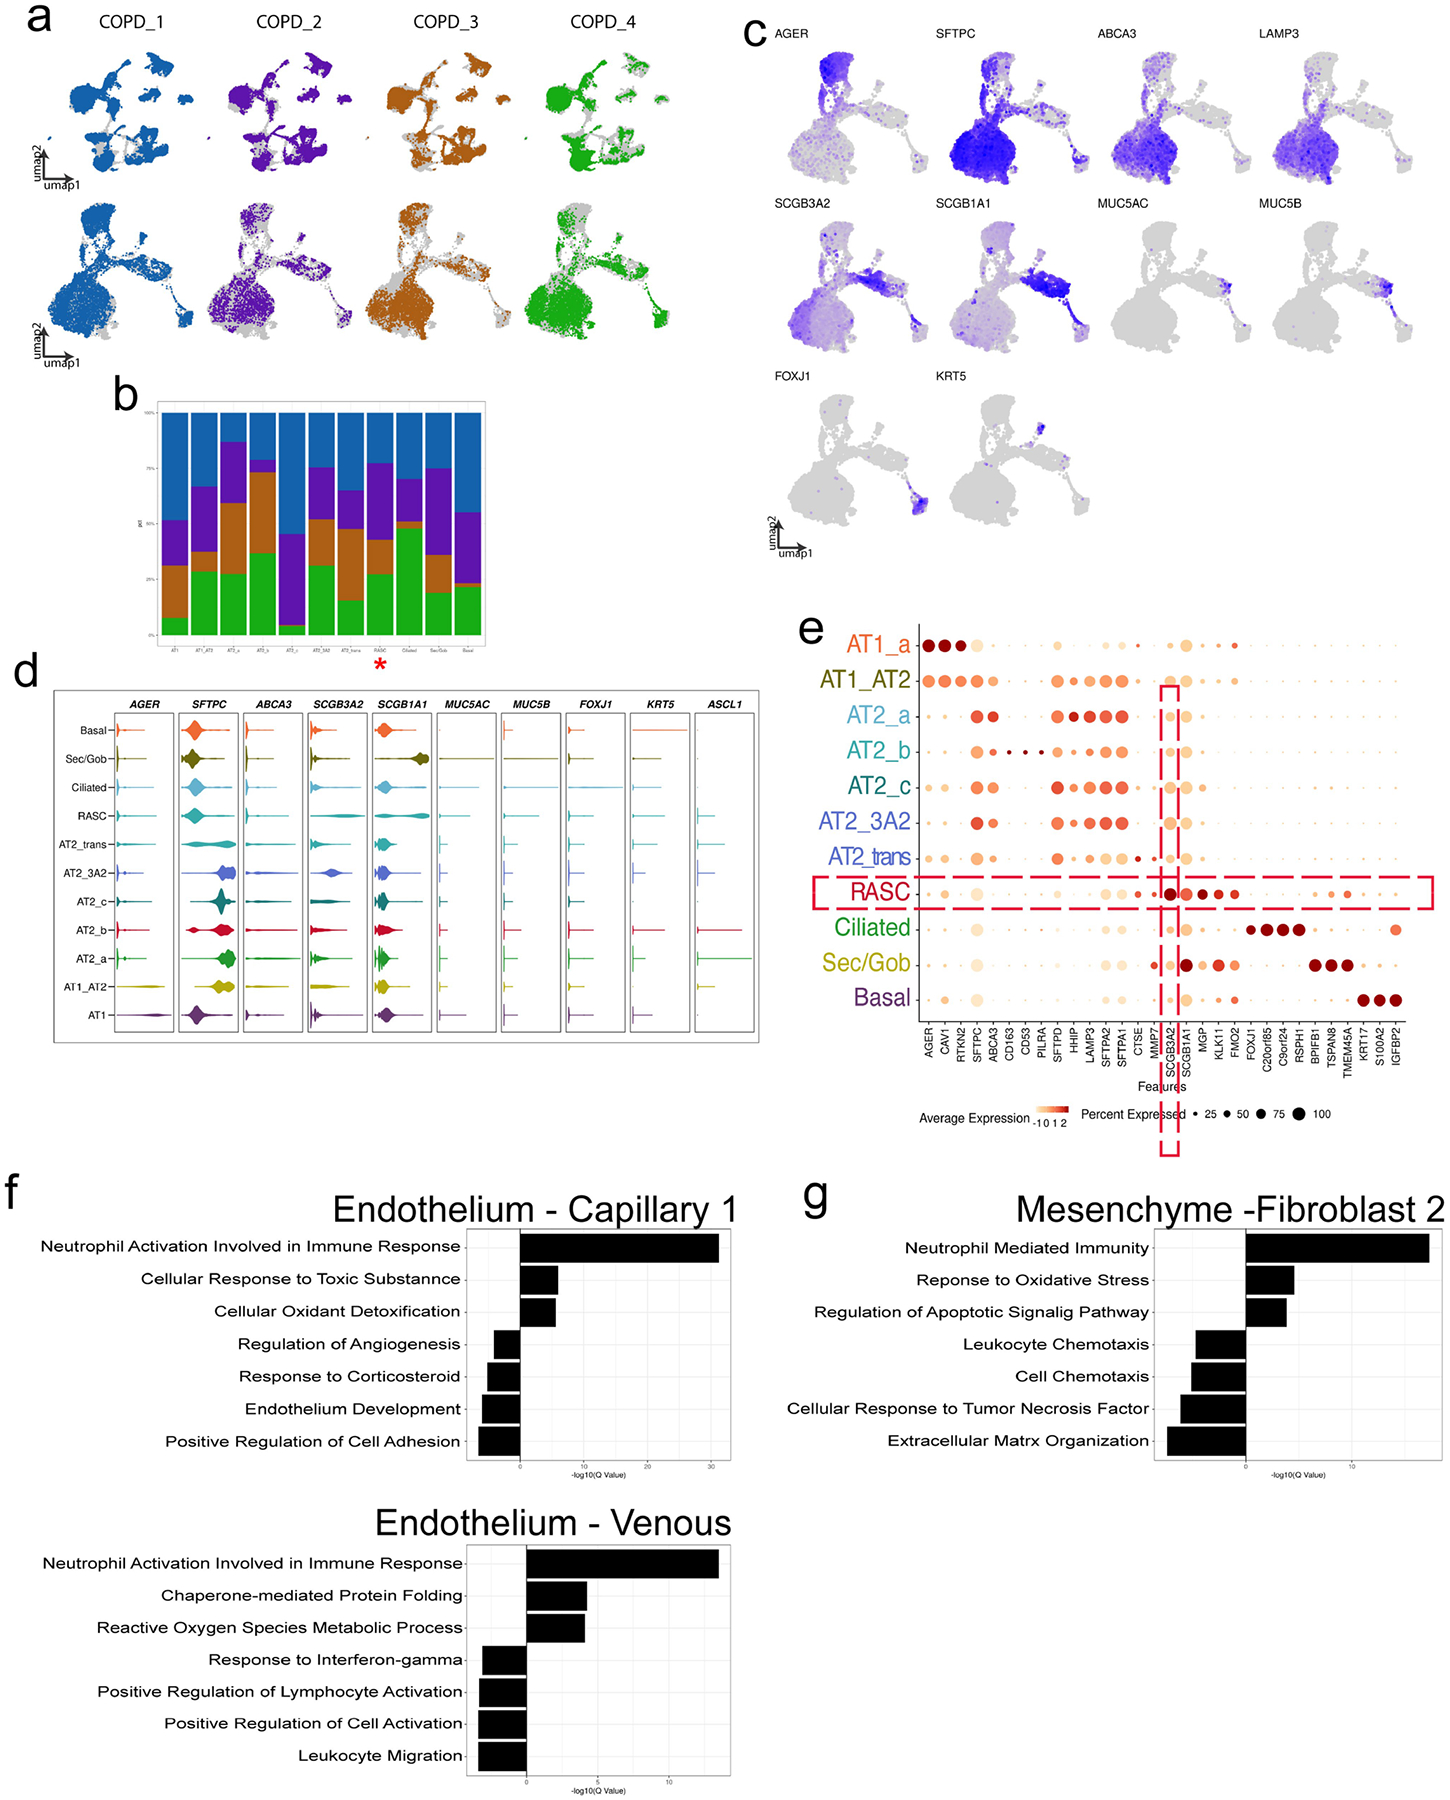
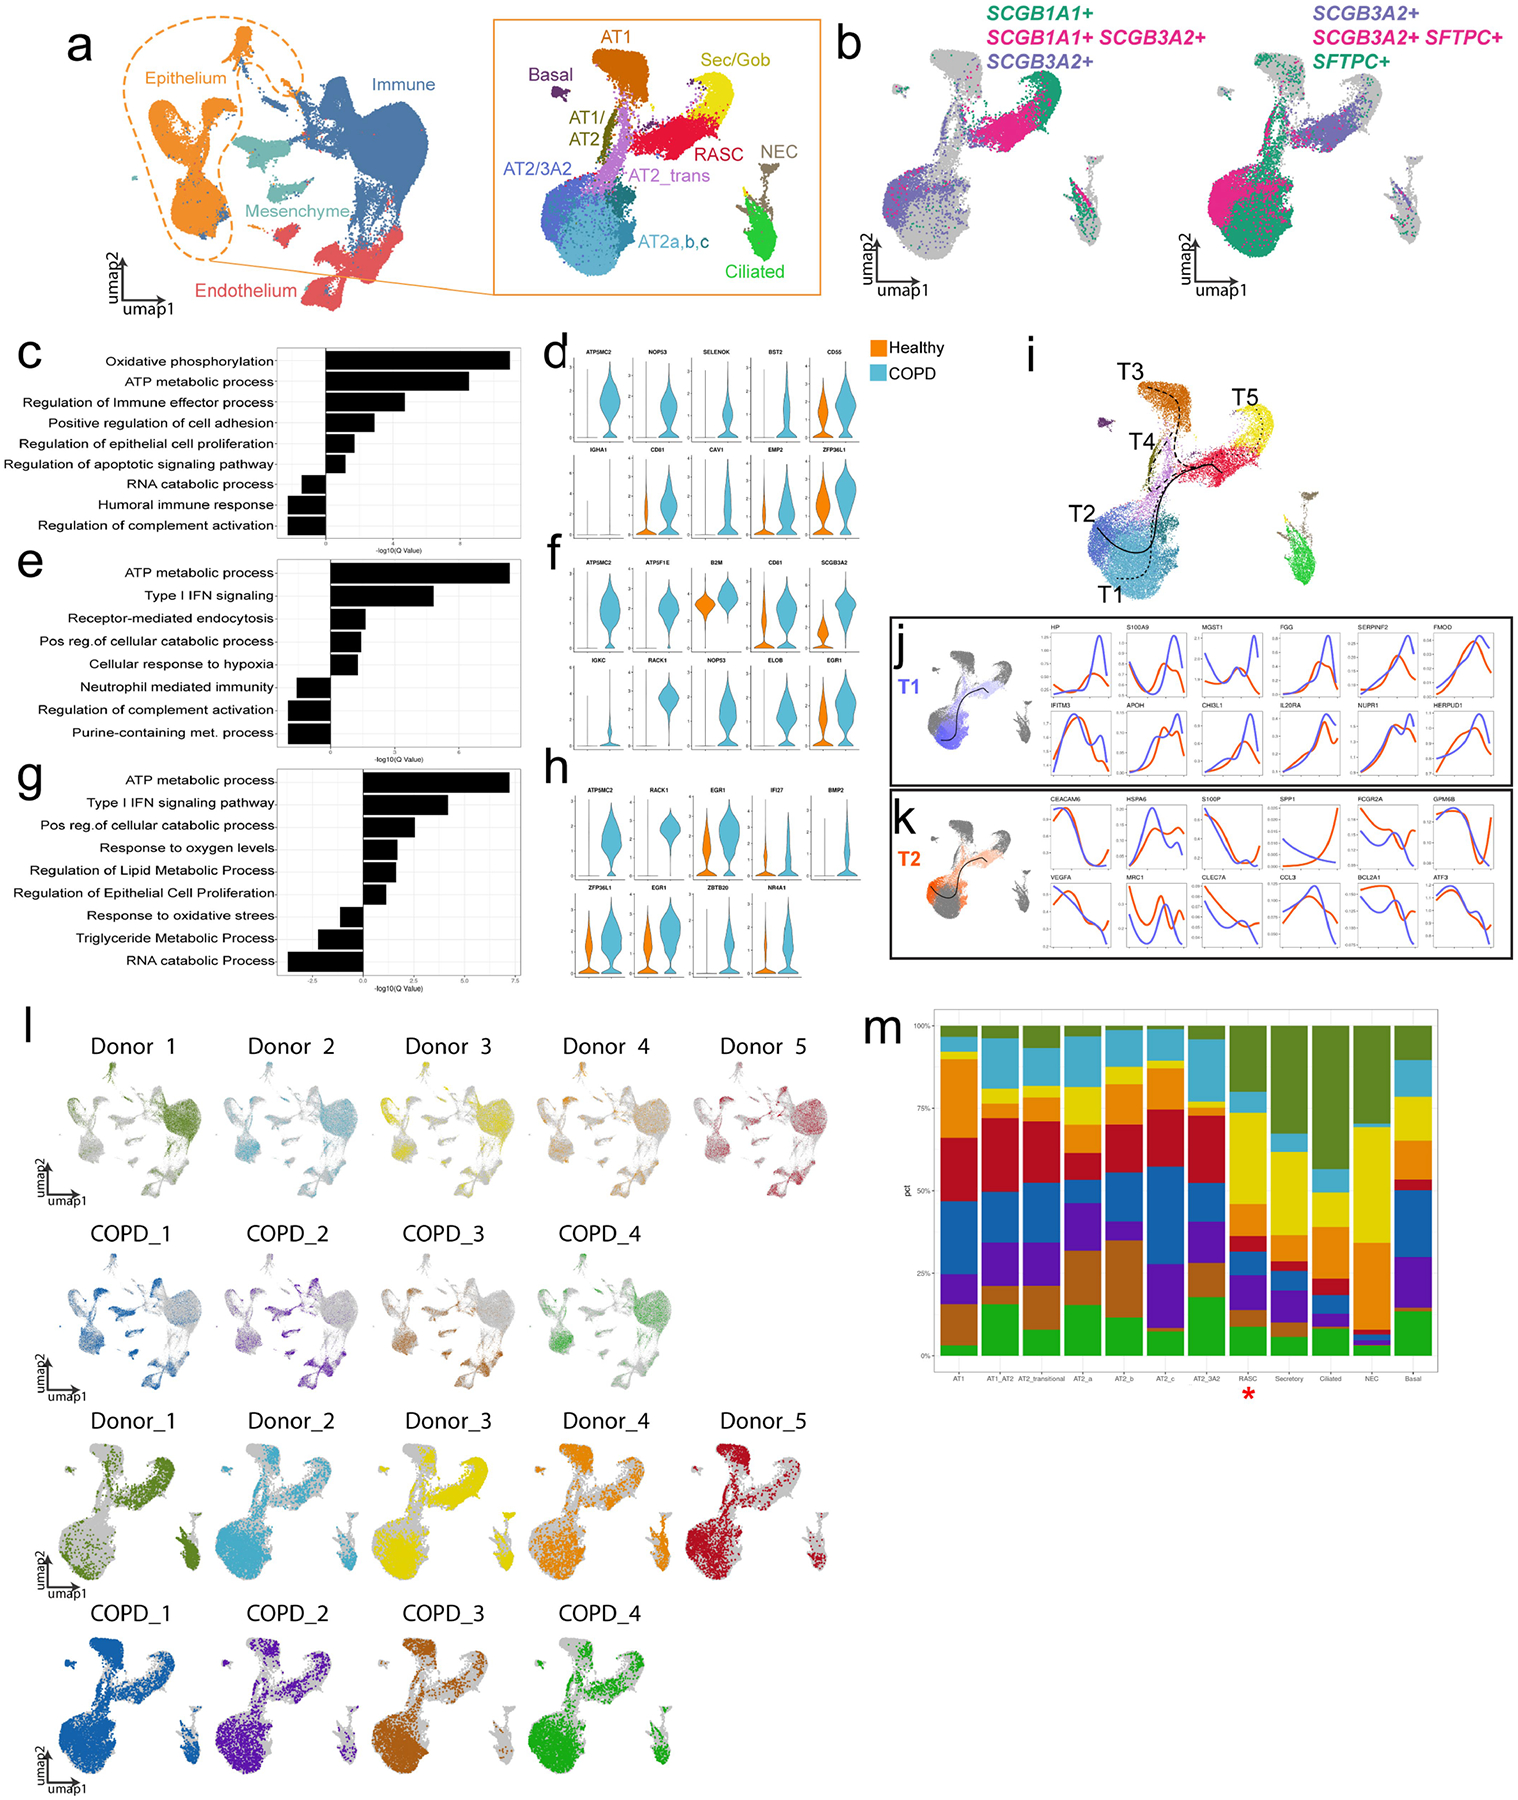
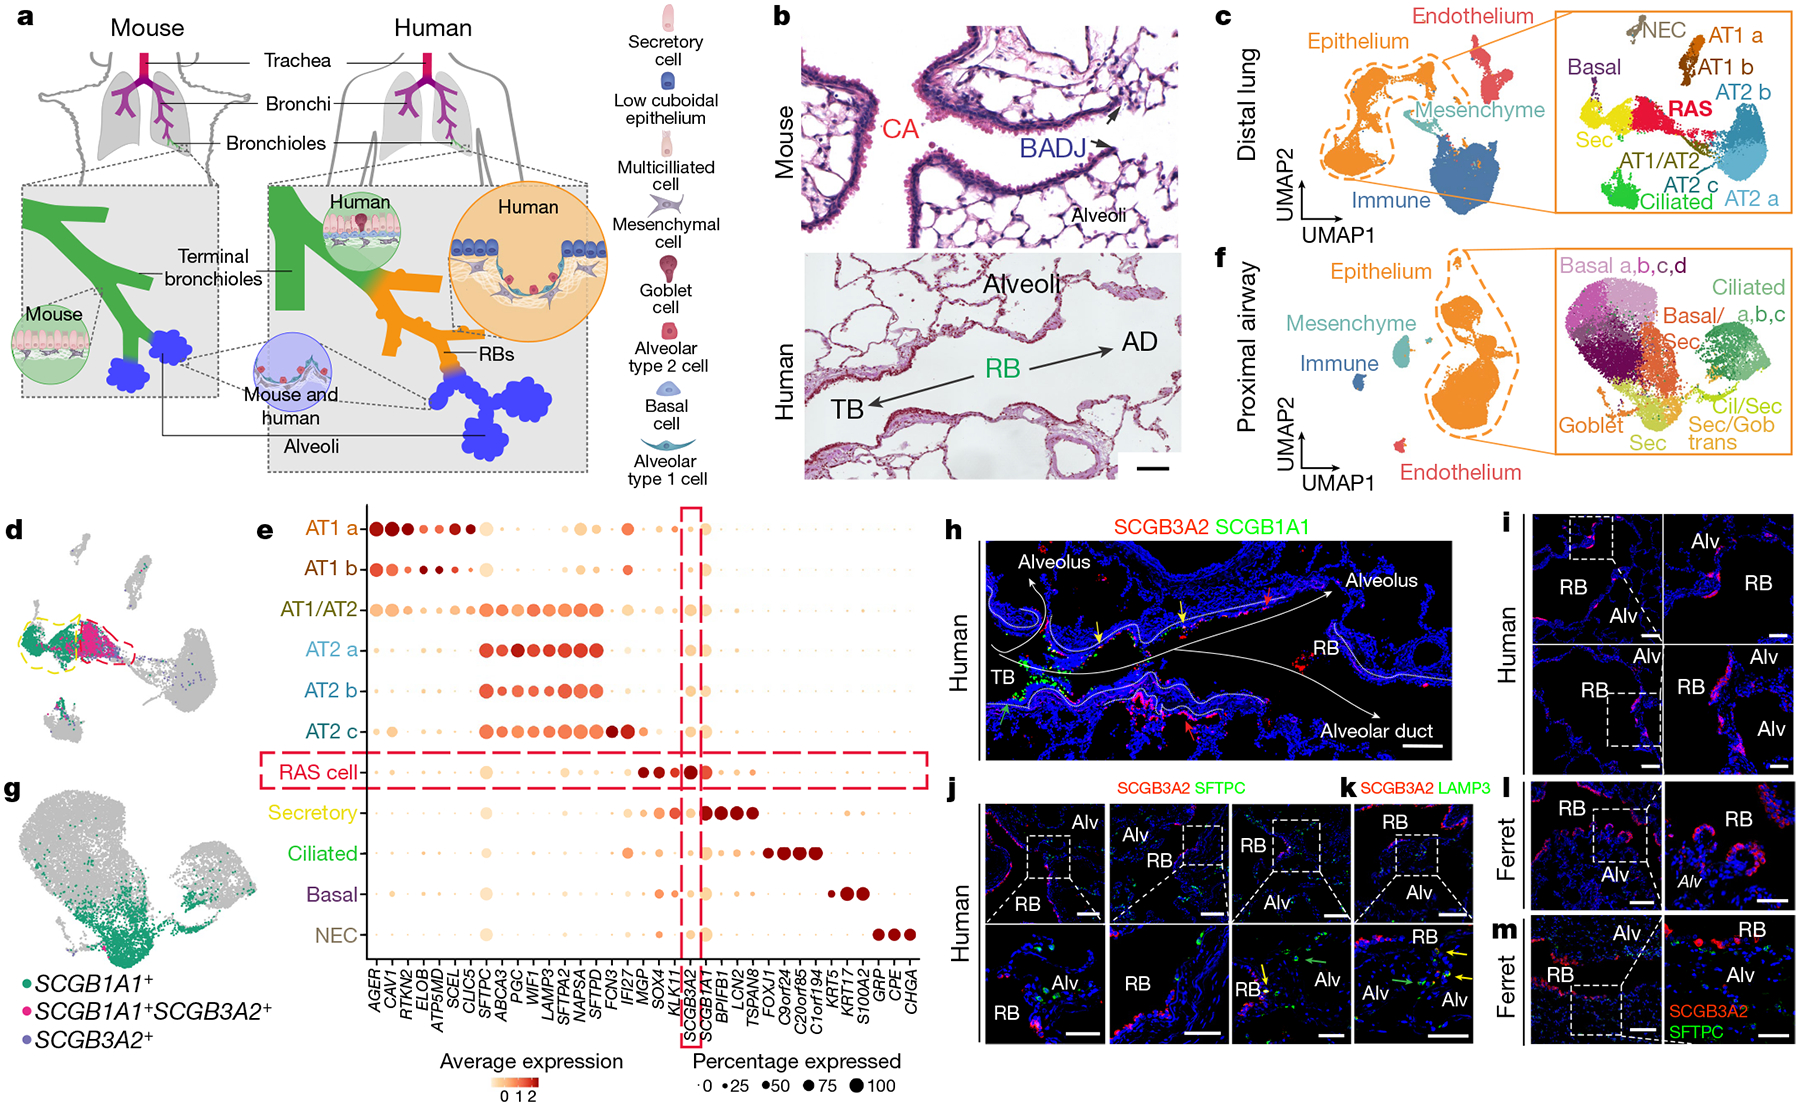
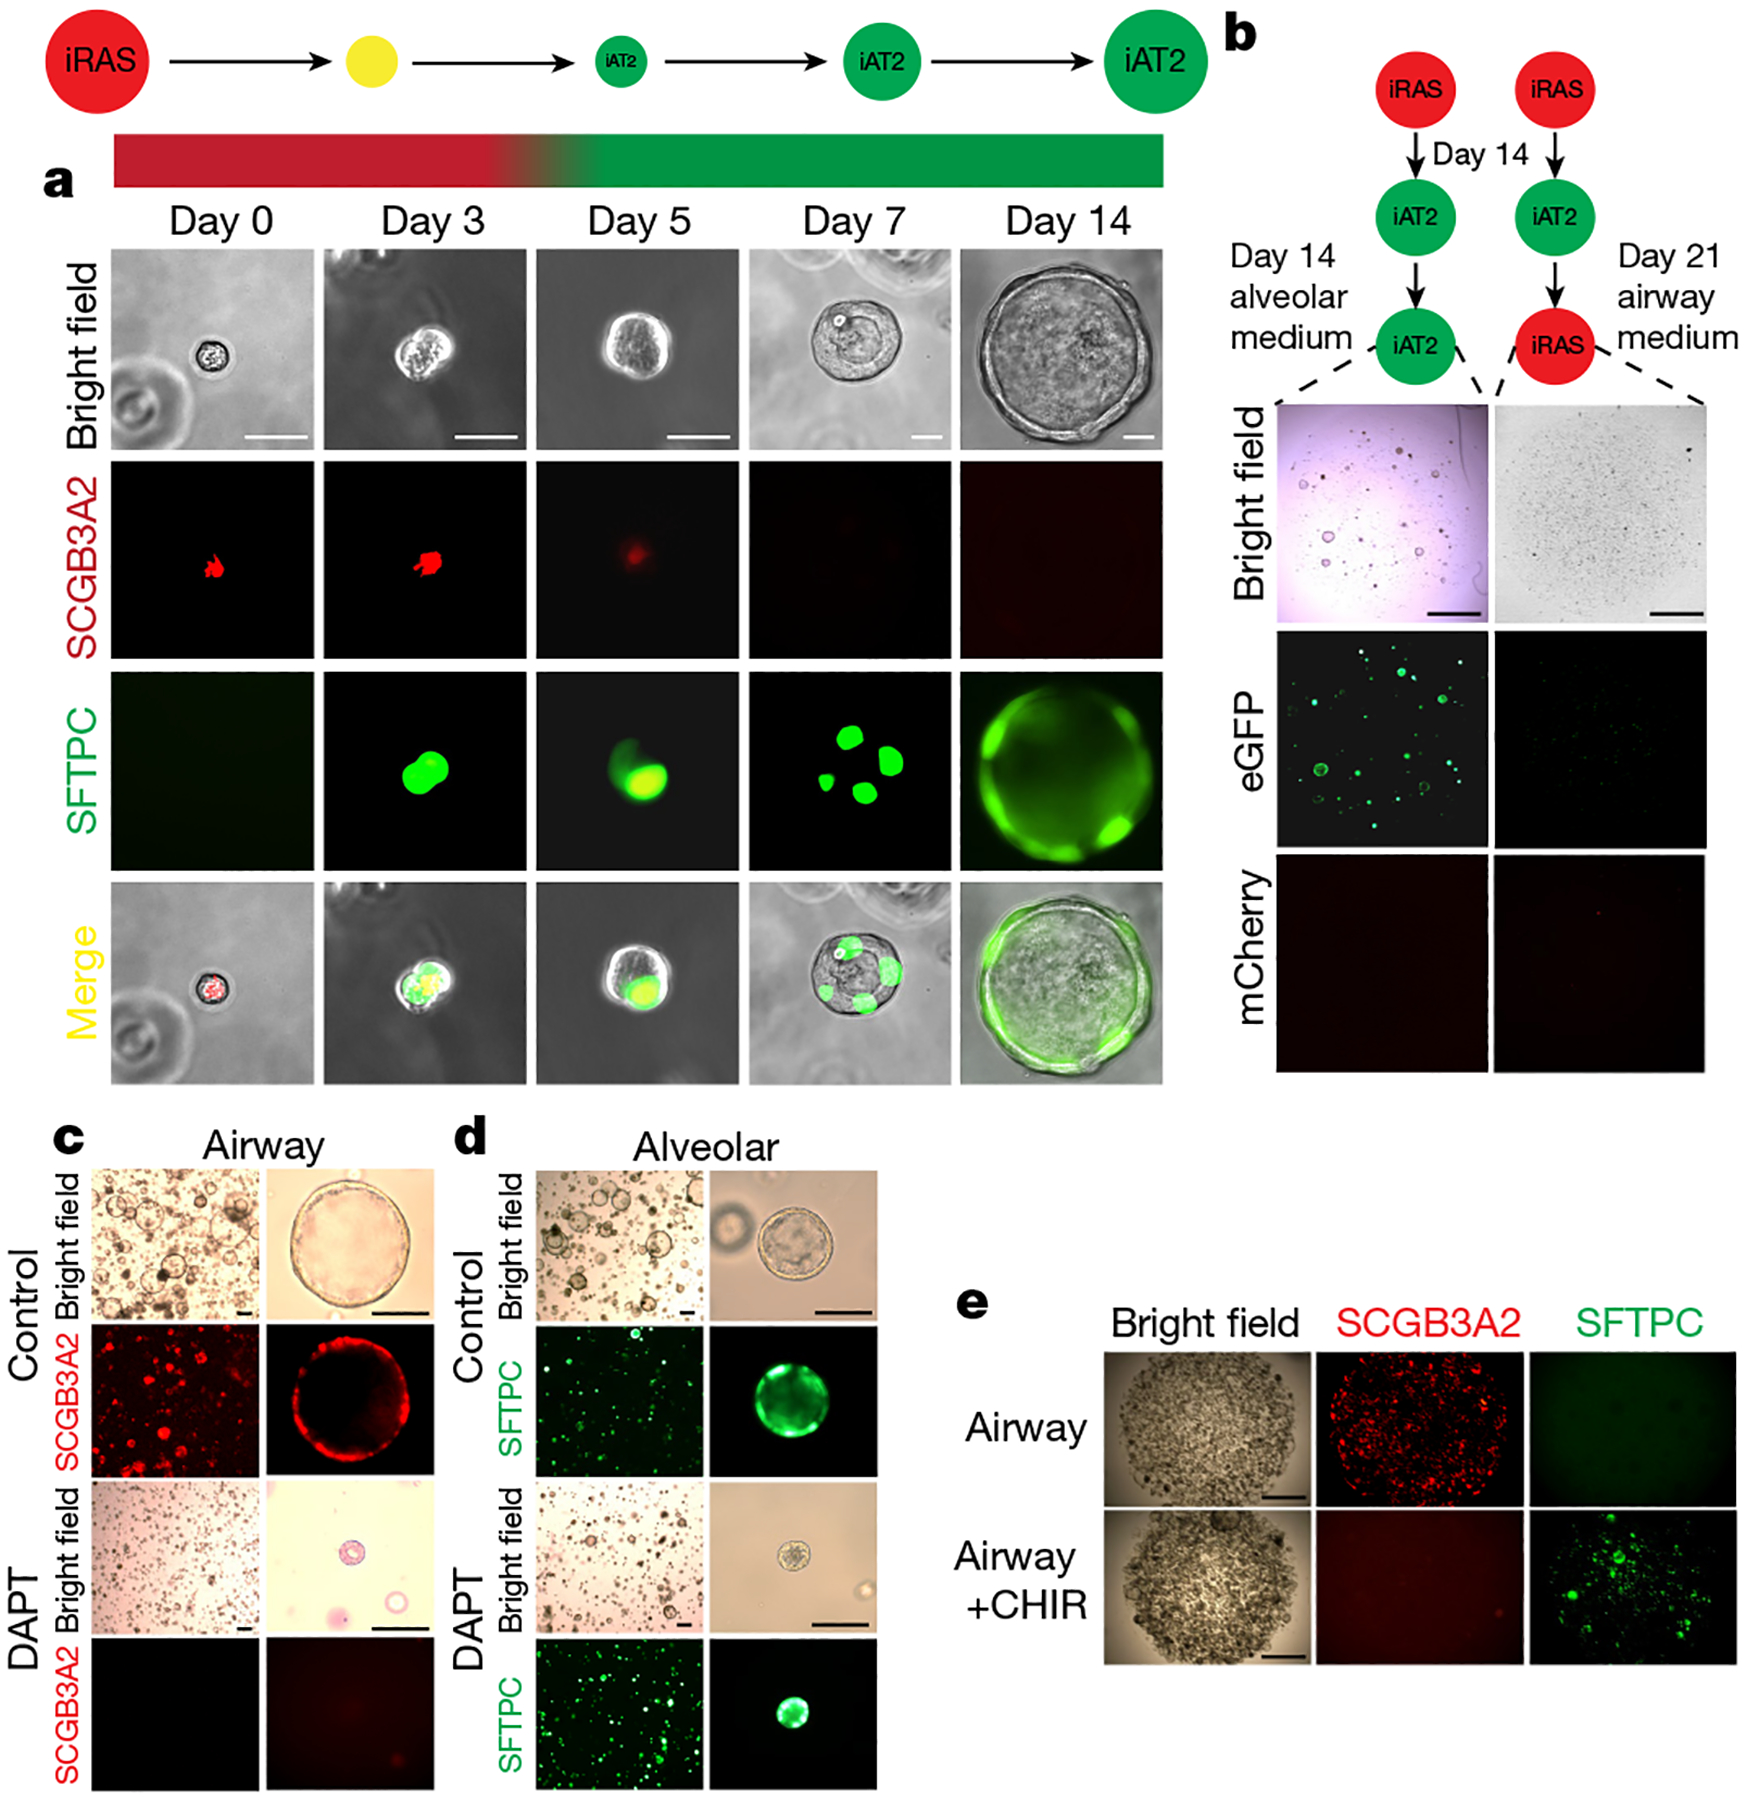
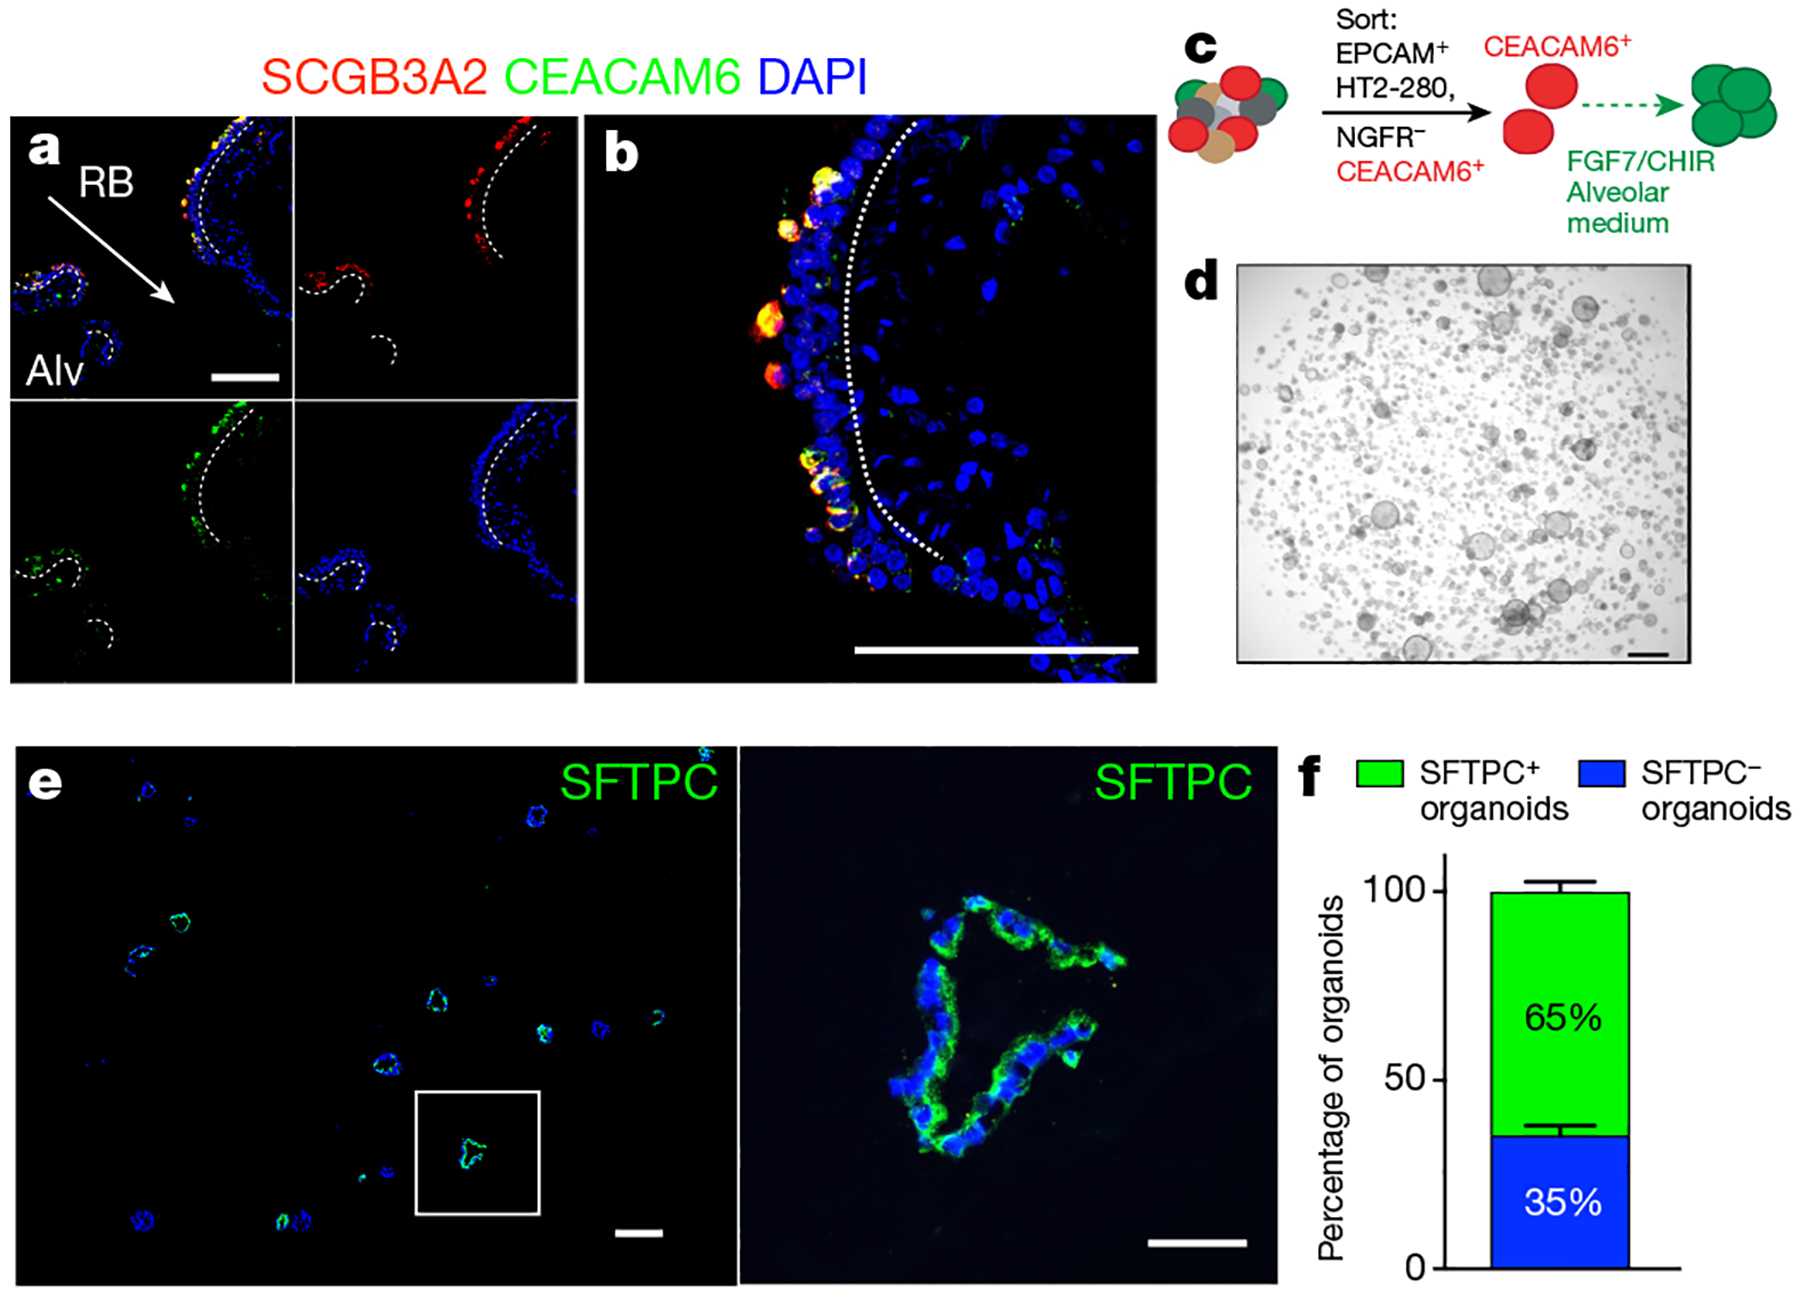
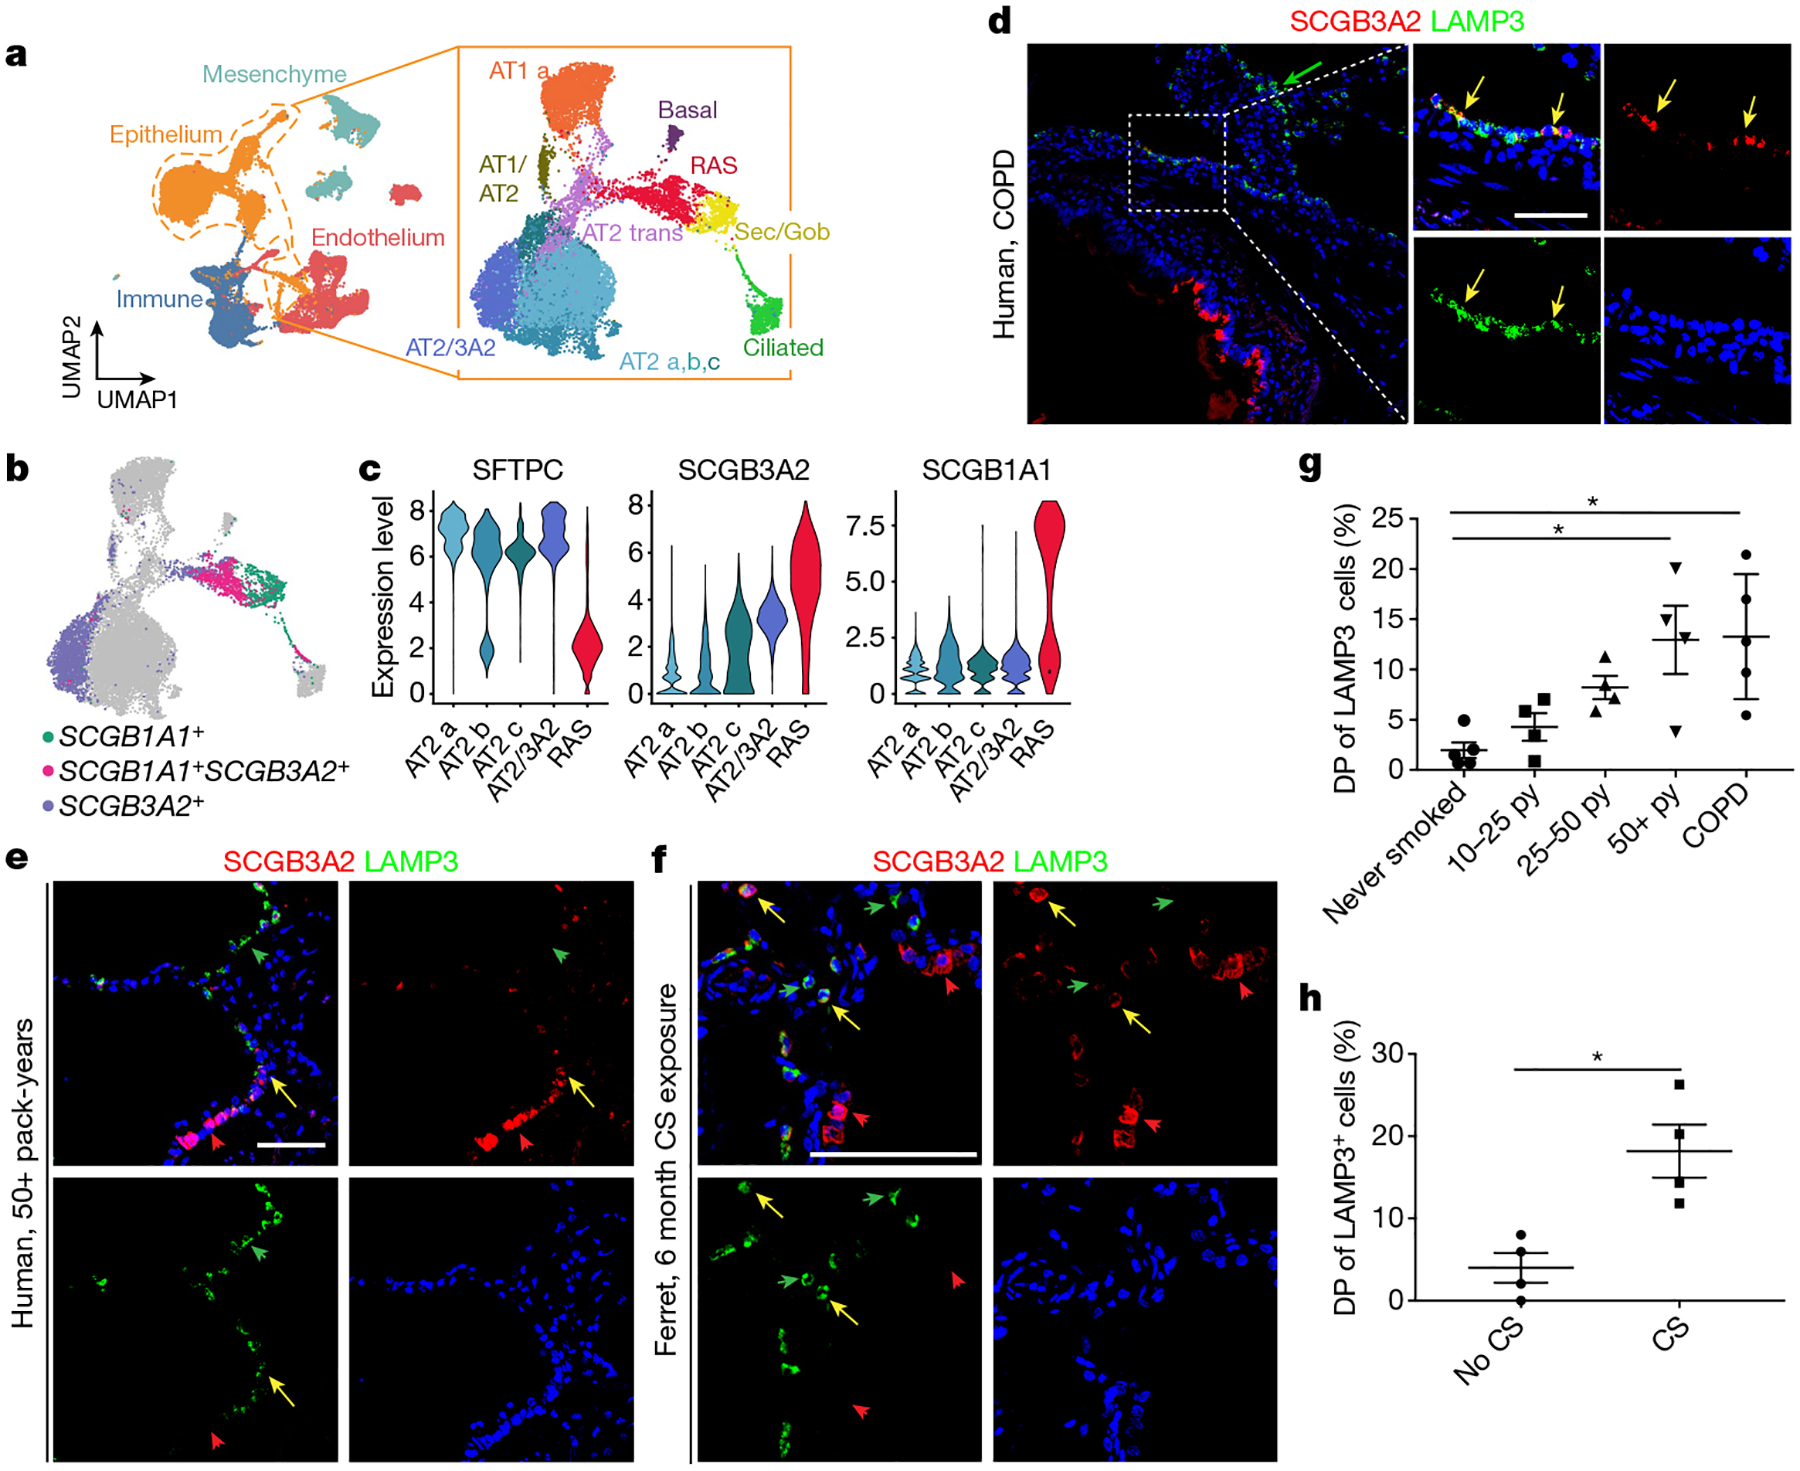
The human lung differs substantially from its mouse counterpart, resulting in a distinct distal airway architecture affected by disease pathology in chronic obstructive pulmonary disease. In humans, the distal branches of the airway interweave with the alveolar gas-exchange niche, forming an anatomical structure known as the respiratory bronchioles. Owing to the lack of a counterpart in mouse, the cellular and molecular mechanisms that govern respiratory bronchioles in the human lung remain uncharacterized. Here we show that human respiratory bronchioles contain a unique secretory cell population that is distinct from cells in larger proximal airways. Organoid modelling reveals that these respiratory airway secretory (RAS) cells act as unidirectional progenitors for alveolar type 2 cells, which are essential for maintaining and regenerating the alveolar niche. RAS cell lineage differentiation into alveolar type 2 cells is regulated by Notch and Wnt signalling. In chronic obstructive pulmonary disease, RAS cells are altered transcriptionally, corresponding to abnormal alveolar type 2 cell states, which are associated with smoking exposure in both humans and ferrets. These data identify a distinct progenitor in a region of the human lung that is not found in mouse that has a critical role in maintaining the gas-exchange compartment and is altered in chronic lung disease.


Conflict of interest statement

Competing interests The authors declare no competing interests.

Figures

Extended Data Fig. 1 |
Extended Data Fig. 1 |. All sequenced patients contributed to all observed clusters in normal human epithelium and clusters are identified based on expression of known markers.
A) Distribution of individual patient data is shown overlaying concatenated UMAP of the full distal data set (top row) and the subset of epithelium (bottom row). B) The patient contribution to each of the epithelial clusters is shown, demonstrating that each patient contributed to each epithelial population. RAS cell cluster marked with red asterisk. C) The UMAPs of each patient that contributed to the proximal data sets is shown for the full data set (top row) and the subset of epithelium (bottom row). D) The patient contribution to each epithelial cluster is shown in stacked bar graph. E) Output of clustree analysis as used to determine optimal cluster resolution. Green box denotes chosen resolution for epithelial analysis shown, red box denotes RAS cell cluster, yellow box denotes Secretory cell cluster. Gene expression between canonical Secretory cells and RAS cells were compared and F) GO analysis and G) WikiPathway analysis was performed on differentially expressed genes between RAS cells and Secretory cells. Shown are categories either up or down regulated in RAS cells as compared to Secretory cells. Previously identified cell lineage markers were examined to identify various cell types within the epithelium in distal (H, I) and proximal (J, K) epithelial subsets. H, J) Feature plots show graded gene expression and distribution in UMAP. I,K) Violin plots show selected gene expression per cluster.
Extended Data Fig. 2 |
Extended Data Fig. 2 |. Epithelial clusters within the normal distal human lung each harbor unique gene expression patterns.
A) Heatmap of top cluster defining genes within the distal human lung epithelium demonstrates that SCGB3A2+ RAS cells have a distinct transcriptional signature. Of note, AT2_c is a very small cluster with a small subset of cluster defining genes that are expressed at low levels and are not identified in most other cells. B) IHC of SCGB3A2, LAMP3, and RAGE on human lung distal parenchyma, demonstrating the interdigitation between respiratory bronchioles and alveolar units. N = 3. Scale bar = 100 μm. C) In contrast to the distal human lung in B, distal mouse lung shows the termination of the mouse terminal bronchiole directly into the alveolar space. N = 2. Scale bar = 50 μm. D) Separate channels from IHC presented in Fig. 1h are presented to allow for enhanced evaluation of each protein.
Extended Data Fig. 3 |
Extended Data Fig. 3 |. Epithelial clusters in the normal human lung proximal airways lack the distinct secretory subtypes found in distal ariways.
A) Heatmap of cluster defining genes within the proximal human epithelium. B) Selected gene expression compared across all proximal epithelial clusters shown as dot plot. C) RNAscope analysis for SCGB1A1 and SCGB3A2 transcripts reveals a similar distribution to protein expression in distal airways; A distal airway transitioning from terminal to respiratory bronchiole is shown, highlighting the preserved gradient of SCGB1A1 expressing cells in larger airways to SCGB3A2 expressing cells in more distal airways. Scale bar = 500 μm. N = 3. D, E) Additional airway structure showing intermixing of SCGB1A1 and SCGB3A2 positive populations. Yellow arrows point to double positive cells along gradient. While with the scRNA analysis there is SCGB1A1 expression in SCGB3A2 positive cells, double positive cells were rarely observed in RNAscope or protein IHC, likely due to a threshold of the technique. Yellow arrows indicate rare double positive cells in a distal human respiratory airway. Red arrows indicate SCGB3A2 single positive cells. Scale bars = 50 μm. N = 3. F, G) IHC of SCGB1A1 and SCGB3A2 expression in large and distal airways from representative individual patients (n = 6). Scale bar = 100 μm.
Extended Data Fig. 4 |
Extended Data Fig. 4 |. Integration of proximal and distal single cell transcriptomes defines the unique gene signature and location of human RASCs.
A) Distal and proximal scRNA-sequencing results from the same patient were concatenated, epithelium was isolated and re-clustered, and cell types were identified based on known markers. B) Distal and Proximal epithelium contribution to the resultant UMAP. C) Expression of SCGB1A1 and SCGB3A2. Secretory cell cluster outlined in yellow, RAS cell clustered outlined in Red. D) Violin plots showing expression of selected genes, highlighting unique genes for each cluster, and shared gene expression between secretory and RAS cell clusters (orange box) and RAS cell and AT2 cell clusters (green box). E) Feature plots of both the proximal and distal epithelium highlighting key gene expression patterns used to identify known cell subtypes. F) Contribution of proximal and distal samples to each cell type, demonstrating that some groups are unique to each region while some are shared. G) Heat map showing gene expression of Secretory, RAS cell, and AT2 cell gene signatures from proximal and distal concatenated data set. Of note, these pairwise comparisons were done between the displayed groups only, as such the resultant gene expression is distinct from the cluster-defining genes we observed in Extended Data Fig. 2a, where the comparisons were done between all epithelial populations. Origin of cells shown in blue (proximal) and orange (distal) bar across top of heat map.
Extended Data Fig. 5 |
Extended Data Fig. 5 |. Trajectory of primary human proximal and distal epithelium demonstrates both anticipated and novel epithelial progenitor relationships.
A) Proximal airways epithelium clustering and resultant cell populations shown for reference for following analysis. B) Trajectory analysis in the proximal human airways results in 3 putative lineage relationships. UMAP plots show trajectories, color represents cell localization along pseudotime. Heatmaps showing expression of trajectory defining genes across pseudotime. C) Trajectory analysis of scRNAseq gene expression across distal epithelial populations suggests several epithelial relationship, including D) a putative relationship between RAS cells and AT2 cells. E) Heatmap of defining gene expression changes along pseudotemporal ordering of cells from RAS cell-to-AT2 cell trajectory. Pseudotemporal ordering shown in bar above heatmap. F) Additional epithelial trajectories were identified by slingshot analysis within the distal epithelium. For the additional trajectories that are not a focus of this current study, the individual trajectory is shown along with the corresponding heatmap of trajectory defining genes. Top indicated position along trajectory as color coded by position of the cell along pseudotemporal ordering. G) Gene expression in UMI count of selected genes along pseudotemporal ordering of distal trajectory 1 (panel d, e) on the x-axis.
Extended Data Fig. 6 |
Extended Data Fig. 6 |. Human ES cell model of RAS cells demonstrates capacity to differentiate into AT2-like cells in vitro.
A) General experimental schematic of development of iRAS cells and propagation in airway or transition to alveolar media. B) Brightfield microscopy showing organoid formation and fluorescence after sorted iRAS cells were grown in airway (top) or alveolar (bottom) media. Scale bar = 100 μm. C) Corresponding flow cytometry analysis of endogenous mCherry reporter. D) Organoids from 3D culture with EPCAM or SCGB3A2 and SFTPC staining demonstrating SFTPC expression in alveolar organoids (bottom) and retention of SCGB3A2 expression in airways organoids (top). Scale bar = 100 μm, 20 μM for enlarged regions. N = 3 for panels BD. E) Schematic of SFTPC protein processing in AT2 cells and F) western blot of primary translation product and processing intermediates (top, bands 1 and 2) and mature S-PC protein (band 3) in NKX2.1 progenitors, iRAS cells propagated in airway media, iRAS cells grown in alveolar media, and primary human AT2 cells (HT2-280+ cells). Molecular weights indicated on left. N = 3. G) SFTPC staining in individual iAT2 cells (top) and primary human AT2 cells (bottom) showing punctate nature of SFTPC staining. Scale bar 10 μm. N = 4. H) q-RT-PCR from iRASC grown in airway (red) or alveolar (green) media demonstrates differential gene expression of known RAS cell and AT2 cell marker genes. Data presented as box with median (bar) and upper and lower quartiles (box bounds) and whiskers for min and max values (n = 5). Unpaired Student’s test performed *p < 0.05, **p < 0.01. I) Gene expression based on scRNA sequencing of iRAS cells, and iRAS cells after 14 days in alveolar media showing downregulation of primary RAS cell defining genes and upregulation of AT2 defining genes. All N refer to biological replicates.
Extended Data Fig. 7 |
Extended Data Fig. 7 |. Reference based integration of primary epithelium and hES cell derived epithelial populations.
A) UMAP analysis showing the distribution of primary human epithelial populations within the concatenated data set of primary human epithelium, iRAS cells, and iAT2 cells. Grey cells represent non-primary human cells (ES derived populations). Colors correspond to primary human cell populations as indicated. All primary epithelial populations are shown. B) UMAP showing distribution of the hES cell populations included in the concatenated data set. Colors correspond to hES cell populations based on gene expression of SCGB3A2 and SFTPC as indicated. C) Percentage of hES cells within primary cell defined clusters within concatenated data set. Clusters were identified based on localization of primary human epithelium. D) Venn diagram of Transcription factors identified as upregulated in primary RAS and iRAS cells compared to primary AT2 and iAT2 cells, respectively. E) Expression of Notch pathway genes HES1 and HES4 in primary RAS and iRAS cells compared to AT2 cell counterparts. F) Reference based integration of primary adult human epithelium, fetal human lung epithelial from day 11.5, 15, 18, and 21 (the days which included SCGB3A2+ secretory cell progenitor populations) from published fetal lung data set, and iRAS cells. All three SCGB3A2+ populations clustered together, and SCGB3A2+ cells are shown in red. G) SCGB3A2+ cells were selected and re-clustered. H) A stacked bar graph of the contribution of each population to each resultant cluster.
Extended Data Fig. 8 |
Extended Data Fig. 8 |. Dual reporter system demonstrates SFTPC expression in iAT2 cells and highlights dynamics of cell transitions in vitro.
A) Schematic of vectors for SFTPC-eGFP targeting in the dual reporter hES cell line. B) Brightfield microscopy showing mCherry and eGFP expression in 3D cultures of sorted iRAS cells grown in either airway (top) or alveolar (bottom) media for 14 days. Scale bar = 100 μm. N = 3. C) Flow cytometry showing endogenous SCGB3A2-mCherry and SFTPC-eGFP expression in iRAS cells grown in airway (top) or alveolar (bottom) media compared to NKX2.1 progenitor controls. D) Gating strategy for all hES cell flow cytometry and FACS experiments shown in Extended Data Figs. 6c, 8b, and 9h, i and n. E) Flow cytometry corresponding to experiment in Fig. 2a, of SCGB3A2-mCherry and SFTPC-eGFP expression over time as iRASC were propagated in Alveolar media. N = 3. F) UMAP of scRNA-seq analysis of all populations derived from iRAS cells at day 14 of differentiation in alveolar media reveals several clusters. G) The resulting culture was heterogenous and included both iAT2 lung endoderm progenitors as well as a small number of other foregut endoderm cell types. Feature plots showing expression of canonical AT1 and AT2 cell alveolar epithelial markers, Airway cell markers, Lung endoderm progenitor markers, neuroendocrine and tuft cell markers, and gastric fate markers, allowing putative identification of all observed clusters.
Extended Data Fig. 9 |
Extended Data Fig. 9 |. Transition of iRAS cells to iAT2 cells is similar to the primary RAS cell-AT2 transition and is partially regulated by Notch and Wnt.
A) Schematic of time-course of scRNA-seq experiment. B) Integration of entire time course showing cell origin, cell-cycle phase, and gene expression of SCGB3A2 and SFTPC. C) Clustering of complete time course from iRAS to iAT2 cells development shows multiple clusters within the various time points. D) Trajectory analysis showed multiple putative pseudotemporal orderings (top), and selected curve for further analysis based on termination in day 14 non-mitotic iAT2 cells (bottom). E) Heatmap of iRAS cell to iAT2 cell trajectory displaying genes defining the primary RAS to AT2 cell transition from Extended Data Fig. 5e. F) Expression of a subset of genes identified in primary RAS to AT2 cell transition shown over pseudotime in iRAS to iAT2 cell transition. G) Canonical airway and alveolar epithelial marker genes expression within the resultant UMAP. H) Flow cytometry of mCherry and eGFP expression in iRAS cells grown in Airway media in the presence or absence of DAPT, and corresponding percent fold change in mCherry expression and MFI. N = 4. I) Flow cytometry of mCherry and eGFP expression of iRAS cells grown in Alveolar media in the presence or absence of DAPT showing percent change in eGFP expression and MFI. J) q-RT-PCR of bulk populations from iRAS cells grown in airway media with or without DAPT. N = 3. K) q-RT-PCR from iRAS cells gown in alveolar media with or without DAPT. N = 3. Quantification of flow cytometry analysis of L) mCherry and M) eGFP positive single cells in culture after iRAS cells were grown in either Airway media or Airway media supplemented with CHIR99021. Data are represented as mean +/−SD and unpaired two-tailed t-tests perfomed. *p < 0.05, **p < 0.01. N) Representative flow cytometry plots (representative of n = 4). O) The heat map of each observed trajectory in panel d is presented with the top trajectory defining genes identified, and cell are ordered by pseudotemporal order on x-axis. All N represent biological replicates.
Extended Data Fig. 10 |
Extended Data Fig. 10 |. Identification and isolation of CEACAM6+ distal lung epithelial cells and demonstration that SCGB3A2+ cells can be identified by CEACAM6 and isolated from distal lung parenchyma.
A) scRNA sequencing was performed on flow sorted Epcam+ HT2-280neg cells in order to enrich for epithelial cells of the human distal airways. B) UMAP of re-clustering of selected secretory airway cell populations demonstrate refined heterogeneity in SCGB3A2 expressing cells. C) View of distal airway showing distribution of SCGB3A2, CEACAM6, and SFTPC expression and D) Zoom in of region highlighting SCGB3A2 and CEACAM6 staining. White arrows indicate double positive cells. Of note, there are a small minority of CEACAM+/SCGB3A2low cells present in some sections. Scale bars = 100 μm, 50 μm for enlarged regions. N = 5. E) Representative cytospins and associated F) quantification of CEACAM6+ population for pro-SFTPC reveals that <5% of cells are positive for this canonical AT2 cell marker (n = 3), compared to HT2-280+ cells where over 90% of cells are positive for Pro-SFTPC (n = 2). Data presented as mean +/−SD. White arrow indicates rare SFTPC+ cell in CEACAM+ population. Scale bar = 50 μm. G) Feature plots demonstrates that surface marker CEACAM6 expression overlaps SCGB3A2 expression. H) FACS approach to isolate CEACAM6+/HT2-280−/NGFR-airway cells. HT2-280 neg population was sorted for a CEACAM6+ and NGFR- population. I) Gating strategy for obtaining populations in panel H. After gating on single cells, immune cells, endothelial cells and dead cells were excluded prior to selecting EPCAM+ cells for further subsetting as shown in H.
Extended Data Fig. 11 |
Extended Data Fig. 11 |. All COPD patients contributed to all resultant clusters and gene expression within the COPD epithelium highlights the various epithelial cell clusters.
Each patient contribution is shown overlying the entire concatenated UMAP for A) the entire data set (top row), and the subset of epithelial cells (bottom row). B) Stacked bar graph showing the patient contribution to each epithelial cell cluster, demonstrating that all patients contributed to all resultant clusters. RAS cell cluster marked with red asterisk. C) Canonical marker genes used to identify epithelial clusters are shown. D) Violin plots demonstrate distribution of known canonical marker genes across the various epithelial populations. E) Cluster defining genes within the COPD epithelium are shown in dot plot format. There are distinct changes in the transcriptome of non-epithelial populations in COPD. GO analysis of inter-cluster gene expression comparing select endothelial (F) and mesenchymal (G) populations suggests that the differential gene expression seen in the epithelium is distinct to that population.
Extended Data Fig. 12 |
Extended Data Fig. 12 |. Epithelial cell gene expression differences in disease and the RAS cell to AT2 cell transition is altered in COPD.
A) Concatenation of normal and COPD peripheral samples and subset of epithelium showing expected epithelial populations. B) Identification of RAS cell and SCGB3A2+ AT2 populations based on expression of markers indicated. C) GO analysis of intra-cluster gene expression of RAS cells comparing COPD and healthy patient derived cells. D) Violin plots of selected genes contributing to GO processes in (C). E) GO analysis of inter-cluster gene expression comparing SCGB3A2+ AT2 cells from COPD donors and AT2 cells from healthy donors and F) corresponding selected gene expression. G) GO analysis of intra-cluster gene expression of AT2 cells from COPD and healthy controls. H) Violin plots of selected genes from GO processes in (G). For all, up regulated is COPD compared to healthy controls. I)Transcriptional inference analysis of the concatenated data set revealing multiple trajectories initiating at RAS cells. J, K) Comparison of gene expression along trajectory 1 (T1) versus trajectory 2 (T2) demonstrating differential gene expression changes along pseudotemporal ordering between the RAS to AT2 cell trajectory and the RAS to SCGB3A2+ AT2 cell trajectory. L) Distribution of individual patient data is shown overlaying concatenated UMAP of the COPD and healthy peripheral data sets. All cells are shown in top two rows, and epithelial subsets in bottom rows. M) Stacked bar graphs highlight patient level contribution to each cluster. RAS cells are indicated in red asterisk.
Fig. 1 |
Fig. 1 |. Identification of secretory cell heterogeneity in the distal human lungs.
a, Schematic of the differences between the mouse and human distal airways including respiratory bronchioles (RBs). b, Haematoxylin-and-eosin-stained tissue showing the blunt ending of the mouse airways into the alveolar compartment, whereas the transition through the respiratory bronchioles in the human lung is more gradual. AD, alveolar duct; BADJ, bronchioalveolar duct junction; CA, conducting airway; TB, terminal bronchiole. Representative of n = 10. Scale bar, 100 μm. c, UMAP representation of the scRNA-seq data of the human distal lung with epithelial subset analysis labelled according to the corresponding cell type. NEC, neuroendocrine cell; Sec, secretory. d, Bi-gene plots showing expression of SCGB1A1, SCGB3A2 or cells expressing both of these genes, which identifies RAS cells. e, Gene expression dot plot highlighting the unique expression pattern found in RAS cells. f, UMAP analysis of scRNA-seq data from proximal human airways with epithelial subset analysis labelled according to the corresponding cell type. Basal/Sec, basal and secretory; Cil/Sec, ciliated and secretory; Sec/Gob, secretory and goblet. g, Bi-gene plot showing the expression of SCGB1A1 and SCGB3A2 in the proximal epithelium. h, SCGB1A1 and SCGB3A2 expression in a distal human airway, showing the progression of SCGB1A1+ and SCGB3A2+ cells along the distal airway axis, interweaving with alveolar tissue. Scale bar, 100 μm. i, SCGB3A2 expression in human lungs in the respiratory bronchiole region. j, k, Co-staining of SCGB3A2 with either SFTPC (j) or LAMP3 (k) in the distal human lungs. Respiratory bronchioles are interspersed, and areas of alveolar parenchyma were identified by the presence of SFTPC+ or LAMP3+ AT2 cells. The images on the right are magnifications of the regions indicated by the dashed white boxes. The yellow arrows highlight rare double-positive cells, and the green arrows highlight single-positive cells. Scale bars, 100 μm and 50 μm (magnified images). For hk, n = 8 for each. l, m, SCGB3A2 staining in the distal parenchyma of adult ferret lungs (l), and SCGB3A2 and SFTPC staining in the distal ferret lung in regions of respiratory bronchioles (m). n = 4. The images on the right are magnifications of the regions indicated by the dashed white boxes. Scale bars, 100 μm and 50 μm (magnified images). Alv, alveolus.
Fig. 2 |
Fig. 2 |. The iRAS cell transition to iAT2 cells is rapid, unidirectional, and regulated in part by Notch and Wnt signalling.
a, Bright-field and fluorescence microscopy analysis of mCherry and eGFP expression over time in iRAS cells grown in alveolar medium. Scale bars, 20 μm. b, Bright-field and fluorescence microscopy analysis of mCherry and eGFP expression in iAT2 cells grown in continued alveolar medium (left) or returned to airway medium (right). Scale bars, 200 μm. c, d, Bright-field and fluorescence microscopy analysis of iRAS cells grown in airway medium (c) or alveolar medium (d) with vehicle (top) or the γ-secretase inhibitor DAPT (bottom). For c and d, scale bars, 100 μm. e, Bright-field and fluorescence microscopy analysis of iRAS cells grown in airway medium with or without CHIR99021 supplementation. Scale bars, 200 μm. All experiments represent n = 4 biological replicates.
Fig. 3 |
Fig. 3 |. SCGB3A2+ cells, identified by CEACAM6, can be isolated from distal lung parenchyma and give rise to SFTPC+ organoids ex vivo.
a, Immunofluorescence staining of CEACAM6 and SCGB3A2 reveals co-staining within the distal respiratory bronchioles. b, Enlarged image of a respiratory bronchiole from a. n = 5. For a and b, scale bars, 100 μm. c, Schematic of the CEACAM6+HT2-280NGFR organoid assay. d, Bright-field image of CEACAM6+ cells grown in Matrigel in alveolar medium with FGF7 and CHIR99021. Scale bar, 1,000 μm. e, Whole-mount antibody staining for SFTPC expression in the resulting organoids. Scale bars, 200 μm (wide-field images), 50 μm (individual organoids). n = 3. f, Approximately 60% of the organoids contain SFTPC+ cells. Data are mean ± s.d. n = 3.
Fig. 4 |
Fig. 4 |. COPD and exposure to cigarette smoke is associated with alternative AT2 cellular states.
a, A scRNA-seq analysis of distal parenchyma from patients with COPD shows all of the expected lineages, and epithelium reclustering shows all of the expected epithelial populations. b, RAS cells are identified by the co-expression of SCGB1A1 and SCGB3A2; an AT2 population that expresses higher levels of SCGB3A2 is noted. c, Key gene expression within the AT2 populations, including the SCGB3A2+ AT2 cell population (AT2_3A2) and RAS cells. d, e, LAMP3 and SCGB3A2 expression in the peripheral parenchyma from patients with COPD (n = 5) (d) and in patients with >50 pack-year exposure to cigarette smoke (CS) but no reported history of respiratory disease (n = 4) (e). f, LAMP3 and SCGB3A2 expression in ferrets exposed to 6 months of cigarette smoke compared with control animals exposed to healthy air. Scale bar, 100 μm. The yellow arrows denote SCGB3A2+LAMP3+ cells; the green and red arrows denote single-positive cells. g, Quantification of LAMP3+SCGB3A2+ double-positive (DP) cells as a percentage of LAMP3+ cells stratified by cigarette smoke pack-year (py), and patients with COPD. n = 4 patients per group in cohorts exposed to cigarette smoke, and n = 5 patients per group for non-smoking individuals and individuals with end-stage COPD. Data are mean ± s.d. Statistical analysis was performed using ordinary one-way analysis of variance (ANOVA) with correction for multiple comparisons; *P = 0.0132, **P = 0.0066. h, Quantification of LAMP3+SCGB3A2+ DP cells as a percentage of LAMP3+ cells in ferrets exposed to 6 months of cigarette smoke daily or unexposed controls. n = 4 animals per group. Data are as mean ± s.e.m. Statistical analysis was performed using an unpaired two-tailed t-test; *P = 0.0087. Scale bars, 100 μm.

Comment in

Similar articles

Cited by

References

    1. Burney PG, Patel J, Newson R, Minelli C & Naghavi M Global and regional trends in COPD mortality, 1990–2010. Eur. Respir. J 45, 1239–1247 (2015). - PMC - PubMed
    1. Basil MC et al. The cellular and physiological basis for lung repair and regeneration: past, present, and future. Cell Stem Cell 26, 482–502 (2020). - PMC - PubMed
    1. Zepp JA & Morrisey EE Cellular crosstalk in the development and regeneration of the respiratory system. Nat. Rev. Mol. Cell Biol 20, 551–566 (2019). - PMC - PubMed
    1. Hogan BL et al. Repair and regeneration of the respiratory system: complexity, plasticity, and mechanisms of lung stem cell function. Cell Stem Cell 15, 123–138 (2014). - PMC - PubMed
    1. Weibel ER, Sapoval B & Filoche M Design of peripheral airways for efficient gas exchange. Respir. Physiol. Neurobiol 148, 3–21 (2005). - PubMed