. 2022 Apr;604(7905):354-361.
doi: 10.1038/s41586-022-04584-6. Epub 2022 Mar 30.

Anatomic position determines oncogenic specificity in melanoma

Affiliations

Anatomic position determines oncogenic specificity in melanoma

Joshua M Weiss et al. Nature. 2022 Apr.

Abstract

Oncogenic alterations to DNA are not transforming in all cellular contexts1,2. This may be due to pre-existing transcriptional programmes in the cell of origin. Here we define anatomic position as a major determinant of why cells respond to specific oncogenes. Cutaneous melanoma arises throughout the body, whereas the acral subtype arises on the palms of the hands, soles of the feet or under the nails3. We sequenced the DNA of cutaneous and acral melanomas from a large cohort of human patients and found a specific enrichment for BRAF mutations in cutaneous melanoma and enrichment for CRKL amplifications in acral melanoma. We modelled these changes in transgenic zebrafish models and found that CRKL-driven tumours formed predominantly in the fins of the fish. The fins are the evolutionary precursors to tetrapod limbs, indicating that melanocytes in these acral locations may be uniquely susceptible to CRKL. RNA profiling of these fin and limb melanocytes, when compared with body melanocytes, revealed a positional identity gene programme typified by posterior HOX13 genes. This positional gene programme synergized with CRKL to amplify insulin-like growth factor (IGF) signalling and drive tumours at acral sites. Abrogation of this CRKL-driven programme eliminated the anatomic specificity of acral melanoma. These data suggest that the anatomic position of the cell of origin endows it with a unique transcriptional state that makes it susceptible to only certain oncogenic insults.


Figures

Extended Data Fig. 1 :
Extended Data Fig. 1 :. Identification of acral versus cutaneous melanoma genes.
Related to Fig. 1. (a– b) MSK-IMPACT of biologically independent samples from n = 100 acral and n = 839 cutaneous melanoma patients. Two-sided Fisher’s exact test was used to compare the frequency of the most recurrently mutated and deleted genes by melanoma subtype. Both coding and promoter mutations were counted for TERT. (c) RNA-seq of biologically independent samples from n = 61 acral and n = 53 cutaneous melanoma patient. Boxplots compare indicated genes by subtype. Box minima = 25th percentile, centre = 50th percentile, maxima = 75th percentile. Whiskers extends from the box maxima/minima to the largest/smallest value no further than 1.5 * IQR (interquartile range) from the box maxima/minima. Data beyond the end of the whiskers are plotted individually as outliers. FDR = 0.05 and adjusted p-values were calculated using a two-sided Wald test with DESeq2. (d) Schematic detailing predicted synergistic interaction between putative driver genes in acral melanoma. (e) TCGA pan-cancer analysis shows significant co-occurrence of CRKL, GAB2, NF1, and TERT alterations. Data analyzed with one-sided Fisher’s exact test and p-values adjusted for FDR = 0.05. (f) Clinical course of an acral melanoma patient. (g) WGS copy number profile showing copy number changes in GAB2, CRKL, and NF1. (h) Putative drivers of patient’s acral melanoma. * p-value < 0.05, ** p-value < 0.01, *** p-value < 0.001, **** p-value < 0.0001.
Extended Data Fig. 2 :
Extended Data Fig. 2 :. A transgenic zebrafish model of acral melanoma.
Related to Fig. 1. (a) Plasmids used to create the WT melanocyte model, acral melanoma model, and cutaneous melanoma models. (b) Genotyping PCR to confirm integration of plasmids into zebrafish genome. Representative images of n = 3 independent replicates. For gel source data, see Supplementary Fig. 3. (c) qPCR to validate RNA expression of transgenes. N = 3 biological independent replicates. Error bars = SEM. (d) Western blot was performed on WT and acral melanoma fish for human CRKL and GAB2 to validate transgene expression. N = 3 biological replicates are shown. For western blot source data, see Supplementary Fig. 4. (e) RNA-seq on embryos at 5 days post-fertilization FACS sorted for GFP+ melanocytes. Log normalized expression of melanocyte markers and acral transgenes are indicated. N = 4 biologically independent replicates. P-values calculated using a two-sided Wald test with DESeq2. Error bars = SEM. (f) CRISPR-seq was performed on the predicted sgRNA cut locus of zebrafish nf1a and nf1b to sensitively detect Cas9-mediated editing. Reference genome as well as the two most commonly altered reads are shown. The right panel is a heatmap with the frequency of reference and edited sequences in WT melanocyte and acral melanoma models. Variants displayed for both nf1a and nf1b are frameshift mutations in exon 1 leading to a predicted loss of function. (g) Immunofluorescence on transverse sections of WT melanocyte model, tumor-bearing acral melanoma model, and tumor-bearing cutaneous melanoma model for GFP and SOX10. GFP labels all tumor cells and SOX10 is used as a melanocyte lineage marker. Asterisks indicate blood vessels with autofluorescence. Representative of n = 3 biological replicates. (h) Histogram representation of the ternary plot portrayed in Fig. 1e showing the percentage of tumors forming in the head, body, or fins of acral fish and cutaneous fish melanoma models. Data represents n = 3 biological replicates, which range from n = 43 to n = 141 fish per replicate. See Supplementary Table 3 showing the exact number of fish and corresponding percentages for each replicate. To compare overall anatomic distribution between the two genotypes, a chi-squared test was performed. To compare the frequency of tumors at each anatomic location, a student’s two-sided t-test was performed. Error bars = SEM. Ternary plot represents the same data presented in the histogram. (i) WT melanocyte vs acral melanoma model compared for melanocyte area in tailfin at 3-days post-fertilization. Data represents n = 29 WT fish and n = 41 acral fish pooled from n = 4 biological replicates. Each point represents the tailfin melanocyte area of a different animal. P-values generated by a two-sided student’s t-test. Error bars = SEM. * p-value < 0.05, ** p-value < 0.01, *** p-value < 0.001, **** p-value < 0.0001.
Extended Data Fig. 3 :
Extended Data Fig. 3 :. Histological profiling of a zebrafish model of acral melanoma.
Related to Fig. 1. n = 3 WT, acral, and cutaneous melanoma transgenic fish were used for histological profiling. Images of the fish used for histology are shown on top with a red line indicating anatomic region used for sectioning and profiling. For WT fish, head, body, and fin regions were used as a negative control. For acral fish, profiled tumors were located on the fins. For cutaneous fish, profiled tumors were located on the body and head. The markers used include H&E, GFP (marking melanocytes in all 3 models), CRKL (expressed only in the acral model), pIGF1R, pERK, and pS6. See methods for details regarding antibody, concentration, and staining procedure.
Extended Data Fig. 4 :
Extended Data Fig. 4 :. Stable (germline) transgenic acral lines show enhanced anatomic specificity.
Related to Fig. 1. (a) F0 transgenic fish shown in Fig. 1d and Fig. 2b were outcrossed to generate stable germline transgenics. Representative images of each transgenic line are shown with arrows to indicate the location of tumors. (b) Tumor frequency of each stable line at 1 year post fertilization. (c) Ternary plot showing the anatomic distribution of tumors for each stable transgenic line. P-values generated by chi-squared test. See Supplementary Table 3 for a full list of fish and tumor numbers across all replicates and experimental conditions. (d) Adult WT melanocyte and acral melanoma models were dissected to isolate body skin and fins and then analyzed via flow cytometry. The images show representative differences in pigment patterning between the two models. The histogram shows the percentage of total cells that were GFP+ grouped by anatomic location and genotype. Data represents n = 3 biological replicates. Each replicate represents the pooling of n = 2 male and n = 2 female fish. P-values generated by student’s two-sided t-test. Error bars = SEM. (e) The ratio of fin melanocytes to body melanocytes was compared between the two models using the data from (d). Data represents n = 3 biological replicates. P-values generated by student’s two-sided t-test. Error bars = SEM. (f) Gating strategy of the flow cytometry data. (g) Representative contour plots of melanocyte frequency by genotype and location. * p-value < 0.05, ** p-value < 0.01, *** p-value < 0.001, **** p-value < 0.0001.
Extended Data Fig. 5 :
Extended Data Fig. 5 :. Fin melanocytes have a limb positional identity.
Related to Fig. 3. (a–c) Validation of successful isolation of melanocytes for RNA-seq. (a) Volcano plots comparing melanocytes (GFP+ sample) to their microenvironment (GFP− sample) across locations and transgenic models. Melanocyte markers are labeled. Genes with FDR-adjusted p-value < 0.05 indicated in blue. P-values calculated using DESeq2. (b) GSEA showing the list of the top pathways enriched in melanocytes (GFP+ sample) compared to their microenvironment (GFP− sample). Colors indicate p-value adjusted for FDR = 0.05. (c) Log normalized counts for the expression of transgenes across all samples. EGFP and mitfa expression are high in all melanocyte samples and CRKL, GAB2, TERT, and Cas9-mCherry expression is high only in acral melanoma model melanocytes. N = 3 biologically independent replicates. Box minima = 25th percentile, centre = 50th percentile, maxima = 75th percentile. Whiskers extends to the largest/smallest value no further than 1.5 * IQR (interquartile range) from the box maxima/minima. Data beyond the end of the whiskers are plotted individually as outliers. (d) Principal component analysis (PCA) for all samples showing principal components 1 (PC1) and 2 (PC2). The percent of transcriptional variation captured by each principal component is indicated. (e) GSEA pathway analysis comparing fin vs body melanocytes from the WT melanocyte model listing the top enriched pathways in fin melanocytes. Limb development and positional identity-related pathways are highlighted. See Supplementary Table 4 for a full list of pathways. (f) GSEA barcode plot showing enrichment of genes in the GO: Appendage Development pathway, generated with weighted kolmogorov smirnov (WKS) testing. NES and FDR = 0.05 adjusted p-values are indicated. (g− h) Volcano plots comparing fin melanocytes vs body melanocytes from the (g) WT melanocyte model and (h) acral melanoma model. Genes with FDR-adjusted p-value < 0.05 indicated in blue. P-values calculated using DESeq2.
Extended Data Fig. 6 :
Extended Data Fig. 6 :. Zebrafish fin melanocytes express higher levels of HOX13 genes.
Related to Fig. 3. (a) Schematic illustrating the fin versus body scRNA-sequencing experiment. Similar to the bulk RNA-seq experiment in Fig. 3a, body skin and fins were isolated from acral melanoma fish by dissection and then FACS sorted for GFP+ melanocytes and GFP− microenvironmental cells. This generated n = 4 samples (body melanocytes, body TME, fin melanocytes, fin TME) that each underwent scRNA-seq. (b) UMAP pooled for all 4 samples highlighting the various cell types captured by scRNA-seq. (c) Violin plot comparing hoxc13b expression in body and fin melanocytes. Data represents log normalized counts and was compared by two-sided Wilcoxon rank sum test. (d) Violin plot comparing total expression of all HOX13 genes (hoxa13a, hoxa13b, hoxb13a, hoxc13a, hoxc13b, hoxd13a). To avoid single-cell drop out of more lowly expressed HOX13 genes, log normalized counts were summed together to calculate total expression per cell. Data was analyzed by two-sided Wilcoxon rank sum test. (e) Violin plot comparing the total expression of all HOX13 genes across all fin and body cell types. Data was analyzed by two-sided Wilcoxon rank sum test. (f) Zebrafish hox genes detected by bulk RNA-seq were used to perform unsupervised clustering and visualized with a heatmap. Samples clustered by anatomic location, then lineage, and then genotype in that order, indicating the hox genes predominantly associate with anatomic position. Particular hox genes that are differentially expressed across all body and fin samples are indicated with a black box. * p-value < 0.05, ** p-value < 0.01, *** p-value < 0.001, **** p-value < 0.0001.
Extended Data Fig. 7 :
Extended Data Fig. 7 :. Human melanoma has a positional identity defined by HOX genes.
Related to Fig. 4. (a) GSEA pathway analysis for top enriched pathways in human acral melanoma and is controlled for disease stage. Limb development pathways and positional identity-related pathways are highlighted. See Supplementary Table 5 for a full list of pathways. (b) GSEA barcode plot showing enrichment for the GO: Appendage Development pathway in acral melanoma, generated with WKS testing. NES and FDR = 0.05 adjusted p-values are indicated. (c) PCA of all samples based on the expression of just HOX genes. Color indicates the combination of melanoma subtype and disease stage. (d) N = 3 acral melanoma tissue microarrays of n = 32 samples total from Sloan Kettering was used for staining for H&E, CRKL, HOXB13, and pIGF1R. (e) Extent and intensity of each sample was independently scored by a Sloan Kettering dermatopathologist and is represented in a pie chart. 2 samples were removed from the analysis due to heavy pigmentation, resulting in n = 30 samples total used for IHC quantification analysis. Extent scores range 0− 4 and intensity scores range 0–3. (f) N = 3 cutaneous melanoma tissue microarrays of n = 14 total samples from Sloan Kettering was used for staining for H&E, CRKL, HOXB13, and pIGF1R. (g) Extent and intensity of each sample was independently scored by a Sloan Kettering dermatopathologist and is represented in a pie chart. Extent scores range 0–4 and intensity scores range 0–3. (h) CRKL, HOXB13, and pIGF1R antibodies were optimized on human tissues chosen for their expression characterized by the Human Protein Atlas. CRKL is a ubiquitously expressed protein with relatively high expression in the colonic epithelia and lower expression in liver. HOXB13 is expressed in prostate epithelia with low expression in liver and skin (anatomic source unknown). pIGF1R demonstrates higher levels in prostate epithelia, colon epithelia, tonsil, and lower levels in skin. See methods for details regarding antibody, concentration, and staining procedure.
Extended Data Fig. 8 :
Extended Data Fig. 8 :. HOX13 regulates insulin/IGF signaling.
Related to Fig. 5. (a– e) Analysis of HOXA13, HOXD13, H3K27ac ChIP-seq data analyzed from Sheth et al., 201631 performed on developing limb buds from E11.5 mouse embryos. (a) Waterfall plot representation of 5594 top enriched GSEA pathways regulated by HOXA13, highlighting limb and insulin/IGF-related pathways. Limb development pathways were identified using the search terms “limb” or “appendage.” Insulin/IGF signaling pathways were identified using the search terms “insulin” or “IGF”. Only pathways with FDR < 0.05 are highlighted. (b– c) Histogram showing the significantly enriched insulin/IGF pathways regulated by HOXA13 and HOXD13. NES and p-value are indicated. (d– e) Integrated genome browser tracks for HOXA13 and HOXD13 ChIP-seq binding and H3K27 acetylation near the transcription start site of IGF1 and IGF2. A full list of pathways can be found in Supplementary Table 6. (f) GSEA pathway analysis for the top pathways enriched in fin melanocytes versus body melanocytes from the zebrafish acral melanoma model. IGF-related pathways are indicated in red. A full list of pathways can be found in Supplementary Table 4. (g) GSEA barcode plot comparing acral model fin vs body melanocytes showing enrichment of genes in the GO: Regulation of Multicellular Organisms Growth pathway, generated weighted WKS testing. NES and FDR = 0.05 adjusted p-values are indicated. (h) Boxplot showing log normalized counts of zebrafish igf1, igf2a, and igf2b expression in all melanocyte samples from bulk RNA-seq. N = 3 independent biological replicates. P-values calculated using DESeq2 and adjusted for FDR = 0.05. Box minima = 25th percentile, centre = 50th percentile, maxima = 75th percentile. Whiskers extends from the box maxima/minima to the largest/smallest value no further than 1.5 * IQR (interquartile range). Data beyond the end of the whiskers are plotted individually as outliers. (i– o) Cut & Run was performed on HOX13 expressing human melanoma cell lines, SKMEL-1088, SKMEL-1176, SKMEL-1206, using an antibody against HOXA13 and IgG as a negative control. (i) HOMER known motif analysis comparing HOXA13 vs IgG peaks identified significant enrichment for HOXB13 in all 3 melanoma cell lines. (j) GSEA pathway analysis using Cistrome-GO was performed, and the top enriched pathways are listed highlighting pathways related to insulin/IGF signaling. Insulin/IGF signaling pathways were identified using the search terms “insulin” and “IGF.” Insulin/IGF-related pathways were identified based on literature known to operate directly downstream of insulin/IGF signaling. A full list of pathways can be found in Supplementary Table 7. (k– o) IGV plot showing peaks along IGF1R, IGF2, IRS1, IRS2, and IGFBP3 for all 3 cell lines. The transcription start site (TSS) is indicated. (p) Patient derived melanoma cell lines were analyzed for HOXB13, pIGF1R, and total IGF1R expression by western blot. Actin was used as a loading control. Cell lines derived from acral and cutaneous tumors are labeled. SKMEL-1088 is a melanoma cell line of unknown anatomic origin. Images are representative of n = 3 biological replicates. (q) SKMEL-1176 and SKMEL-1206 acral melanoma cell lines were transfected with siRNAs targeting all 4 human HOX13 genes (HOXA13, HOXB13, HOXC13, HOXD13) or a non-targeting control. Cells were grown in standard media conditions. 96 h post-transfection, cells were collected and analyzed by western blot. HOXB13 was used to validate siRNA knockdown and then also probed for pIGF1R and IGF1R. Actin was used as a loading control. Blots are representative of n = 4 biological replicates. (r) Western blot quantification of the n = 4 biological replicates from (q). Data was analyzed using a two-sided student’s t-test. Error bars = SEM. For western blot source data, see Supplementary Fig. 4. * p-value < 0.05, ** p-value < 0.01, *** p-value < 0.001, **** p-value < 0.0001.
Extended Data Fig. 9 :
Extended Data Fig. 9 :. CRKL amplifies IGF signaling in human melanoma cells.
Related to Fig. 5. (a) Phospho-RTK array performed on WM3918 human melanoma cell line with or without overexpression of CRKL. Array tests phosphorylation status of 49 RTKs. For pRTK array source data, see Supplementary Fig. 2. (b) MeWo, SKMEL-1176, and 293T cells were transduced and selected to overexpress CRKL or an empty vector (EV) as a negative control. Western blot for CRKL, pIGF1R, and total IGF1R was then performed to compare basal levels of IGF signaling. Actin was used as a loading control. For western blot source data, see Supplementary Fig. 6. Quantification of western blots shown. Data represents n = 3 biological replicates and was analyzed using a two-sided student’s t-test. (c) Schematic representation of CRKL with a V5 tag. CRKL is composed of a SH2 (Src homology) domain that bind proteins with phospho-tyrosines and two SH3 domains that bind to proline-rich proteins. (d) Human melanoma cell line WM3918 overexpressing CRKL with a V5 tag was compared to CRKL overexpressing cells without the V5 tag. N = 5 control replicates and n = 6 CRKL-V5 biological replicates were used for each condition. Lysates were immunoprecipitated using a V5 antibody and then underwent mass spectrometry, yielding 57 significant interactors as defined by logFC > 2 and corrected p-value < 0.05. CRKL itself was among these significant interactors. Significant interactors with CRKL were organized based on whether they contain a canonical CRKL SH2-binding domain (pY-x-x-P), canonical CRKL SH3 binding motif (Ψ-P-Ψ-L/V/P/A/I-P-Ψ-K), known SH3 binding motif (proline-rich sequence), or no identified binding motif. Genes are color coded by their contribution to PI3K and MAPK signaling. (e) Heatmap showing increased detection of significant interactors in the CRKL-V5 vs control group, expressed as normalized counts. Raw data can be found in Supplementary Table 8. (f) Volcano plot showing log2 fold enrichment of CRKL-V5 IP vs. control IP (CRKL with no V5 tag). * p-value < 0.05, ** p-value < 0.01, *** p-value < 0.001, **** p-value < 0.0001.
Extended Data Fig. 10 :
Extended Data Fig. 10 :. CRKL-mediated melanocyte tailfin expansion depends on a HOX13/IGF positional program.
Related to Fig. 5. (a) Plasmids used to knockout the human CRKL transgene, and zebrafish IGF ligands (igf1, igf2a, igf2b) zebrafish HOX13 genes (hoxa13a, hoxa13b, hoxb13a, hoxc13a, hoxc13b, hoxd13a) and orthologue of HOXB7, hoxb7a, in a mosaic manner in CRKL stable line zebrafish. mitfa:Cas9 ensures melanocyte specificity in CRISPR editing. This plasmid also contains a fluorescent heart marker myl17:GFP, which was used to determine which fish had successful plasmid integration to be used in further downstream image analysis. (b) Surveyor validation demonstrating targeted editing of the human CRKL transgene using 3 different sgRNAs. For gel source data, see Supplementary Fig. 7a. (c) Surveyor validation demonstrating targeted editing zebrafish HOX genes using 6 different sgRNAs. Note, HOX13-targeting plasmids only target HOX13 genes (not hoxb7a) and hoxb7a-targeting plasmid only targets hoxb7a. For gel source data, see Supplementary Fig. 8. (d) Surveyor validation demonstrating targeted editing of all zebrafish IGF ligands using 3 different sgRNAs. For gel source data, see Supplementary Fig. 7b. (e) Tumor-free survival comparing acral to acral dnIRS2 genotypes. Number of fish for each genotype indicated in figure key. P-values generated by log-rank Mantel-Cox test. * p-value < 0.05, ** p-value < 0.01, *** p-value < 0.001, **** p-value < 0.0001.
Extended Data Fig. 11 :
Extended Data Fig. 11 :. HOX13 synergizes with CRKL to drive acral melanoma through IGF/PI3K signaling.
Related to Fig. 5. (a– d) Acral melanoma model imaged for melanocyte tailfin area at 3-days post-fertilization after indicated pharmacologic treatment. Representative images and quantification provided. P-value generated with two-sided student’s t-test. Error bars = SEM. (a) Insulin/IGF1 receptor antagonists BMS-754807 at 7.5 μM and NVP-AEW541 at 60 μM compared to 0.1% DMSO control. Data represents n = 35 DMSO-treated fish, n = 31 BMS-treated fish, and n = 26 NVP-treated fish pooled over n = 3 biological replicates. (b) PI3K inhibitor LY294002 at 15 μM and RAF/MEK inhibitor CH5126766 at 1 μM compared to 0.1% DMSO control. Data represents n = 45 DMSO-treated fish, n = 43 PI3K inhibitor-treated fish, and n = 21 RAF/MEK inhibitor-treated fish pooled over n = 3 biological replicates. (c) MEK inhibitors pimerasertib at 1 μM, refametinib at 1 μM, and trametinib at 200nM compared to 0.1% DMSO control. Data represents n = 46 DMSO-treated fish, n = 48 pimasertib-treated fish, and n = 61 refametinib-treated fish, and n = 44 trametinib-treated fish pooled over n = 4 biological replicates. (d) SOS1 inhibitor, Bl-3406, at 1 μM, MEK inhibitor refametinib at 1 μM, or combined Bl-3406 (1 μM) + refametinib (1 μM) treatment, compared to 0.1% DMSO control. Data represents n = 43 DMSO-treated fish, n = 31 SOS1 inhibitor-treated fish, n = 44 MEK inhibitor-treated fish, and n = 35 combined SOS1/MEK inhibitor-treated fish pooled over n = 3 biological replicates. * p-value < 0.05, ** p-value < 0.01, *** p-value < 0.001, **** p-value < 0.0001.
Extended Data Fig. 12 :
Extended Data Fig. 12 :. Anatomic position determines oncogenic specificity in melanoma.
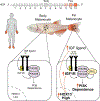
Related to Fig. 5. Melanocytes at different anatomic locations have different positional identities determined by HOX genes. Fin/limb melanocytes have higher expression of posterior HOX13 genes. HOX13 drives higher expression of IGF ligands and IGF1R, resulting in greater IGF signaling and increases the vulnerability of fin melanocytes to CRKL-mediated transformation. CRKL synergizes with a HOX13 program in fin melanocytes by forming a complex with PI3K, the primary downstream mediator of IGF1R, thereby amplifying IGF signaling. This results in tumor phenotypes with sensitivity to IGF1R or PI3K inhibition, but only modest effects from MAPK inhibition.
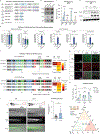
Fig. 1 |
Fig. 1 |. Acral and cutaneous melanoma driver genes lead to anatomically distinct tumours in transgenic zebrafish.
a, b, MSK-IMPACT targeted sequencing of biologically independent samples from 100 patients with acral melanoma and 839 patients with cutaneous melanoma. a, The acral enrichment score was calculated by dividing the frequency a gene is altered in acral melanoma by the frequency it is altered in cutaneous melanoma. This ratio was then log2-transformed for visualization. Positive scores indicate genes enriched in acral melanoma and negative scores indicate genes enriched in cutaneous melanoma. KO, knockout. b, Frequency of gene amplifications compared by melanoma subtype using a two-sided Fisher’s exact test. c, RNA sequencing on a separate cohort of biologically independent samples from 61 patients with acral melanoma and 53 patients with cutaneous melanoma comparing expression of CRKL and GAB2. The centre line indicates the median, box edges show 25th and 75th percentiles, and whiskers extend to the largest and smallest values up to 1.5× the interquartile range. False discovery rate (FDR) = 0.05; adjusted P values calculated using a two-sided Wald test in DESeq2. d, Transgenic zebrafish models. The WT melanocyte model expresses no oncogenic drivers. In the acral melanoma model, the human genes CRKL, GAB2 and TERT are overexpressed and the zebrafish NF1 orthologues nf1a and nf1b are knocked out. The cutaneous melanoma model expresses BRAFV600E in a p53−/− genetic background. All transgenes are driven by the melanocyte-specific promoter mitfa, and melanocytes are marked with GFP expression driven by the mitfa promoter. See Extended Data Fig. 2a for more details. BF, bright-field image. e, Ternary diagram showing the percentage of tumours arising in the head, body and fins. Anatomic distribution was compared using a chi-squared test. Histogram representation in Extended Data Fig. 2h. Fish and tumour numbers in Supplementary Table 3. f, Tumour-free survival of WT melanocytes (n = 94), and acral (n = 230) and cutaneous (n = 182) transgenic zebrafish models. P-values by log-rank Mantel–Cox test. *P < 0.05, **P < 0.01, ***P < 0.001, ****P < 0.0001.
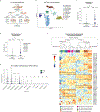
Fig. 2 |
Fig. 2 |. CRKL drives melanoma to acral sites.
a, The four genes (CRKL, GAB2, TERT and NF1 knockout) used to drive the acral melanoma model were introduced separately to assess sufficiency in tumourigenesis. b, Representative images of zebrafish for each genotype. c, Tumour-free survival of indicated genotypes. Number of fish of each genotype is indicated. P-values by log-rank Mantel–Cox test. d, Pie chart showing the percentage of melanomas arising at each anatomic location that are driven by CRKL alone. The number of tumours is indicated. e, Ternary diagram portraying the percentage of tumours forming in the head, body and fins of indicated genotypes. A chi-squared test was performed to compare the anatomic distribution between the different transgenic models. f, Each of the four acral driver genes was removed in turn from the acral melanoma zebrafish model to assess which driver genes were necessary for tumourigenesis. g, Tumour-free survival of fish of the indicated genotypes. The number of fish of each genotype is indicated. P-values by log-rank Mantel-Cox test. h, Left, representative images of zebrafish for each genotype. Right, pie charts showing the anatomic distribution of tumours. The number of tumours is indicated. i, Ternary diagram comparing the indicated genotypes. A chi-squared test was used to compare anatomic distribution between genotypes. Numbers of fish and tumours across all replicates and experimental conditions are shown in Supplementary Table 3. NS, not significant.
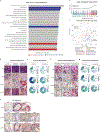
Fig. 3 |
Fig. 3 |. Positional identity gene programmes determine the response to CRKL.
a, Schematic illustrating the fin versus body RNA-seq experiment. Body skin and fins were isolated from WT and acral melanoma fish by dissection and then sorted by FACS for GFP+ melanocytes and GFP− surrounding cells. TME, tumour microenvironment. b, Unsupervised clustering using the 500 most variable genes across all samples, clustered by cell lineage, anatomic position and then genotype. c, Waterfall plot representation of gene set enrichment analysis (GSEA) pathway analysis of WT fin melanocytes versus body melanocytes, showing the top 2,500 enriched pathways and highlighting pathways related to limb development and positional identity. Limb development pathways were identified using the search terms ‘limb’ or ‘appendage’. Pathways related to positional identity were identified using the search terms ‘morphogenesis’, ‘pattern’ and ‘regionalization’. Only pathways with FDR < 0.05 are highlighted. The specific pathways highlighted in the plot are shown in Extended Data Fig. 5e, Supplementary Table 4. d, Heat map representing expression of transgenes, melanocyte markers and hox genes across all samples.
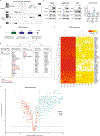
Fig. 4 |
Fig. 4 |. Human acral versus cutaneous melanoma have distinct positional identity gene programmes.
a, RNA-seq performed on samples from 61 patients with acral melanoma and 53 patients with cutaneous melanoma. b, Waterfall plot representation of GSEA pathway analysis of human acral versus cutaneous melanoma showing the top 2,000 enriched pathways and highlighting pathways related to limb development and positional identity. GSEA analysis is controlled for disease stage. Only pathways with FDR < 0.05 are highlighted. The specific pathways highlighted in the plot are shown in Extended Data Fig. 7a and Supplementary Table 5. c, Volcano plot showing differentially expressed genes between acral and cutaneous melanoma samples. Genes with FDR-adjusted P-value (Padj) < 0.05 are indicated in blue. P-values calculated using DESeq2. d, Box plots showing differences in gene expression between acral melanoma and cutaneous melanoma samples. The centre line indicates the median, box edges show 25th and 75th percentiles, and whiskers extend to the largest and smallest values up to 1.5× the interquartile range. FDR = 0.05; adjusted P-values calculated using a two-sided Wald test with DESeq2. e, HOXB13 immunohistochemistry (IHC) on an acral melanoma tissue microarray. Representative images of three samples are shown. A total of 30 samples was independently scored for extent and intensity, and are represented by the pie charts. LN, lymph node. f, HOMER known-motif enrichment analysis on genes upregulated in acral versus cutaneous melanoma (log2 fold change cut-off ±1.5, two-sided Wald test with Padj < 0.05; within ±500 bp of the transcription start site (TSS).
Fig. 5 |
Fig. 5 |. CRKL synergizes with HOX13–IGF signalling to drive acral melanoma.
a, HOX13 ChIP–seq performed on developing limb buds from embryonic day (E)11.5 mouse embryos. b, Waterfall plot representation of the 5,625 top enriched GSEA pathways regulated by HOXD13 binding, highlighting limb and IGF-related pathways with FDR < 0.05. Specific pathways are presented in Extended Data Fig. 8b, Supplementary Table 6. c, Western blot for HOXB13 and IGF2 in human acral melanoma cell lines after siRNA knockdown of all 4 HOX13 genes (HOXA13, HOXB13, HOXC13 and HOXD13). Western blot source data are shown in Supplementary Fig. 1. d, Quantification of western blot in c. Data were analysed using two-sided Student’s t-test on n = 4 biological replicates. Data are mean ± s.e.m. e, ELISA for IGF2 on conditioned media after siRNA knockdown of all 4 HOX13 genes. Data were analysed using a two-sided Student’s t-test on n = 3 biological replicates. Data are mean ± s.e.m. f, Schematic representation of tailfin melanocyte assay. gj, The mitfa:CRKL stable zebrafish line were injected with plasmids to knock out CRKL, igf (g, quantified in i), hoxb7a or hox13 expression (h, quantified in j). At 3 days post-fertilization, tailfins were imaged for melanocyte area. Representative images are shown. Data are pooled over n = 3 biological replicates and the number of fish per condition is indicated. Data were analysed using a two-sided Student’s t-test. Data are mean ± s.e.m. NT, non-targeting. k, Bottom, schematic of dnIRS2 transgene used to block insulin and IGF signalling in zebrafish melanocytes. Top left, representative images of the acral melanoma model with or without overexpression of dnIRS2–GFP. Top right, pie charts show the anatomic distribution of each genotype. Number of tumours is indicated. l, Ternary plot showing the anatomic distribution of tumours with indicated genotypes. P-values generated by chi-squared test. Fish and tumour numbers are shown in Supplementary Table 3.

Comment in

References

    1. Tang J et al. The genomic landscapes of individual melanocytes from human skin. Nature 586, 600–605 (2020). - PMC - PubMed
    1. Fowler JC et al. Selection of oncogenic mutant clones in normal human skin varies with body site. Cancer Discov. 11, 340–361 (2020). - PMC - PubMed
    1. Reed R In New Concepts in Surgical Pathology of the Skin 89–90 (Wiley, 1976).
    1. Wang KC, Helms JA & Chang HY Regeneration, repair and remembering identity: the three Rs of Hox gene expression. Trends Cell Biol. 19, 268–275 (2009). - PMC - PubMed
    1. Curtin JA et al. Distinct sets of genetic alterations in melanoma. N. Engl. J. Med. 353, 2135–2147 (2005). - PubMed