. 2022 Apr;604(7904):146-151.
doi: 10.1038/s41586-022-04578-4. Epub 2022 Mar 30.

Genetic instability from a single S phase after whole-genome duplication

Affiliations

Genetic instability from a single S phase after whole-genome duplication

Simon Gemble et al. Nature. 2022 Apr.

Erratum in

Abstract

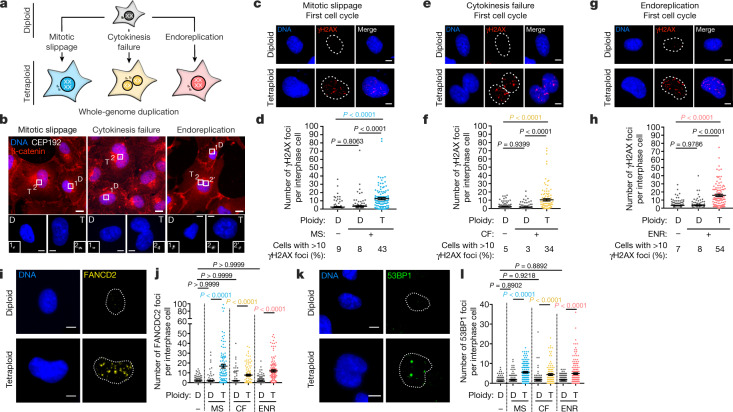
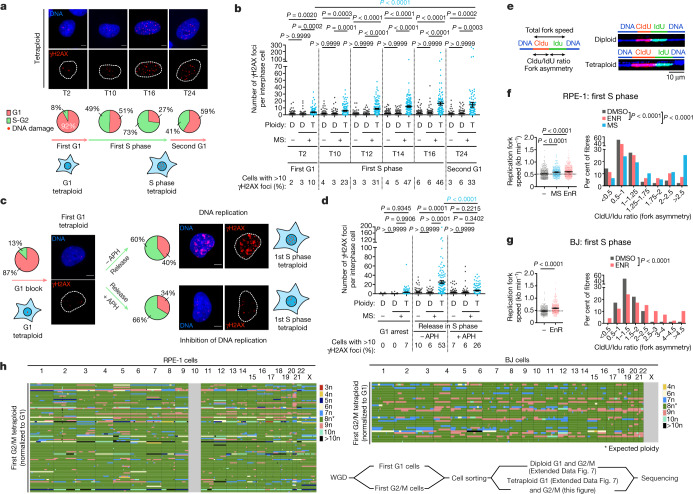
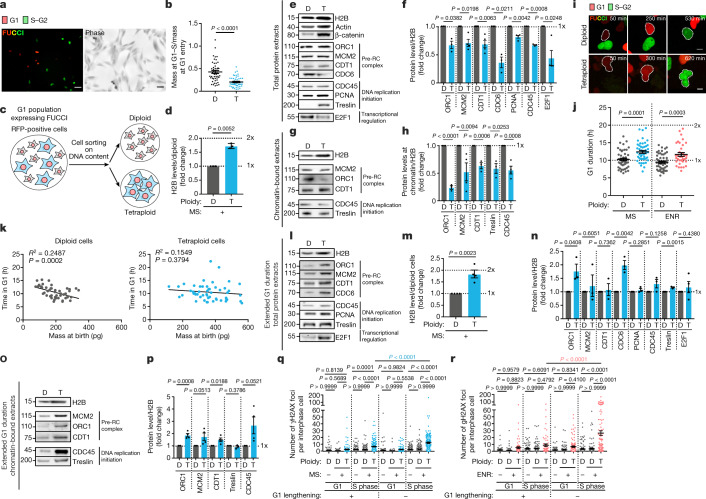
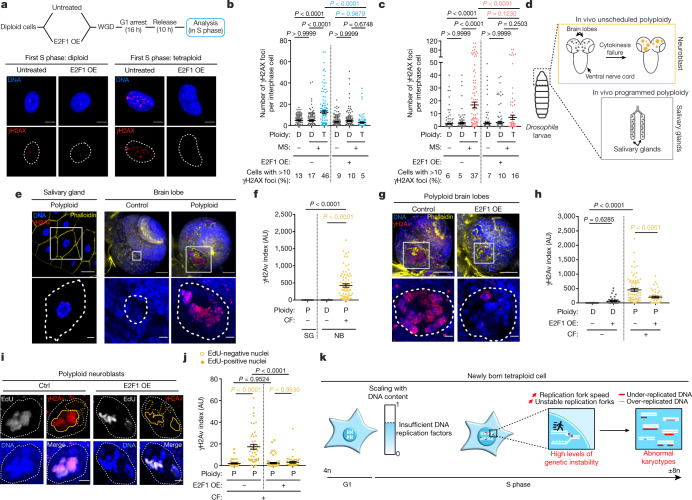
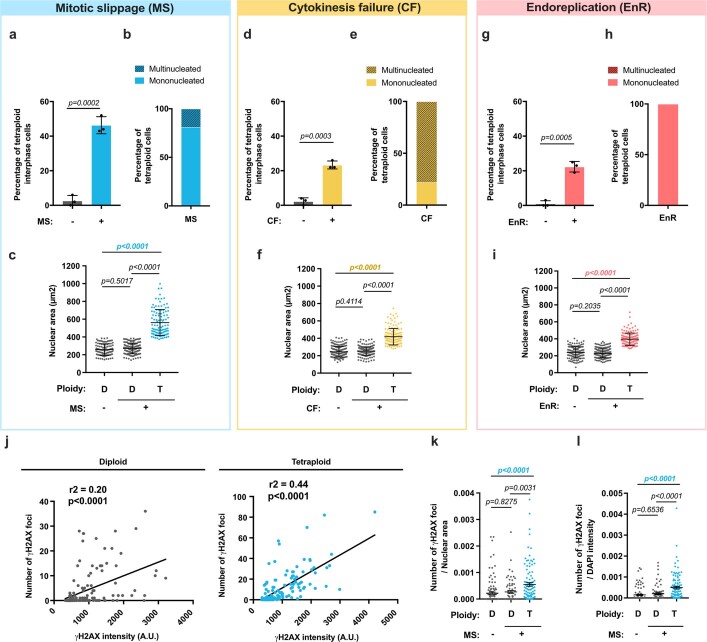
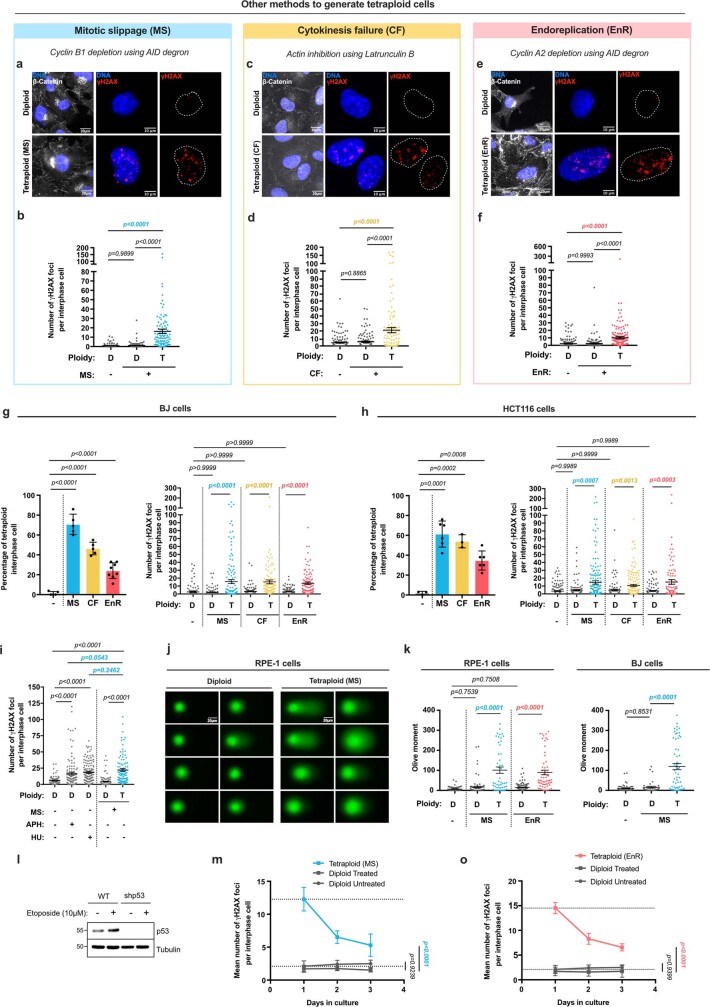
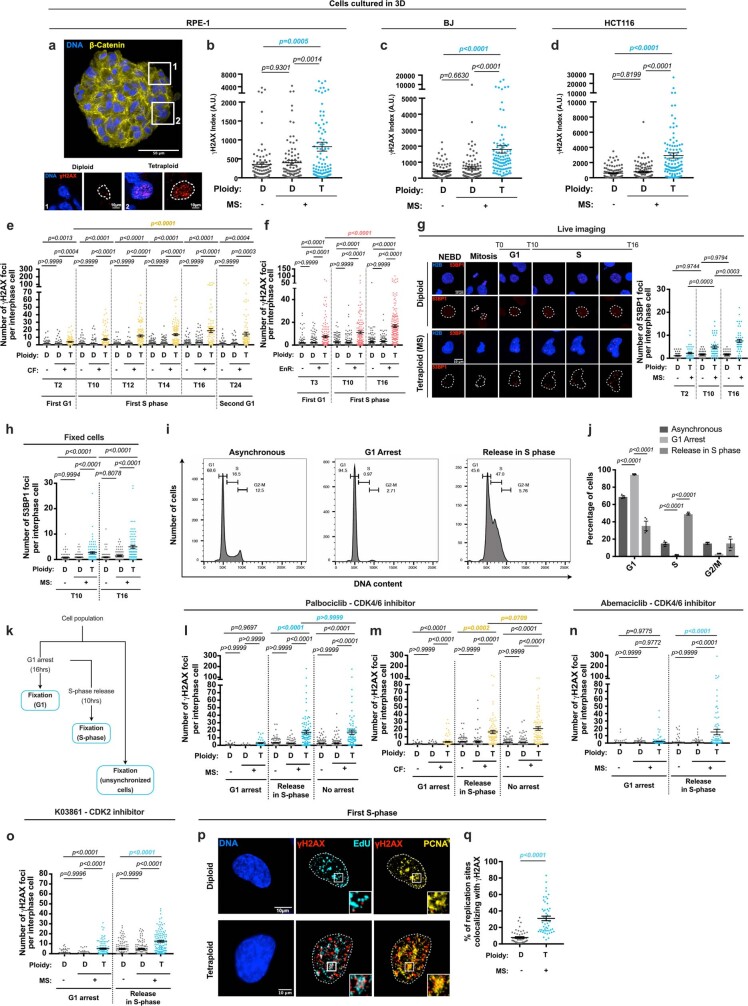
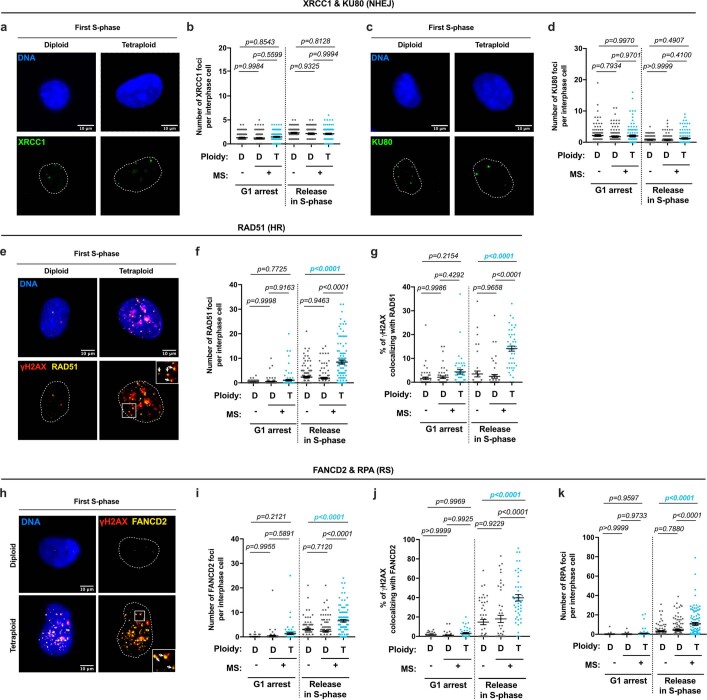
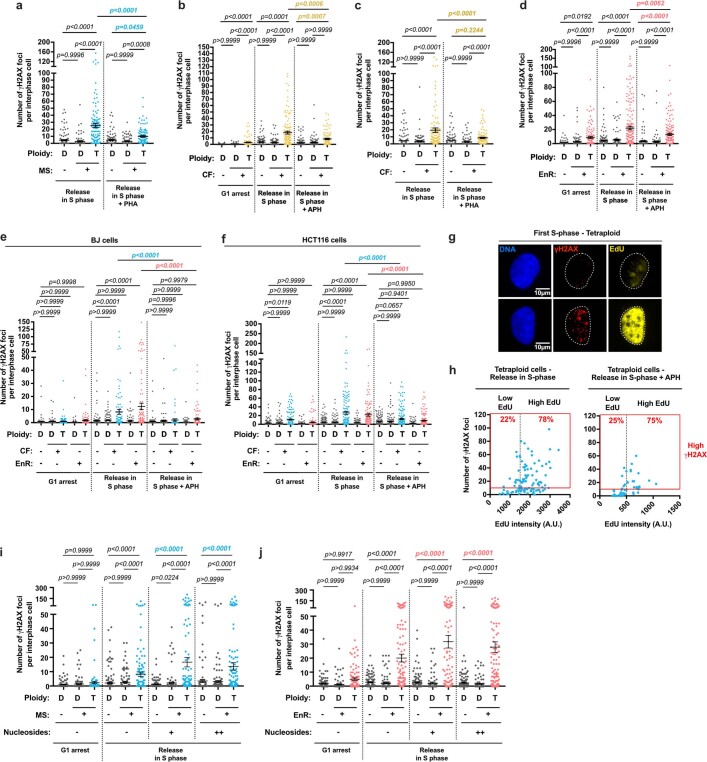
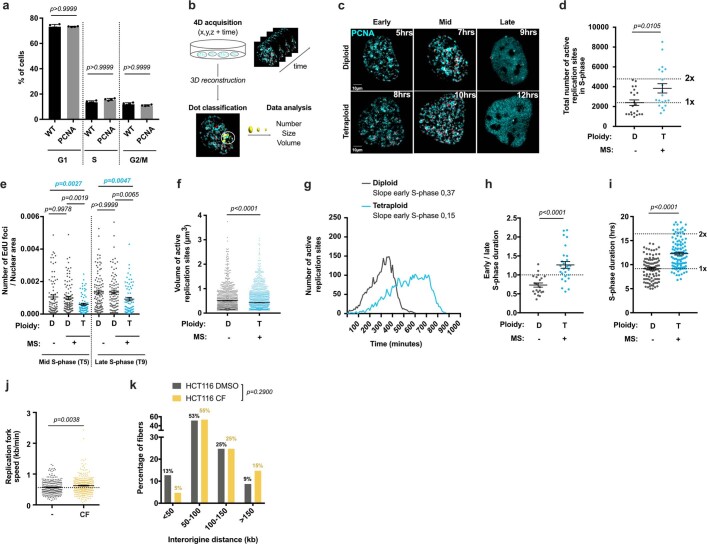
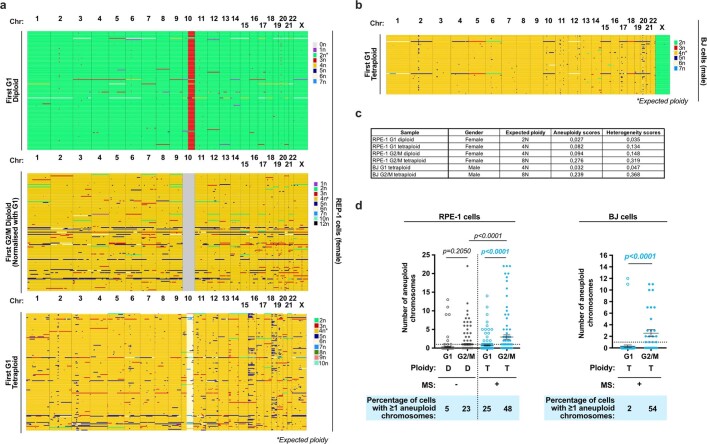
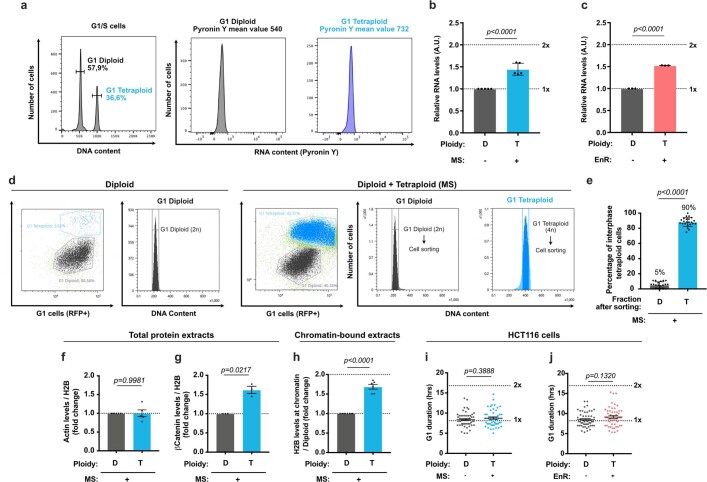
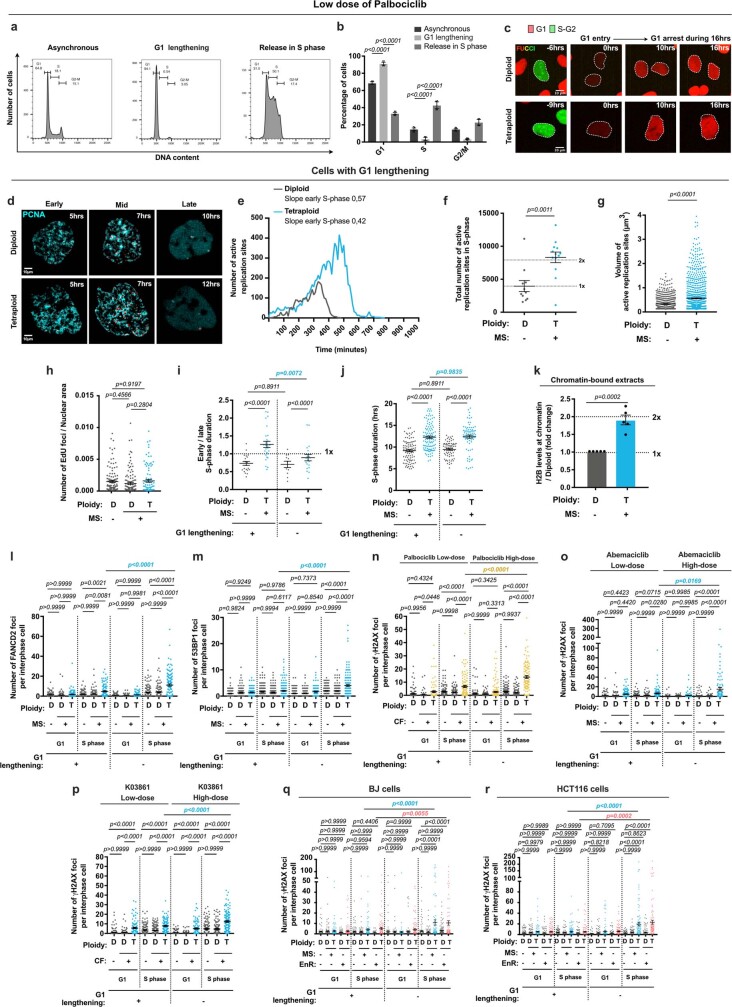
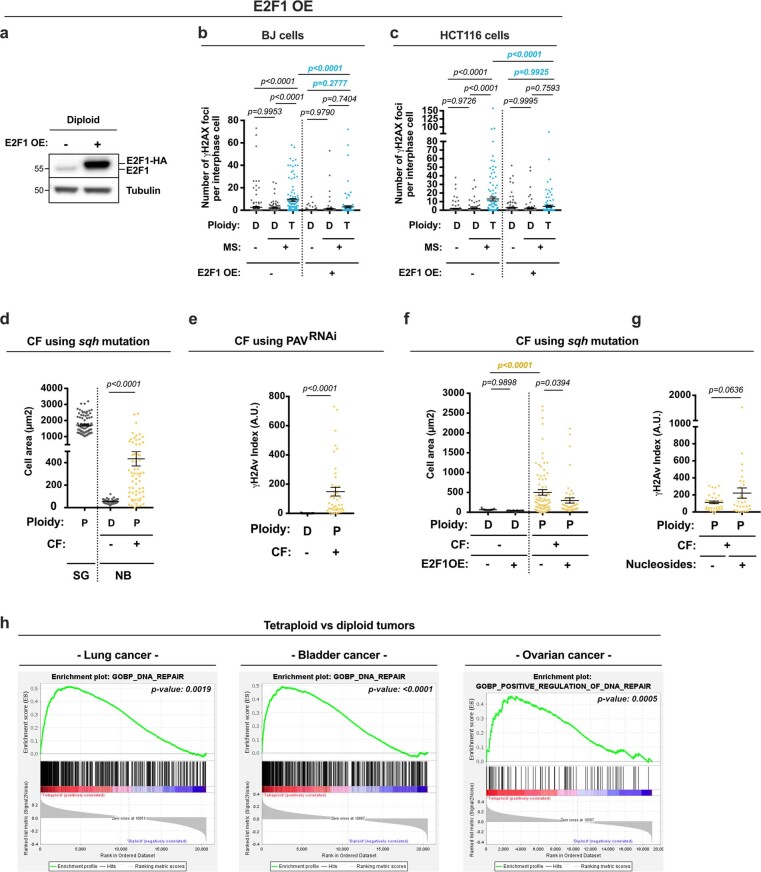
Diploid and stable karyotypes are associated with health and fitness in animals. By contrast, whole-genome duplications-doublings of the entire complement of chromosomes-are linked to genetic instability and frequently found in human cancers1-3. It has been established that whole-genome duplications fuel chromosome instability through abnormal mitosis4-8; however, the immediate consequences of tetraploidy in the first interphase are not known. This is a key question because single whole-genome duplication events such as cytokinesis failure can promote tumorigenesis9. Here we find that human cells undergo high rates of DNA damage during DNA replication in the first S phase following induction of tetraploidy. Using DNA combing and single-cell sequencing, we show that DNA replication dynamics is perturbed, generating under- and over-replicated regions. Mechanistically, we find that these defects result from a shortage of proteins during the G1/S transition, which impairs the fidelity of DNA replication. This work shows that within a single interphase, unscheduled tetraploid cells can acquire highly abnormal karyotypes. These findings provide an explanation for the genetic instability landscape that favours tumorigenesis after tetraploidization.


Conflict of interest statement

The authors declare no competing interests.

Figures

Fig. 1
Fig. 1. High levels of DNA damage in the first interphase following unscheduled WGD.
a, Schematic of the methods used to generate tetraploid cells. b, Top, images of diploid (D) and tetraploid (T) RPE-1 cells generated by mitotic slippage, cytokinesis failure or endoreplication. Centrosomes labelled with anti-CEP192 and cell membranes labelled with anti-β-catenin. Bottom, outlined regions are shown at higher magnification. c, e, g, Images showing DNA damage caused by mitotic slippage (c), cytokinesis failure (e) or endoreplication (g) revealed by anti-γH2AX in diploid and tetraploid RPE-1 cells as indicated. d, f, h, The number of γH2AX foci following mitotic slippage (d), cytokinesis failure (f) or endoreplication (h) per interphase cell in diploid and tetraploid RPE-1 cells. Data are mean ± s.e.m.; >100 interphase cells, 3 independent experiments. The percentage of interphase cells with at least ten γH2AX foci for each condition is indicated under the graph. i, k, Images of diploid and tetraploid RPE-1 cells generated by mitotic slippage labelled with anti-FANCD2 (i) or anti-53BP1 (k) antibodies. j, l, The number of FANCD2 (j) or 53BP1 (l) foci per interphase cell in diploid and tetraploid RPE-1 cells. Data are mean ± s.e.m.; >100 interphase cells, 3 independent experiments. Dotted lines indicate the nuclear region. CF, cytokinesis failure; ENR, endoreplication; MS, mitotic slippage. d, f, h, j, l, One-sided analysis of variance (ANOVA) test. Scale bars, 10 μm. Source data
Fig. 2
Fig. 2. Genetic instability in tetraploid cells is generated during S phase in a DNA replication-dependent manner.
a, Top, DNA damage visualized using γH2AX in RPE-1 tetraploid cells. Bottom, percentage of RPE-1 tetraploid cells in G1 or in S–G2. Data are mean >100 interphase cells, 3 independent experiments. b, The number of γH2AX foci per interphase cell in diploid (D) and tetraploid (T) RPE-1 cells. Data are mean ± s.e.m.; >100 interphase cells, 3 independent experiments. c, Percentage of RPE-1 tetraploid cells in G1 or in S–G2 and representative images showing DNA damage (anti-γH2AX) in tetraploid cells synchronized in G1 using 1 µM palbociclib or released in S phase with or without 400 nM APH. Data are mean ± s.e.m.; >100 interphase cells, 3 independent experiments. d, The number of γH2AX foci per interphase cell in diploid and tetraploid RPE-1 cells from c. Data are mean ± s.e.m.; >100 interphase cells, 3 independent experiments. e, Left, scheme for replication fork analysis. Right, immunofluorescence of DNA fibres obtained from diploid and tetraploid RPE-1 cells. f, g, Left, the replication fork speed in diploid and tetraploid RPE-1 (f) or BJ cells (g). Right, the CldU/IdU ratio in diploid and tetraploid RPE-1 (f) or BJ cells (g). Data are mean ± s.e.m.; >330 replication forks (f), >295 replication forks (g). h, Genome-wide copy number plots for G2/M tetraploid RPE-1 or BJ cells induced by mitotic slippage. Each row represents a cell. Bottom right, workflow showing the method used to sort the cells. b, d, f, One-sided ANOVA test. g, Two-sided t-test. Scale bars, 10 μm. Source data
Fig. 3
Fig. 3. Key replication factors do not scale up in tetraploid cells.
a, Tetraploid cells expressing FUCCI and the corresponding image under phase microscopy. b, The ratio of protein produced during G1 in diploid (D) and tetraploid (T) cells. Data are mean ± s.e.m.; >50 G1 cells, 2 experiments. c, Schematic of fluorescence-activated cell sorting. d, Relative H2B levels in RPE-1 cells. Data are mean ± s.e.m.; three experiments. e, g, Western blots of total protein extracts (e) or chromatin-bound extracts (g) obtained from RPE-1 cells. f, h, The protein levels from total protein extracts in e (f) and chromatin-bound extracts in g (h). Data are mean ± s.e.m.; three independent experiments. i, Stills from time-lapse videos of RPE-1 cells expressing FUCCI. j, Graph showing the duration of G1 in RPE-1 cells. Data are mean ± s.e.m.; >35 interphase cells, 2 independent experiments. k, Graphs showing the time in G1 and the mass at birth of RPE-1 cells. More than 50 interphase cells, 2 independent experiments. l, o, Western blots of (l) or chromatin-bound extracts (o) obtained from RPE-1 cells with extended G1 duration. m, Relative H2B levels in RPE-1 cells with extended G1 duration. Data are mean ± s.e.m.; four experiments. n, p, Protein concentration in total protein extracts from l (n) and chromatin-bound extracts from o (p). Data are mean ± s.e.m.; three experiments. q, r, The number of γH2AX foci in RPE-1 cells with G1 lengthening or G1 arrest using 160 nM or 1 µM palbociclib and released in S phase. Tetraploidy induced by mitotic slippage (q) or endoreplication (r). Data are mean ± s.e.m.; >100 interphase cells, 3 independent experiments. e, g, l, o, The same number of cells was loaded for each condition. j, q, r, One-sided ANOVA test. d, f, h, mo, Two-sided t-test. k, Two-sided Pearson test. Scale bars, 50 μm (a), 10 μm (i). Source data
Fig. 4
Fig. 4. Increased E2F1 levels are sufficient to rescue genetic instability in both tetraploid cells and in unscheduled polyploid cells in vivo.
a, Top, workflow showing the method used to overexpress E2F1 (E2F1 OE). Bottom, γH2AX immunofluorescence in cells overexpressing E2F1. b, c, Graphs showing the number of γH2AX foci per interphase cell in diploid (D) and tetraploid (T) RPE-1 cells released in S phase with and without E2F1 overexpression. Tetraploidy induced by mitotic slippage (b) or endoreplication (c). Data are mean ± s.e.m.; >100 interphase cells, three experiments. d, Experimental scheme to show the brain and the salivary glands of Drosophila larva. e, Representative images of salivary glands from wild-type larvae and brain lobes of control or sqh-mutant larvae. f, γH2Av index in salivary glands (SG) and in diploid (D) and polyploid (P) neural stem cells from the Drosophila larvae brain. NB, neuroblast. Data are mean ± s.e.m.; >60 interphase cells, 3 experiments. g, γH2Av in brain lobes of control or sqh-mutant larvae with or without E2F1 overexpression. h, γH2Av index in neuroblasts with or without E2F1 overexpression. Data are mean ± s.e.m.; >30 interphase cells, 3 experiments. i, γH2Av in neuroblasts derived from sqh-mutant larvae with or without E2F1 overexpression. The yellow dotted lines indicate EdU-negative nuclei, the solied yellow line indicates EdU-positive nuclei. j, γH2Av index in EdU-negative and EdU-positive nuclei with or without E2F1 overexpression. Data are mean ± s.e.m.; >30 interphase cells, 3 experiments. k, Model in which a single S phase generates genetic instability in tetraploid cells. The white dotted lines indicate the nuclear (a) or cell area (e, g, i). b, c, f, h, j, One-sided ANOVA test. Scale bars, 10 µm (a, e bottom right, g bottom), 20 µm (e bottom middle, i), 50 µm (e top, e bottom left, g top). Source data
Extended Data Fig. 1
Extended Data Fig. 1. Characterization of RPE-1 cells upon WGD.
(a, d and g) Graphs showing the percentage of tetraploid interphase RPE-1 cells in the indicated experimental conditions. Mean ± SEM, > 100 interphase cells were analyzed from three independent experiments. (b, e and h) Graphs showing the percentage of mono- and multinucleated RPE-1 tetraploid cells in the indicated experimental conditions. Mean ± SEM, > 100 interphase cells were analyzed from three independent experiments. (c, f and i) Graphs representing the nuclear area in diploid (D) and tetraploid (T) RPE-1 cells. Mean ± SEM, >100 interphase cells were analyzed from three independent experiments. (j) Graph showing the correlation between the number of γH2AX foci and γH2AX foci intensity in diploid (left panel, gray) and tetraploid (right panel, blue) RPE-1 cells induced through MS. >100 interphase cells were analyzed from three independent experiments. (k–l) Graphs showing the number of γH2AX foci relative to nuclear area (k) or DAPI fluorescence intensity (FI) (l) in diploid (gray) and tetraploid (blue) RPE-1 cells induced through MS. t-test (two-sided) (a, d and g). ANOVA test (one-sided) (c, f, i, k and l). Pearson test (two-sided) (j). Source data
Extended Data Fig. 2
Extended Data Fig. 2. Additional methods and cell lines confirm that WGD generates high levels of DNA damage within the first interphase.
(a, c and e) Images showing diploid and tetraploid (generated as indicated) RPE-1 cells labeled with γH2AX (red) and β-Catenin (gray) antibodies. DNA in blue. (b, d and f) Graphs showing the number of γH2AX foci in diploid (D) and tetraploid (T) RPE-1. Mean ± SEM, >100 interphase cells were analyzed from at least three independent experiments. (g–h) Left - Graph showing the percentage of tetraploid interphase cells in BJ (g) or HCT116 (h) cell lines. Mean ± SEM, >100 interphase cells were analyzed from at least three independent experiments. Right - Graph representing the number of γH2AX foci in diploid and tetraploid BJ (g) or HCT116 (h) cells. Mean ± SEM, >100 interphase cells were analyzed from at least three independent experiments. (i) Graph showing the number of γH2AX foci in diploid (gray) or tetraploid (blue) RPE-1 cells treated with 1 µM APH or 2 mM HU. Mean ± SEM, >100 interphase cells were analyzed from at least three independent experiments. (j) Comet images from diploid (left) and tetraploid (right) RPE-1 cells. (k) Graph showing the olive moment in diploid and tetraploid RPE-1 (left) or BJ (right) cell lines. Mean ± SEM, > 100 comets were analyzed from two independent experiments. (l) p53 and tubulin levels assessed by western blot. Etoposide was added as a control for the increased p53 levels. (m and o) Graphs representing the mean number of γH2AX foci per interphase cell over time (days in culture) in diploid and tetraploid RPE-1 cells. Mean ± SEM, > 100 interphase cells were analyzed from two independent experiments. The dotted lines indicate nuclear area. ANOVA test (one-sided) (b, d, f, g, h, i, k, m and o). Source data
Extended Data Fig. 3
Extended Data Fig. 3. DNA damage is generated during the first S-phase upon WGD.
(a) 3D RPE-1 spheroid low magnification (top) and insets of two cells showing diploid and tetraploid nuclei (bottom) induced through MS labeled with γH2AX (red) and β-Catenin (yellow) antibodies. DNA in blue. (b–d) γH2AX index in diploid and tetraploid RPE-1 (b), BJ (c) and HCT116 (d) spheroids. Mean ± SEM, > 95 interphase cells were analyzed from at least two independent experiments. (e–f) γH2AX foci in diploid and tetraploid RPE-1 cells over time. (g) Left - Stills of RPE-1 cells expressing RFP-H2B and GFP-53BP1 time lapse videos. Right- 53BP1 foci number in diploid and tetraploid cells. Mean ± SEM, > 40 interphase cells were analyzed from three independent experiments. (h) 53BP1 foci number in fixed diploid and tetraploid RPE-1. (i) Cell cycle distribution of RPE-1 cells in the indicated conditions. (j) Percentage of RPE-1 cells in G1, S and G2-M in the indicated conditions. Mean ± SEM, >30 000 cells from at least three independent experiments. (k) Workflow used to analyze G1 or S-phase cells. (l and m) γH2AX foci number in diploid and tetraploid RPE-1 cells as indicated. Experiments (l and m) share the same reference control. (n, o) γH2AX foci number in diploid and tetraploid RPE-1 cells synchronized in G1 using 0,5 µM abemaciclib (n) or 1 µM K03861 (o) or released in S-phase. (p) Images of γH2AX (red) and EdU (cyan)/ PCNA (yellow) foci co-localization in S-phase in diploid and tetraploid RPE-1 cells. DNA in blue. White squares highlight higher magnifications. (q) Percentage of replication sites (EdU) colocalizing with γH2AX foci. Mean ± SEM, >50 interphase cells were analyzed from at least three independent experiments. For (e, f, h, lo) Mean ± SEM, >100 interphase cells were analyzed from at least three independent experiments. The dotted lines indicate nuclear area. ANOVA test (one-sided) (b, c, d, e, f, g, h, j, l, m, n and o). t-test (two-sided) (q). Source data
Extended Data Fig. 4
Extended Data Fig. 4. DNA damage in newly born tetraploid S-phase cells is associated with HR and RS-associated markers.
(a and c) Diploid and tetraploid RPE-1 S-phase cells labeled with XRCC1 (a, in green) or KU80 antibodies (c, in green). DNA in blue. (b and d) Number of XRCC1 (b) or KU80 (d) foci in diploid and tetraploid RPE-1 cells synchronized in G1 using 1µM palbociclib or released in S-phase. Mean ± SEM, >100 interphase cells were analyzed from at least three independent experiments. (e) Images showing γH2AX (red) and RAD51 (yellow) foci colocalization (white arrows) in diploid and tetraploid RPE-1 cells. DNA in blue. The white squares correspond to higher magnification regions. (f) RAD51 foci number in diploid and tetraploid RPE-1 cells arrested in G1 using 1 µM palbociclib or released in S-phase. Mean ± SEM, >100 interphase cells analyzed from at least three independent experiments. (g) Percentage of colocalizing γH2AX and RAD51 signals in diploid and tetraploid RPE-1 cells arrested in G1 using 1 µM palbociclib or released in S-phase. Mean ± SEM, >50 interphase cells were analyzed from at least three independent experiments. (h) Images showing the colocalization (white arrows) of γH2AX (red) and FANCD2 (yellow). DNA in blue. (i) FANCD2 foci number in diploid and tetraploid RPE-1 cells. Mean ± SEM, >80 interphase cells were analyzed from at least three independent experiments. (j) Graph representing the percentage of γH2AX signal colocalizing with FANCD2 foci in diploid and tetraploid RPE-1 interphase cells. Mean ± SEM, >50 interphase cells were analyzed from at least three independent experiments. (k) Graph showing RPA number foci in diploid and tetraploid RPE-1 cells arrested in G1 using 1 µM palbociclib or released in S-phase. Mean ± SEM, >100 interphase cells were analyzed from at least three independent experiments. The dotted lines indicate the nuclear area. ANOVA test (two sided) (b, d, f, g, i, j and k). Source data
Extended Data Fig. 5
Extended Data Fig. 5. DNA damage in newly born tetraploid cells is generated in a DNA replication-dependent manner.
(a) γH2AX foci number in diploid and tetraploid RPE-1 cells released in S-phase ± 1 µM PHA. Mean ± SEM, >100 interphase cells were analyzed from at least three independent experiments. (b–c) γH2AX foci number in diploid and tetraploid RPE-1 cells, arrested in G1 using 1 µM palbociclib or released in S-phase ± 400 nM aphidicolin (APH) (b) or 1 µM PHA (c). Mean ± SEM, >100 interphase cells were analyzed from at least three independent experiments. (d) γH2AX foci number in diploid and tetraploid RPE-1 cells released in S-phase ± 400 nM APH. Mean ± SEM, >100 interphase cells were analyzed from at least three independent experiments. (e–f) γH2AX foci number in diploid and tetraploid BJ (e) or HCT116 (f) cells, released in S-phase ± 400 nM APH. Mean ± SEM, >100 interphase cells were analyzed from at least three independent experiments. (g) Images showing EdU ± tetraploid RPE-1 cells. γH2AX antibodies in red, EdU in yellow and DNA in blue. (h) γH2AX foci number relative to EdU intensity in RPE-1 tetraploid cells released in S-phase untreated (left panel) or treated (right panel) with 400 nM aphidicolin (APH). Mean ± SEM, >100 interphase cells were analyzed from at least three independent experiments. (i, j) γH2AX foci number in diploid and tetraploid cells (i, blue) or EnR (j, red), synchronized in G1 using 1 µM palbociclib or released in S-phase ±nucleosides at two different concentrations (methods). Mean ± SEM, >100 interphase cells were analyzed from at least three independent experiments. The dotted lines indicate the nuclear area. ANOVA test (one-sided) (a, b, c, d, e, f, i and j). Pearson test (two-sided) (h). Source data
Extended Data Fig. 6
Extended Data Fig. 6. DNA replication dynamics is impaired during the first S-phase in tetraploid cells.
(a) Percentage of cells per cell cycle phase in RPE-1 (dark gray) and RPE-1 PCNAchromo cell lines (light gray). (b) Workflow depicting methods used to process and analyze DNA replication by time-lapse. (c) Stills of time lapse movies of diploid and tetraploid RPE-1 PCNAchromo cells. Active replication sites are visualized using PCNA chromobodies (in cyan) and reconstructed using Imaris in 3D (in red). (d) Total number of active replication sites in S-phase in diploid and tetraploid RPE-1 cells. Mean ± SEM, >20 S-phase cells were analyzed from three independent experiments. (e) EdU foci number relative to nuclear area in diploid and tetraploid RPE-1 cells in mid (T5) or late (T9) S-phase. Mean ± SEM, >100 interphase cells were analyzed from at least three independent experiments. (f) Volume of active replication sites (in µm3) for diploid and tetraploid RPE-1 PCNAchromo cells. Mean ± SEM, at least 1000 active replication sites were analyzed from three independent experiments. (g) Mean number of active replication sites over time in diploid and tetraploid RPE-1 cells. >20 S-phase cells were analyzed from two independent experiments (see Supplementary Data 1). (h) Ratio of early/late S-phase duration in diploid or tetraploid RPE-1 PCNAchromo cells ± extended G1 duration. Mean ± SEM, > 70 cells from two independent experiments were analyzed. (i) S-phase duration in diploid or tetraploid RPE-1 PCNAchromo cells ± extended G1 duration. Mean ± SEM, > 70 cells from two independent experiments were analyzed. (j) Replication fork speed in diploid and tetraploid HCT116 cells. Mean ± SEM, > 250 replication forks were analyzed. (k) Proportion of fibers with the indicated inter-origin distance (kb) in diploid or tetraploid HCT116 cells. Mean ± SEM, > 75 replication origins were analyzed. ANOVA test (one-sided) (a and e). t-test (two-sided) (d, f, h, i, j and k). Source data
Extended Data Fig. 7
Extended Data Fig. 7. Genome wide analysis of RPE-1 and BJ tetraploid cells.
(a, b) Genome-wide copy number plots of G1 and G2/M diploid RPE-1 cells and G1 tetraploid RPE-1 cells (a) were generated using the standard version of the Aneufinder algorithm and genome-wide copy number plots of G1 tetraploid BJ cells (b) were generated using a modified version of the Aneufinder algorithm (see methods). G2/M conditions were normalized using G1 cells. Each row represents a cell. The copy number state (in 1-Mb bins) is indicated in color (with aberrations contrasting from green in diploid G1 (2n) or from yellow in diploid G2/M or tetraploid G1 (4n). (c) Table showing aneuploidy and heterogeneity scores in the indicated conditions. (d) Graph showing the number of aneuploid chromosomes per cell in the diploid G1 and G2/M (in gray) and in tetraploid G1 and G2/M (in blue) cells. The percentage of cells with ≥1 aneuploid chromosome is indicated under the graph. ANOVA test (one-sided) (d, left panel). t-test (two-sided) (d, right panel). Source data
Extended Data Fig. 8
Extended Data Fig. 8. DNA damage analysis in 3D cultures.
(a) Left panel - Representative cell cycle distribution of diploid and tetraploid RPE-1 cells. Right panels - RNA content in diploid (in gray) and tetraploid (in blue) populations. (b, c) Graphs showing the relative RNA levels in diploid (D, in gray) and tetraploid (T) cells generated through MS (b, blue) or EnR (c, red). (d) Representative images of cell sorting experiments according to cell cycle stage (RFP+ for G1 cells) and DNA content. (e) Graph showing the percentage of interphase tetraploid cells in diploid (gray) and tetraploid (blue) RPE-1 cell populations obtained after cell sorting. Mean ± SEM, > 100 interphase cells from at least three independent experiments were analyzed. (f, g) Graphs representing actin (f) and β-Catenin (g) levels relative to H2B levels (fold change) in total protein extracts from diploid (gray) and tetraploid (blue) cells. Mean ± SEM from at least three independent experiments. (h) Graph showing H2B levels in the chromatin bound fraction in diploid (gray) and tetraploid (blue) cells. Mean ± SEM from at least three independent experiments. (i, j) Graph representing G1 duration in diploid (gray) or tetraploid cells generated through MS (i, blue) or EnR (j, red). The dotted lines indicate the nuclear area. The white squares correspond to higher magnification. t-test (one-sided) (b, c, e, f, g, h, i and j). Source data
Extended Data Fig. 9
Extended Data Fig. 9. G1 lengthening restores DNA replication dynamics and results in a decrease in the levels of DNA damage in tetraploid cells.
(a, b) RPE-1 cell cycle profile and percentage of cells in the indicated conditions. Mean ± SEM, > 30 000 cells from at least three independent experiments. (c) RPE FUCCI in diploid and tetraploid cells treated with 160 nM palbociclib. (d) Stills of time lapse videos of diploid and tetraploid RPE-1 PCNAchromo cells with extended G1. Active replication sites visualized using PCNA chromobodies (cyan) and reconstructed using Imaris in 3D (red). (e) Active replication sites average number over time with extended G1. Mean ± SEM, > 11 S-phase cells analyzed, two independent experiments (see Supplementary Data 1). (f) Active replication sites total number with extended G1. Mean ± SEM, > 11 S-phase cells were analyzed, two independent experiments. (g) Active replication sites volume (µm3) with extended G1. Mean ± SEM, > 1000 Active replication sites analyzed, three independent experiments. (h) EdU foci number relative to nuclear area with extended G1. Mean ± SEM, > 100 interphase cells, at least three independent experiments. (i) Ratio of early/late S phase duration ± extended G1. Mean ± SEM, > 70 cells, two independent experiments. (j) S-phase duration ± extended G1. Mean ± SEM, > 70 cells, two independent experiments. (k) H2B levels in chromatin bound extracts. Mean ± SEM, four independent experiments. (l and m) FANCD2 or 53BP1 foci number in cells synchronized in G1 or released in S-phase ± extended G1. (n–p) γH2AX foci number in cells synchronized in G1 using the indicated treatments or released in S-phase ± extended G1. (q and r) γH2AX foci number in diploid and tetraploid BJ (q) or HCT116 (r) cells synchronized in G1 or released in S-phase ± extended G1. (l–r) Mean ± SEM, >100 interphase cells were analyzed, at least three independent experiments. The dotted lines indicate the nuclear area. ANOVA test (one-sided) (b, h, i, j, l, m, n, o, p, q and r). T-test (two-sided) (f, g and k). Source data
Extended Data Fig. 10
Extended Data Fig. 10. E2F1OE decreases DNA damage levels in tetraploid human cell lines and in Drosophila NBs.
(a) Western blot documenting the levels of E2F1 and tubulin from cell lysates obtained from diploid RPE-1 cells ± E2F1-HA over-expression (OE). (b–c) Graphs representing the number of γH2AX foci per interphase cell in diploid (D) and tetraploid (T) BJ (b) or HCT116 (c) cells released in S-phase ± E2F1 OE. Mean ± SEM, >100 interphase cells were analyzed from at least three independent experiments. (d) Graph showing wild type salivary gland cell (in gray), diploid (in gray) and polyploid NBs (in yellow) area (in µm2). Mean ± SEM, >60 cells were analyzed per condition. (e) Graph showing γH2Av indexes in diploid (in gray) or polyploid NBs (in yellow) induced through CF by depleting Pavarotti. Mean ± SEM, >40 cells were analyzed per condition. (f) Graph showing the cell area (µm2) of diploid (gray) and polyploid NBs (yellow) ± E2F1OE. Mean ± SEM, >30 cells were analyzed per condition. (g) Graph representing the γH2Av index in polyploid NBs ± 10µM nucleosides. Mean ± SEM, >28 cells were analyzed per condition. (h) Gene set enrichment analysis from GSEA. Plots show significant enrichment of DNA repair genes in near-tetraploid tumors when compared to near-diploid tumors in lung, bladder and ovarian cancers (TCGA pan cancer data set). (h) p value from false discovery rate (FDR; methods). ANOVA test (one-sided) (b, c, d, f). t-test (two-sided) (e and g). Source data

Comment in

References

    1. Zack TI, et al. Pan-cancer patterns of somatic copy number alteration. Nat. Genet. 2013;45:1134–1140. doi: 10.1038/ng.2760. - DOI - PMC - PubMed
    1. Bielski CM, et al. Genome doubling shapes the evolution and prognosis of advanced cancers. Nat. Genet. 2018;50:1189–1195. doi: 10.1038/s41588-018-0165-1. - DOI - PMC - PubMed
    1. López S, et al. Interplay between whole-genome doubling and the accumulation of deleterious alterations in cancer evolution. Nat. Genet. 2020;52:283–293. doi: 10.1038/s41588-020-0584-7. - DOI - PMC - PubMed
    1. Storchova Z, Kuffer C. The consequences of tetraploidy and aneuploidy. J. Cell Sci. 2008;121:3859–3866. doi: 10.1242/jcs.039537. - DOI - PubMed
    1. Storchova Z, Pellman D. From polyploidy to aneuploidy, genome instability and cancer. Nat. Rev. Mol. Cell Biol. 2004;5:45–54. doi: 10.1038/nrm1276. - DOI - PubMed